How large is the share of school-age children, adolescents and youth who are not enrolled in education? UNESCO Institute for Statistics indicator ROFST.1T3.CP measures the out-of-school rate for the official ages of primary, lower-secondary and upper-secondary education, both sexes combined. It is a participation measure for the school-age population, not a test-score measure or an adult educational-attainment indicator.
The 2024 dataset contains 120 country and area observations for the same reference year. The unweighted median is 9.5% and the mean is 13.8%. 27 observations are at or above 20%, 17 are at or above 30%, and 7 are at or above 40%. The Republic of Korea is 1.97%, among the lower observations in the dataset.
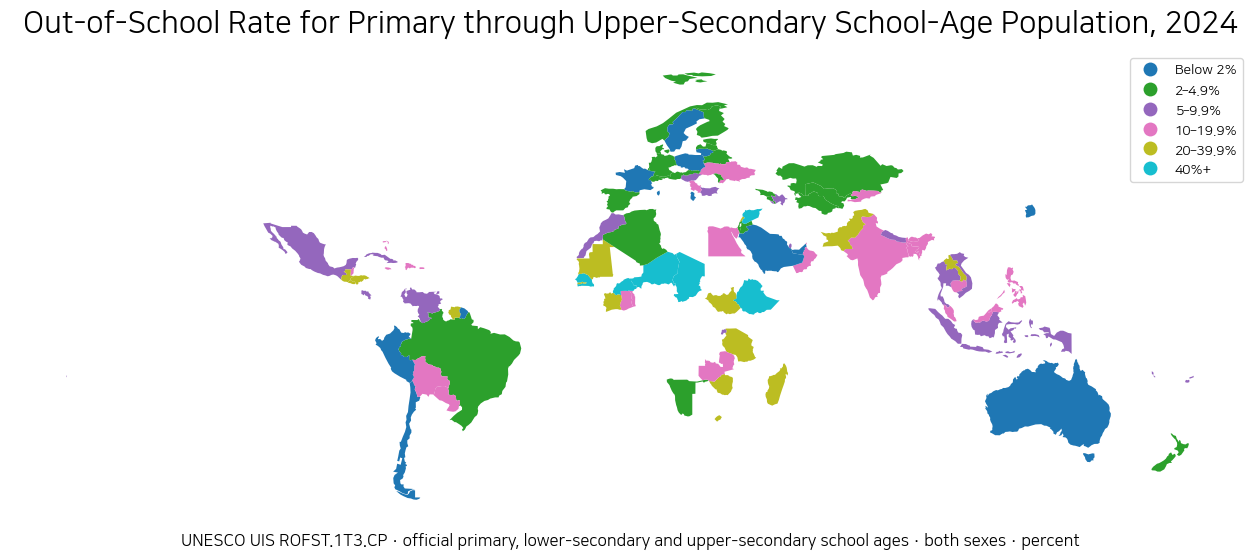
Table of Contents
The out-of-school rate is not the same as absenteeism or dropout
The UIS out-of-school rate measures the proportion of the official school-age population that is not enrolled in education. It is not a daily attendance measure, so a child who misses school for several days is not automatically counted as out of school. It is also broader than a dropout rate because people who never entered school can be part of the out-of-school population as well.
Under the UIS definition, children and young people in the official age range are considered out of school when they are not enrolled in pre-primary, primary, secondary or higher levels of education. The concept therefore focuses on whether the school-age population is connected to formal education rather than whether it is enrolled in exactly the grade expected for age.
This makes the indicator especially useful for access and participation. It does not directly measure learning proficiency, grade repetition, the quality of teaching, the number of days attended or the probability of completing a given level.
All 120 observations use 2024 as the reference year
A major strength of this dataset is time alignment: all 120 observations are dated 2024. That avoids the mixed-vintage problem common in some international education datasets where one country’s recent value is compared with another country’s older observation.
Coverage is still not universal. Several major countries do not have a 2024 row in this extract, including the United States, Canada and Japan. The ranking and threshold counts should therefore be described as a comparison among the 120 countries and areas with a 2024 observation, not as a complete world league table.
Twenty-seven observations are at or above 20%
27 of the 120 observations have an out-of-school rate of at least 20%. 17 are at least 30%, 7 are at least 40%, and 3 exceed 50%. At the other end, 63 are below 10% and 39 are below 5%.
The first quartile is 3.7% and the third quartile is 18.6%. The upper tail includes values above 50%, which is why the mean sits above the median.
| Rank | Country or area | ISO3 | 2024 out-of-school rate |
|---|---|---|---|
| 1 | Tokelau | TKL | 66.4% |
| 2 | Niger | NER | 61.2% |
| 3 | Burkina Faso | BFA | 50.2% |
| 4 | Senegal | SEN | 48.6% |
| 5 | Chad | TCD | 45.4% |
| 6 | Syrian Arab Republic | SYR | 44.7% |
| 7 | Ethiopia | ETH | 41.0% |
| 8 | South Sudan | SSD | 39.5% |
| 9 | Honduras | HND | 37.8% |
| 10 | Lesotho | LSO | 36.2% |
| 11 | United Republic of Tanzania | TZA | 35.5% |
| 12 | Lebanon | LBN | 32.9% |
| 13 | Suriname | SUR | 32.5% |
| 14 | Pakistan | PAK | 32.2% |
| 15 | Lao PDR | LAO | 31.5% |
Tokelau, Niger and Burkina Faso have the highest observations
Tokelau has the highest value at 66.4%, followed by Niger at 61.2% and Burkina Faso at 50.2%. Senegal is 48.6%, Chad 45.4%, the Syrian Arab Republic 44.7% and Ethiopia 41.0%. A high value means a large share of the relevant school-age population is not enrolled.
The dataset does not explain the causes of those high rates. Distance to school, direct and indirect costs, conflict and displacement, child labour, disability, gender barriers, household income, school capacity and other factors may matter. Causal claims require additional evidence beyond this participation indicator.
The Republic of Korea is 1.97%, among the lower observations
The Republic of Korea records 1.97% in 2024. It is the 12th-lowest observation among the 120 rows. France is 1.28% and Australia 1.59%, while Germany is 2.85%.
Brazil is 4.03%, Indonesia 7.49%, Mexico 9.72%, Bangladesh 18.27% and India 18.55%. The spread remains wide even when every observation uses the same 2024 reference year and the same UIS indicator.
| Country | 2024 out-of-school rate |
|---|---|
| Republic of Korea | 2.0% |
| France | 1.3% |
| Australia | 1.6% |
| Germany | 2.8% |
| Brazil | 4.0% |
| Mexico | 9.7% |
| Indonesia | 7.5% |
| India | 18.5% |
| Bangladesh | 18.3% |
Only five observations are below 1%
Only 5 observations fall below 1%: the United Arab Emirates at 0.10%, Poland 0.32%, Saudi Arabia 0.55%, Albania 0.68% and Lithuania 0.80%. Broadening the threshold to below 2% gives 12 observations.
A very low out-of-school rate should not be interpreted as proof that every education outcome is strong. Enrollment does not by itself guarantee regular attendance, appropriate grade placement, learning achievement, safety, inclusion or high-quality teaching.
Low out-of-school rates do not automatically mean high learning outcomes
A high enrollment share is an important sign of access, but education quality requires different evidence. Minimum proficiency in reading and mathematics, repetition, attendance, teacher resources and school conditions answer different questions.
Likewise, reducing an out-of-school rate may require more than expanding school capacity. The underlying barriers can involve cost, safety, work, disability, migration, language or social exclusion, and different barriers require different policy responses.
Compulsory-schooling laws and actual participation are different indicators
The legal duration of compulsory education describes how many years children are required by law to attend school. The out-of-school rate describes the share of the official school-age population that is not enrolled. The two can be related, but one does not mechanically determine the other.
A country can have a long compulsory period while still facing participation barriers, and countries with different legal structures can have similar enrollment outcomes. Reading compulsory-education duration alongside the out-of-school rate helps separate the legal framework from actual school participation.
Current school participation and adult attainment operate on different time horizons
ROFST.1T3.CP describes children, adolescents and youth who are of official school age in 2024. Adult attainment indicators for people age 25 and older describe education accumulated over many generations.
If a country sharply reduces its out-of-school rate today, adult lower- or upper-secondary attainment will not change immediately. Conversely, a country can still show low adult attainment because of historical exclusion even after current participation improves.
The 13.85% mean is not the world population’s out-of-school rate
The simple mean across the 120 observations is 13.85% and the median is 9.45%. Each country or area receives the same statistical weight in those summaries, regardless of the size of its school-age population.
A population-weighted global rate requires the official school-age population for each country or a UIS regional or global aggregate designed for that purpose. The mean here describes the distribution of the 120 country and area rows, not the share of all school-age children and youth in the world who are out of school.
Blank areas on the map do not mean zero
Of the 120 statistical rows, 95 match separate polygons in the low-resolution world boundary layer used for the map. Small islands and separately reported territories such as Tokelau may have a valid statistical observation without a distinct visible polygon at this map scale.
Countries absent from the 2024 extract are also left unclassified. Missing data and a measured value of zero are different statistical states. The map uses six bands ranging from below 2% to 40% or more.
Data source and calculation method
UNESCO UIS Data Browser provides the 2024 ROFST.1T3.CP observations. The definition follows the UIS Glossary entry for the out-of-school rate.
The mean, median, quartiles, rankings and threshold counts treat the 120 country and area observations equally. The official unit is percent and the published values are used directly. The official indicator and dataset provider is UNESCO Institute for Statistics.
Frequently Asked Questions
Is the out-of-school rate the same as the dropout rate?
No. It measures the share of the official school-age population that is not enrolled. It can include people who never entered school as well as those who left school, so it is broader than a dropout rate.
What is the Republic of Korea’s 2024 out-of-school rate?
The 2024 UIS observation for the Republic of Korea is 1.97%, placing it among the lower values in the 120-country-and-area dataset.
How many countries and areas have rates of 20% or more?
Twenty-seven of the 120 observations are at or above 20%. Seventeen are at or above 30%, and seven are at or above 40%.
Does a low out-of-school rate prove that learning quality is high?
No. The indicator measures enrollment access. Learning proficiency, attendance, grade placement, teaching quality and school conditions require separate indicators.
Related Articles
- Compulsory Education Duration by Country | 2025 World Map
- Global Lower-Secondary-or-Higher Attainment Map | Adults 25+ by Country
- Global Upper-Secondary Attainment Map | Adults 25+ by Country
Green Map creates custom-edited map images using open geographic data sources such as geoBoundaries, Natural Earth, OpenStreetMap, and government open data.
These maps are edited visual materials, not raw data files, and are provided for education, documents, presentations, and graphic reference.