A table of gross national income can look like a straightforward country ranking until the unit is current LCU. World Bank indicator NY.GNP.MKTP.CN, GNI (current LCU), reports gross national income at current prices in each economy’s own local currency unit. The 2024 extract contains 180 country and area observations. Their raw numbers span many orders of magnitude, but that spread combines economic size with the denomination of the local currency.
That makes this series useful for a different question than a conventional global income ranking. It is well suited to describing nominal national income inside a country and to connecting national accounts with other domestic-currency statistics. It is not a common monetary scale across countries. The map below therefore visualizes the numerical order of magnitude of each LCU value, not a ranking of national wealth.
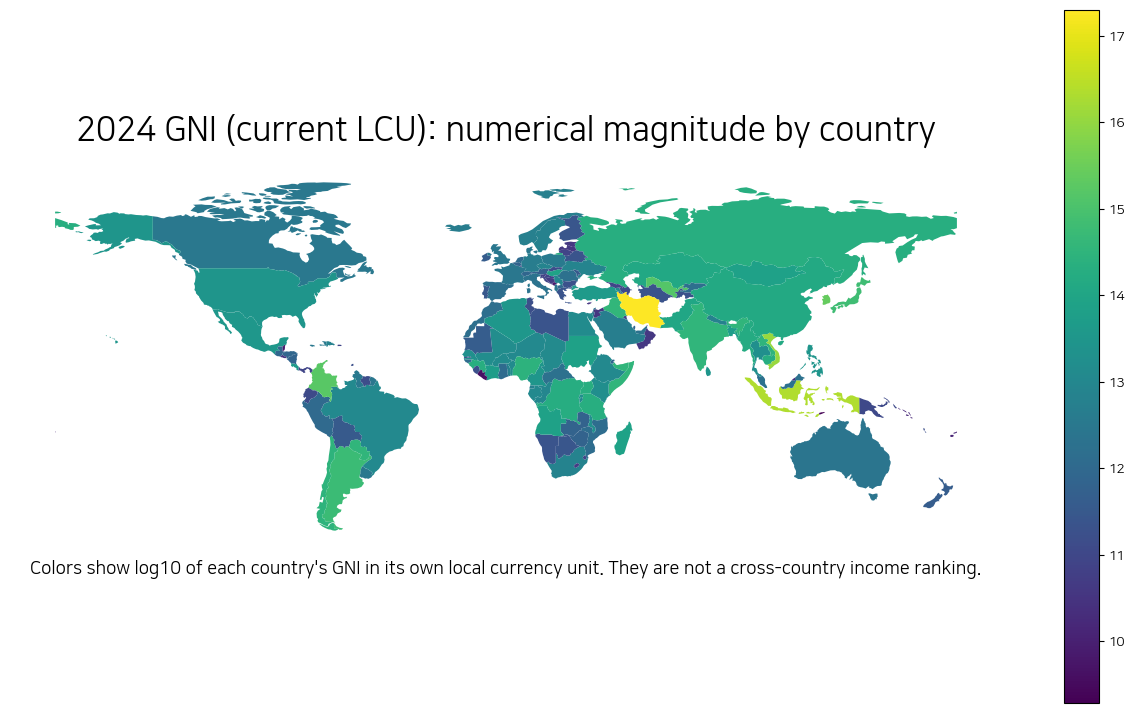
Table of Contents
What GNI and current LCU mean
Gross national income measures income accruing to residents of an economy. In the World Bank definition, it can be understood as gross domestic product plus income receivable from abroad minus income payable abroad. GDP focuses on production taking place within the economic territory, while GNI adjusts that domestic production concept for cross-border income flows so that the emphasis is income attributable to residents.
The word current means that the series is measured at prices prevailing in the observation period. It has not been adjusted to remove changes in the price level over time. LCU means local currency unit. Each observation is therefore expressed in the unit used for that economy’s domestic national accounts rather than in a shared currency such as the U.S. dollar.
Putting those two pieces together, NY.GNP.MKTP.CN is a nominal domestic-currency measure of total GNI. It can be intuitive inside one economy, but the unit changes when the country changes. Once values from different currencies are sorted into a single global table, the numbers no longer share a common denominator.
Why the 180 raw values cannot be turned into a valid global ranking
The 2024 observations range numerically from about 332,401,831 LCU for Marshall Islands to about 197,581,000,000,000,000 LCU for Iran (Islamic Republic of). On a base-10 logarithmic scale, the range runs from roughly 8.52 to 17.30. That is close to nine orders of magnitude in the written numbers. It is not evidence of a nine-order-of-magnitude gap in comparable national income.
A currency with a small unit can require a very large number to express a given economic amount, while another currency with a larger unit can express an economy of similar or greater size with fewer digits. Exchange rates are not built into the LCU values. As a result, dividing one country’s LCU figure by another country’s figure does not produce an economically meaningful cross-country ratio.
| Country | ISO3 | 2024 raw GNI value |
|---|---|---|
| Republic of Korea | KOR | 2,593.760 trillion LCU |
| United States | USA | 29.243 trillion LCU |
| Japan | JPN | 649.898 trillion LCU |
| China | CHN | 133.967 trillion LCU |
| Germany | DEU | 4.459 trillion LCU |
| India | IND | 326.249 trillion LCU |
| Indonesia | IDN | 21,554.500 trillion LCU |
| Brazil | BRA | 11.384 trillion LCU |
Every row in this table uses a different local currency where the countries use different currencies. For example, the Republic of Korea’s 2,593.760 trillion LCU and the United States’ 29.243 trillion LCU cannot be used to claim that Korea’s GNI is roughly 89 times larger. The arithmetic would be comparing unlike monetary units.
What the map is actually showing
The map joins the 2024 observations to a low-resolution country boundary layer. Of the 180 data rows, 158 are represented as country polygons in that boundary layer. Several small island economies and special areas do not have separate polygons at this resolution, so absence from the map does not imply absence from the source data.
The mapped variable is log10 of the raw LCU value. A value near 12 means that the written national-income number is around the trillion-LCU scale, while a value near 15 is around the quadrillion-LCU scale. The logarithm is used only to make a very wide numerical range visible. It does not convert currencies and it does not create a common purchasing-power scale.
That limitation is the point of the visualization. Two countries with similar map shades do not necessarily have similar national incomes, and countries with very different shades do not necessarily have comparably large differences in economic size. The map illustrates the denomination problem rather than solving it.
Which GNI measure should be used for cross-country comparisons
If the question is which country had the larger nominal total GNI in the same year, a series expressed in a common currency is more appropriate. The World Bank also publishes GNI in current U.S. dollars. A common currency does not remove every comparability issue, but it does remove the most obvious problem in current LCU: each row being expressed in a different monetary unit.
If the question is about income per person rather than total economic size, total GNI is the wrong denominator. GNI per capita is designed for that purpose. If local price levels matter, purchasing-power-parity measures address a different comparison. And if the goal is to study real change through time inside one economy, a constant-price local-currency series is usually more informative than a current-price series.
- Nominal total size across countries: use a GNI series converted to a common currency.
- Income per person: use GNI per capita rather than total GNI.
- Differences in local purchasing power: use an appropriate PPP-based measure.
- Real domestic change over time: use a constant-price series rather than current LCU.
- Household living standards: combine national accounts with household income, consumption, distribution, tax and price information.
Where current LCU is genuinely useful
The cross-country limitation does not make current LCU useless. Within a single economy, the unit is usually consistent with budgets, tax collections, banking statistics and other domestic nominal quantities. It can therefore be a convenient way to understand how large national income is in the monetary terms used by local institutions and businesses.
The current-price qualifier still matters. A 30% increase in current-LCU GNI between two years does not automatically mean real national income increased by 30%. Inflation can raise the nominal value even when the volume of real economic activity changes much less. For a price-adjusted domestic trend, the World Bank’s constant-LCU GNI series answers a different and usually more suitable question.
Reading Korea and other major economies without making a false ranking
The Republic of Korea’s 2024 GNI (current LCU) is about 2,593.760 trillion LCU. The United States is about 29.243 trillion LCU, Germany 4.459 trillion, Japan 649.898 trillion, China 133.967 trillion and India 326.249 trillion. Those raw figures are meaningful in their own national-currency contexts, but they are not a shared global scale.
Indonesia is about 21,554.500 trillion LCU and Brazil about 11.384 trillion LCU. The enormous difference in written digit length is exactly why the indicator should not be sorted as though every LCU were the same currency. A cross-country comparison needs a conversion rule or a different indicator designed around a common unit.
Data source and mapping method
The indicator definition follows the World Bank World Development Indicators metadata for NY.GNP.MKTP.CN. The World Bank describes GNI as total income earned by residents and states that this series uses current prices and local currency units.
The analysis uses 180 observations dated 2024. There are no missing or non-positive values in the supplied same-year set and no duplicate ISO3 country codes. The map converts the raw values to log10 only for visualization; tables retain the original LCU values. No cross-currency ranking, mean or median is presented as an economic comparison because those operations would combine unlike monetary units.
Frequently Asked Questions
Can GNI (current LCU) be used to rank countries by national income?
Not from the raw LCU values. Different countries use different local currency units, so the numbers do not share a common monetary scale. A common-currency GNI series is more suitable for nominal cross-country totals.
What does current mean in GNI (current LCU)?
It means the value is measured at prices prevailing in the observation period. Inflation has not been removed, so changes through time can reflect both real changes and price changes.
Why can Korea have a much larger LCU number than the United States?
Because the local currency units are different. The number of units needed to express an economic amount depends partly on the denomination of the currency, so the raw figures cannot be compared directly.
What should I use to compare living standards across countries?
Use an indicator matched to the question: GNI per capita for per-person income, PPP-based measures when local price levels matter, and constant-price measures for real changes over time.
Related Maps
Green Map creates custom-edited map images using open geographic data sources such as geoBoundaries, Natural Earth, OpenStreetMap, and government open data.
These maps are edited visual materials, not raw data files, and are provided for education, documents, presentations, and graphic reference.