Gender gaps in education can be examined at a lower threshold than completing primary school. UNESCO Institute for Statistics (UIS) indicator EA.S1T8.AG25T99.GPIA compares women and men age 25 and older on educational attainment of at least some primary schooling. The 2023 data used here contain 89 countries and separately reported areas.
The number is not an attainment percentage. GPIA is a ratio-style index that compares the female value of the underlying attainment indicator with the male value. Values close to 1 mean that the two values are similar. For a favorable attainment indicator such as this one, values below 1 point to lower female attainment relative to male attainment.
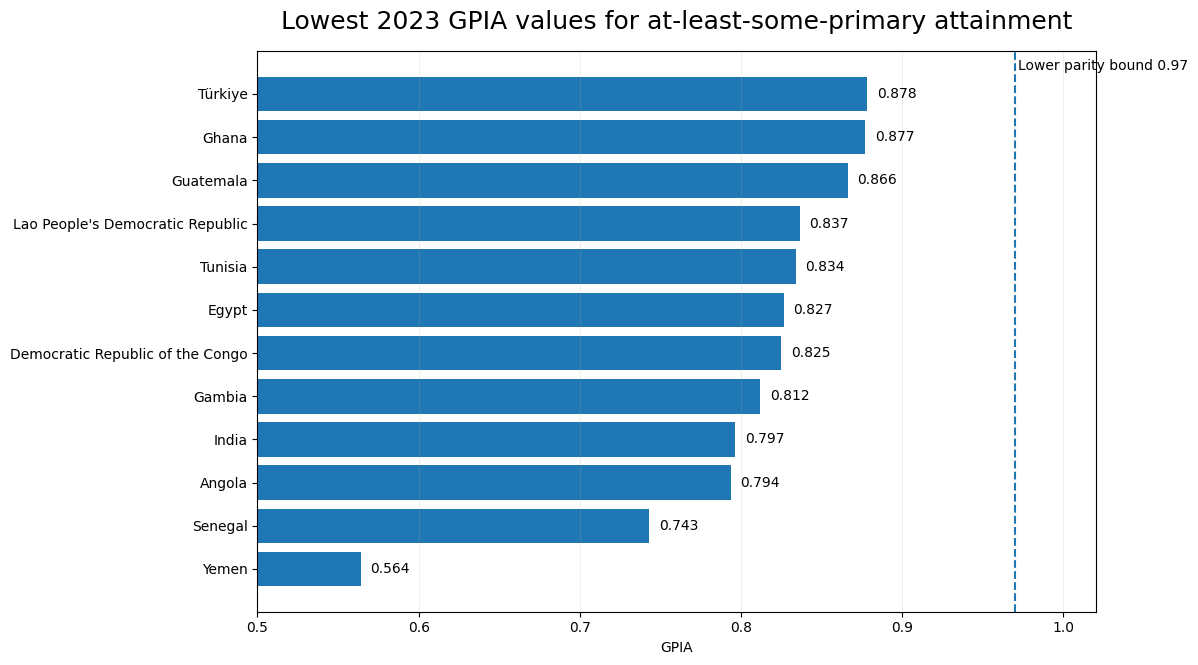
Table of Contents
What a GPIA value of 1 means
The standard gender parity index divides the female value of an indicator by the male value. Equal values produce a GPI of 1. Because the ordinary ratio is not symmetrical around 1, UIS adjusts the formula when the female value is higher. The resulting adjusted gender parity index, or GPIA, makes distances on either side of 1 easier to compare.
UIS commonly uses 0.97 to 1.03 as a practical parity band. Values such as 0.99 and 1.01 point in opposite directions but are usually treated as gender parity. A value much farther from 1, such as 0.80, indicates a substantially larger relative gap.
The wording “at least some primary” is also important. This is a lower educational threshold than completing primary school. It includes adults who reached at least some primary schooling as well as those who went on to higher levels, so it should not be confused with a primary-completion attainment measure.
65 of 89 observations fall inside the parity band
Of the 89 observations for 2023, 65, or 73.0%, fall between 0.97 and 1.03. The remaining 24, or 27.0%, are all below 0.97. None is above 1.03. The median is exactly 1.000, while the simple mean is 0.964, pulled down by a smaller set of low observations.
| GPIA range | Reading for this attainment indicator | Rows | Share of 89 |
|---|---|---|---|
| Below 0.97 | Female attainment is lower than male attainment beyond the usual parity band | 24 | 27.0% |
| 0.97 to 1.03 | Commonly used gender-parity band | 65 | 73.0% |
| Above 1.03 | Female attainment is higher than male attainment beyond the usual parity band | 0 | 0.0% |
These shares describe only the 89 countries and areas with a 2023 value in this series. They are not a population-weighted world estimate and should not be read as the exact share of all countries worldwide.
The largest gaps are all on the below-1 side
Yemen has the lowest 2023 value at 0.564. Senegal follows at 0.743, then Angola at 0.794, India at 0.797 and the Gambia at 0.812. The Democratic Republic of the Congo and Egypt are near 0.83, while Tunisia and Lao PDR are also below 0.84. In this 89-row set, every observation outside the parity band lies below 0.97.
| Country or area | 2023 GPIA | Distance from 1 |
|---|---|---|
| Yemen | 0.564 | 0.436 |
| Senegal | 0.743 | 0.257 |
| Angola | 0.794 | 0.206 |
| India | 0.797 | 0.203 |
| Gambia | 0.812 | 0.188 |
| Democratic Republic of the Congo | 0.825 | 0.175 |
| Egypt | 0.827 | 0.173 |
| Tunisia | 0.834 | 0.166 |
| Lao People’s Democratic Republic | 0.837 | 0.163 |
| Guatemala | 0.866 | 0.134 |
| Ghana | 0.877 | 0.123 |
| Türkiye | 0.878 | 0.122 |
When GPIA is at or below 1, the index has the same direction as the female-to-male ratio for the underlying indicator. Yemen’s 0.564 therefore indicates a large relative shortfall in female attainment at this threshold. It does not mean that 56.4% of women have some primary schooling; the number is an index, not the underlying attainment rate.
The index also cannot explain why the gap exists. Understanding causes requires separate evidence on school access, age cohorts, household resources, conflict and displacement, geography, institutions, and other country-specific factors.
Values above 1 all remain inside the parity band
Botswana has the highest value in the 2023 set at 1.020. Nauru is 1.013, Wallis and Futuna Islands 1.012, Mongolia 1.011 and Seychelles 1.008. These values are above 1, so the female attainment value is higher in direction, but all remain below the 1.03 upper bound.
A value slightly above 1 should therefore not be interpreted as excessive advantage for women. The 0.97–1.03 interval is commonly treated as parity, and the adjusted formula is designed to compare the distance from 1 in a balanced way.
Korea is just below the usual lower bound
The Republic of Korea has a 2023 GPIA of 0.969, roughly 0.001 below the commonly used lower bound of 0.97. The United States is 0.999, Germany 1.000 and the United Arab Emirates 0.987. India, at 0.797, is much farther from parity than these examples.
| Country | 2023 GPIA | Parity-band reading |
|---|---|---|
| Republic of Korea | 0.969 | Just below lower bound |
| United States | 0.999 | Within parity band |
| Germany | 1.000 | Within parity band |
| United Arab Emirates | 0.987 | Within parity band |
| India | 0.797 | Below 0.97 |
| Botswana | 1.020 | Within parity band |
Again, parity and level are different questions. A GPIA of 1.000 says the female and male values are similar; it does not guarantee that both sexes have a high absolute attainment rate. Equal outcomes can occur at either a high or a low level.
At least some primary is not the same as completed primary
This indicator is useful for asking whether women and men accumulated basic exposure to schooling at similar rates. Because the threshold is at least some primary education, it is lower than a measure that requires completing primary school. The two indicators can therefore reveal different stages of inequality.
For example, women and men might be similarly likely to enter primary school but differ in persistence through the end of primary education. In that case, parity at the “some primary” threshold could be closer to 1 than parity at the completed-primary threshold. The reverse comparison can also help distinguish access gaps from later dropout, although drawing a causal conclusion requires the underlying female and male rates and country-specific evidence.
Limits of this comparison
- The 2023 series contains 89 reporting countries and areas, not every country in the world.
- GPIA measures relative gender parity and does not replace the underlying attainment percentage or enrolment rate.
- Because the population is age 25 and older, the measure combines schooling experiences from older and younger adult cohorts.
- A value near 1 can coexist with low absolute attainment for both women and men.
- The index alone cannot identify the causes of a gender gap.
Data source and calculation
The analysis uses national-level 2023 observations for UNESCO Institute for Statistics indicator EA.S1T8.AG25T99.GPIA. There are 89 non-missing country or area rows. The parity counts, shares, mean, median and ranking tables above were calculated directly from those observations.
UIS uses the adjusted gender parity index to compare female and male indicator values around a center of 1. For this favorable attainment measure, values below 1 indicate lower female attainment in relative terms and values above 1 indicate higher female attainment in relative terms. The key quantity is the distance from 1, not a percentage interpretation of the index itself.
Frequently Asked Questions
Does “at least some primary” mean completed primary school?
No. It is a lower threshold that includes adults who reached some primary schooling as well as those who attained higher education levels.
What does a GPIA below 1 mean here?
For this favorable attainment indicator, it points to a lower female value relative to the male value. UIS commonly treats 0.97 to 1.03 as the parity band.
How many 2023 observations are within the parity band?
65 of 89 countries and areas, about 73.0%, fall between 0.97 and 1.03.
What is Korea’s 2023 value?
The Republic of Korea is 0.969, about 0.001 below the commonly used 0.97 lower bound.
Related Articles
- Primary-or-higher educational attainment for adults 25+ by country
- Lower-secondary-or-higher attainment for adults 25+ by country
- Bachelor's-or-higher educational attainment by country
Green Map creates custom-edited map images using open geographic data sources such as geoBoundaries, Natural Earth, OpenStreetMap, and government open data.
These maps are edited visual materials, not raw data files, and are provided for education, documents, presentations, and graphic reference.