Gender balance in bachelor’s-or-higher educational attainment varies sharply across the countries and areas with a 2023 observation. UNESCO Institute for Statistics indicator EA.6T8.AG25T99.GPIA is not the percentage of adults with a bachelor’s degree. It is the adjusted gender parity index (GPIA) comparing female and male attainment rates among people age 25 and older.
Among the 86 country and area observations, only 6 (7.0%) fall in the 0.97–1.03 interval commonly interpreted by UIS as gender parity. 33 are below 0.97 and 47 are above 1.03. These are unweighted country counts, not shares of the world’s adult population, but they show that bachelor’s-level gender balance is far from uniform across the available 2023 observations.
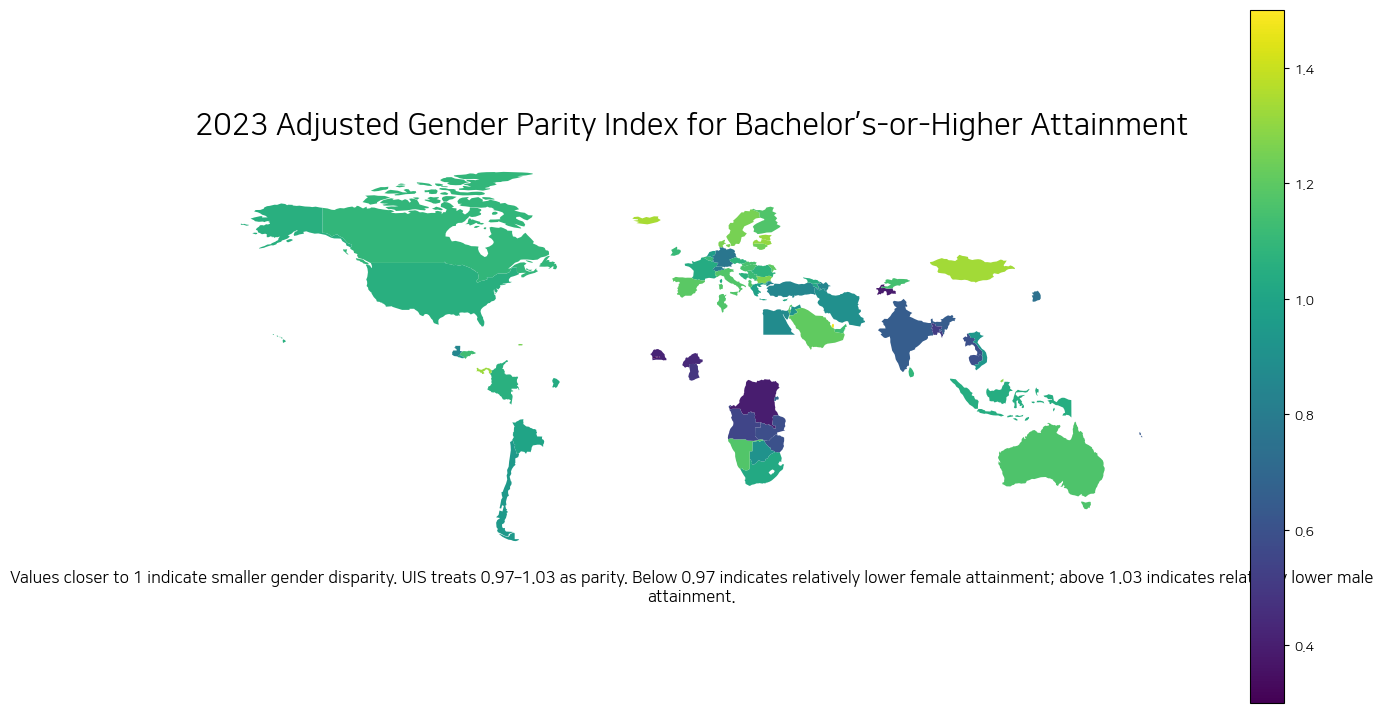
Table of Contents
GPIA measures the gender gap, not the bachelor’s attainment rate itself
The distinction between attainment level and parity is essential. A GPIA value near 1 does not mean that a country has a high share of adults with a bachelor’s degree. It means that the female and male attainment rates are similar. A country can have parity at a low attainment level, while another country can have high overall attainment but a sizeable gender gap.
UIS uses an adjusted parity index because the ordinary female-to-male ratio is not symmetric around 1. When the female indicator is less than or equal to the male indicator, the adjusted value is the female value divided by the male value. When the female indicator is higher, UIS transforms the ratio so that the index remains symmetric around 1 and bounded between 0 and 2.
That adjustment changes how values above 1 should be read. A GPIA of 1.40 does not literally mean that the female attainment rate is 40% higher than the male rate. The index is designed so that distance from 1 expresses comparable disparity on either side of parity.
Only six of the 86 observations fall inside the parity interval
The unweighted median across the 86 observations is 1.052, while the mean is 0.991. The mean being close to 1 should not be mistaken for widespread parity, because values below and above 1 can offset each other. Only 6 observations are actually inside the 0.97–1.03 interval.
The observations inside the interval are El Salvador, Greece, Bolivia, Armenia, Cyprus and South Africa. This does not mean those countries have the same bachelor’s attainment rate or the same education system; it only means that their female and male attainment rates are close enough to fall within the UIS parity band in 2023.
33 observations are below 0.97, indicating relatively lower female attainment, while 47 are above 1.03, indicating relatively lower male attainment. The larger count on the upper side describes this 86-country dataset and should not be generalized to the entire global adult population.
The largest gaps appear on both sides of 1
The lowest observation is Gambia at 0.323. Tajikistan, the Democratic Republic of the Congo, Senegal and Burkina Faso are also among the lowest values. For a higher-is-better attainment indicator, this side of the scale means female bachelor’s-or-higher attainment is relatively lower than male attainment.
The highest observation is Qatar at 1.469. Grenada, Bahrain, Iceland, Mongolia, Panama, Estonia and Latvia are also well above 1. On this side, male attainment is relatively lower than female attainment.
Because GPIA is constructed symmetrically, a value such as 0.6 and a value such as 1.4 are both 0.4 away from parity and represent disparity in opposite directions on the adjusted scale. The indicator does not explain why the gap exists. Historical access to higher education, migration, age structure, conflict, labour-market incentives and national qualification systems require separate evidence.
Korea is at 0.744, on the side of relatively lower female attainment
The Republic of Korea has a 2023 GPIA of 0.744. Because that is below 0.97, female bachelor’s-or-higher attainment among adults age 25 and older is relatively lower than male attainment in this dataset. The measure should not be confused with the gender composition of current university students or the current year’s graduates.
The age-25-plus denominator combines multiple generations. Even if gender differences among younger cohorts have narrowed or reversed, historical differences in access to higher education can remain visible in the accumulated adult attainment measure for many years.
| Country | ISO3 | 2023 GPIA | Interpretation |
|---|---|---|---|
| Republic of Korea | KOR | 0.744 | Female attainment relatively lower |
| United States | USA | 1.057 | Male attainment relatively lower |
| Germany | DEU | 0.769 | Female attainment relatively lower |
| France | FRA | 1.034 | Male attainment relatively lower |
| Canada | CAN | 1.091 | Male attainment relatively lower |
| Australia | AUS | 1.165 | Male attainment relatively lower |
| India | IND | 0.648 | Female attainment relatively lower |
| South Africa | ZAF | 1.023 | Parity range |
The United States, France, Canada and Australia are above 1; Germany and India are below
The United States is at 1.057, France at 1.034, Canada at 1.091 and Australia at 1.165. All are above 1, and France is just beyond the upper parity threshold of 1.03. Canada and Australia are farther from parity on the same side of the index.
Germany is at 0.769 and India at 0.648, both on the side of relatively lower female attainment. South Africa is at 1.023 and therefore falls inside the 0.97–1.03 parity interval.
These comparisons still do not reveal absolute educational attainment. Two countries can have the same GPIA while having very different bachelor’s-or-higher attainment rates for both women and men. For a fuller picture, the parity index should be read alongside total attainment and, where available, the female and male component rates.
The geographic pattern is descriptive, not a causal explanation
The map matches 76 of the 86 statistical rows to country polygons in a low-resolution world boundary layer. Some small islands and separately reported areas do not have independent polygons at this resolution, so a missing map shape should not be interpreted as a zero value.
Several observations in Sub-Saharan Africa and South Asia appear below 1, while many observations in North America, Oceania, Europe and parts of the Middle East and Latin America are above 1. That pattern is descriptive. The dataset contains the parity outcome, not the policy, economic or social variables needed to establish a cause.
Parity and educational level answer different questions
A country can be close to parity because female and male attainment are both high, or because both are low. Likewise, a country with a high overall bachelor’s attainment rate can still have a gender imbalance. This is why gender parity and attainment level should not be collapsed into a single interpretation.
A practical sequence is to examine the overall bachelor’s-or-higher attainment rate first, then use GPIA to identify the direction and size of the gender gap. If the underlying female and male rates are available, those component series can show which side of the comparison is changing over time.
Data source and calculation method
Country values come from the UNESCO UIS Data Browser for EA.6T8.AG25T99.GPIA, using the 2023 national observations. The definition and adjusted-parity calculation follow UIS guidance on parity indices.
The 86 observations are treated equally in the summary counts, mean and median; these statistics are not population-weighted. The source metadata labels the unit as percent, but the values are interpreted correctly here as an adjusted parity index on a 0–2 scale rather than as percentages.
Values from 0.97 through 1.03 are classified as parity. Values below 0.97 indicate relatively lower female attainment for this higher-is-better indicator, while values above 1.03 indicate relatively lower male attainment. Because GPIA uses an adjustment above 1, index values are not converted into simple percentage advantages.
Frequently Asked Questions
Does a GPIA of 1 mean bachelor’s attainment is high?
No. A value of 1 means female and male attainment rates are equal. Their absolute attainment levels can both be high or both be low.
Why is 0.97–1.03 treated as the parity range?
UNESCO UIS commonly interprets parity-index values from 0.97 to 1.03 as gender parity, allowing for small measurement variation.
What does Korea’s 0.744 value mean?
For 2023 adults age 25 and older, it places Korea on the side where female bachelor’s-or-higher attainment is relatively lower than male attainment. It is not the gender ratio of current university students.
Does a GPIA of 1.4 mean female attainment is 40% higher?
No. Values above 1 use the adjusted parity formula, so the index should be read by its direction and distance from 1 rather than as a direct percentage advantage.
Related Maps
Green Map creates custom-edited map images using open geographic data sources such as geoBoundaries, Natural Earth, OpenStreetMap, and government open data.
These maps are edited visual materials, not raw data files, and are provided for education, documents, presentations, and graphic reference.