What share of adults age 25 and older have attained or completed a doctoral-level qualification? This article uses World Bank World Development Indicators series SE.TER.CUAT.DO.ZS to map the latest available non-null observation for each reporting country or separately reported area. The indicator is narrow by design: it describes doctoral or equivalent educational attainment in the adult population, not the size of the current PhD student population.
The most important limitation is the reference year. The verified CSV contains 144 country/area rows, but their latest observations span 2001–2024. Only 18 rows are from 2024, while the largest single-year group is 2023 with 43 rows. The map should therefore be read as a latest-available snapshot, not as a 2024 global doctoral-attainment ranking.
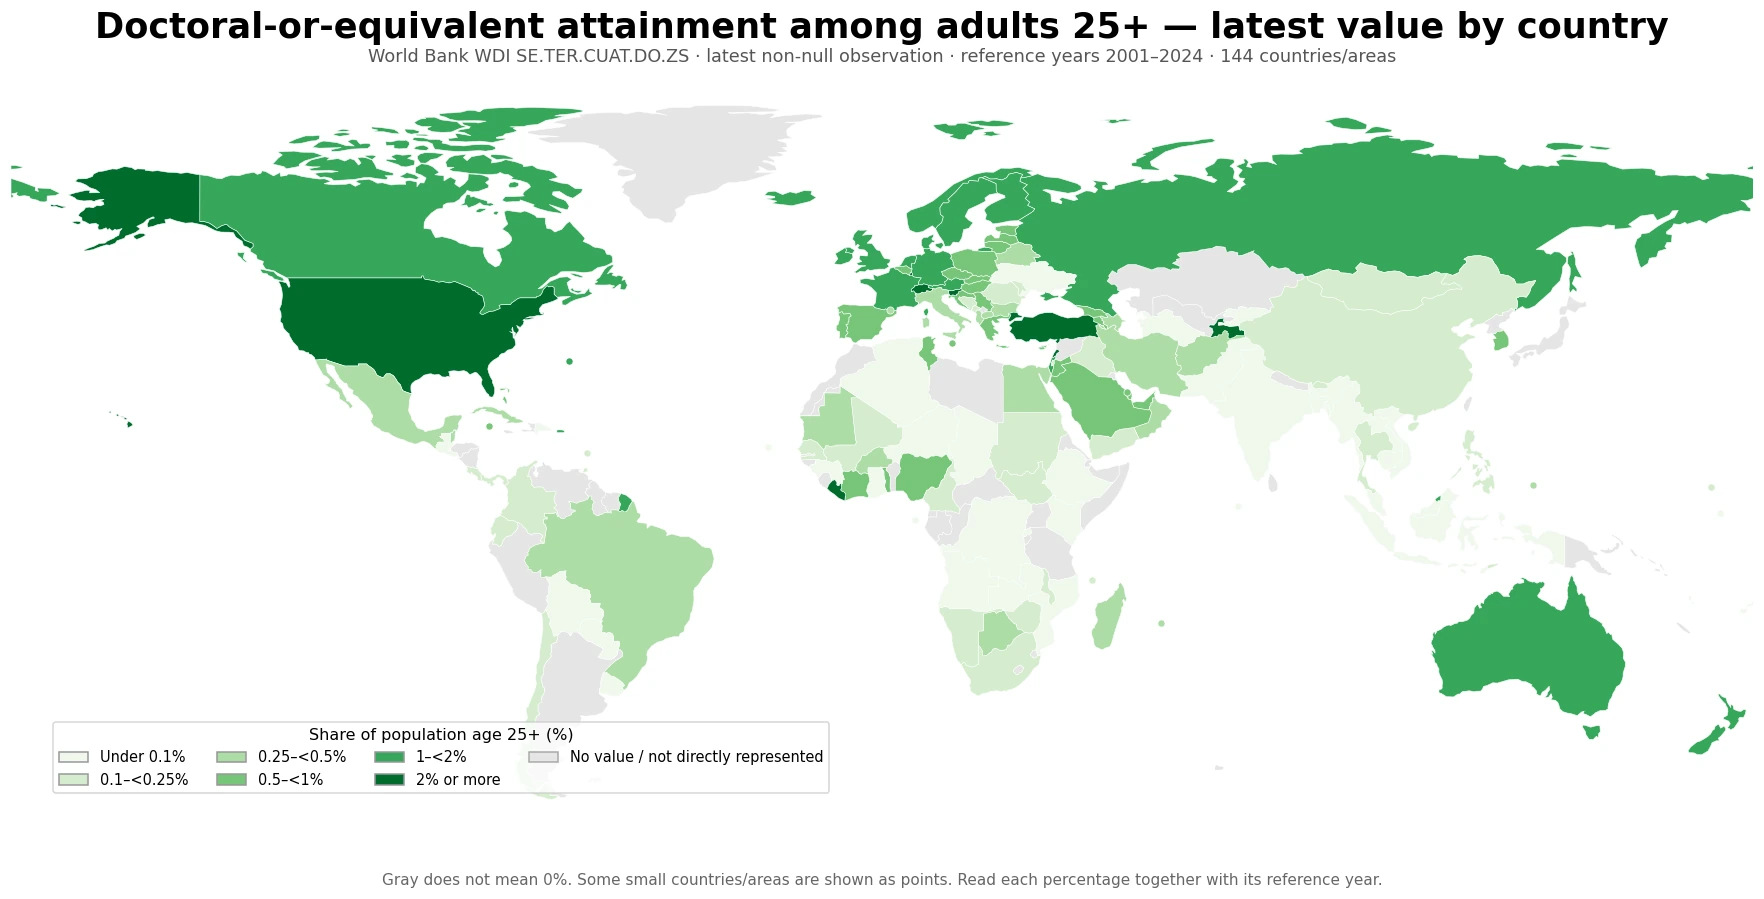
Table of Contents
The indicator is not the current PhD enrollment rate
The official World Bank series name is Educational attainment, Doctoral or equivalent, population 25+, total (%) (cumulative). Its long definition is the percentage of the population age 25 and older that attained or completed doctoral or equivalent education. The methodology divides the number of adults age 25+ at that attainment level by the total population in the same age group and multiplies by 100. The underlying provider identified in World Bank metadata is the UNESCO Institute for Statistics (UIS).
A value of 1% therefore does not mean that 1% of adults are currently enrolled in a doctoral program, nor does it measure how many doctorates were awarded in one year. It is closer to a stock measure of accumulated educational attainment among multiple adult generations. National degree systems and qualification structures are not perfectly identical, so very small decimal differences should not be treated as a precise league table of education systems.
The median of the 144 latest observations is about 0.29%
Giving each country/area row equal weight, the simple median of the 144 latest observations is 0.29% and the unweighted mean is 0.59%. Doctoral attainment is a much higher educational threshold than bachelor-level attainment, so most percentages are small. These summary statistics are not a population-weighted estimate of the share of all adults worldwide with doctoral-level attainment; a populous country and a small island economy each contribute one row.
| Latest-value band | Countries/areas |
|---|---|
| Under 0.1% | 36 |
| 0.1–<0.25% | 31 |
| 0.25–<0.5% | 21 |
| 0.5–<1% | 29 |
| 1–<2% | 19 |
| 2% or more | 8 |
36 rows are below 0.1%, and another 31 are from 0.1% to under 0.25%. At the other end, 19 rows are from 1% to under 2%, while 8 are at 2% or above. This wide distribution is useful for describing attainment differences, but a low share is not by itself evidence of weak research capacity or poor university quality. The dataset contains no R&D spending, researcher counts, publication output, patents, or learning-quality measure.
Three quarters of the latest rows are from 2019 or later, but only 18 are from 2024
Of the 144 rows, 108 (75.0%) are dated 2019 or later: 18 from 2024, 43 from 2023, 18 from 2022, 10 from 2021, 12 from 2020, and 7 from 2019. The remaining 36 observations are from 2018 or earlier, and the oldest retained latest observation is dated 2001. Adult attainment usually changes more slowly than a monthly economic indicator, but that does not make a decade-old observation equivalent to a 2024 measurement.
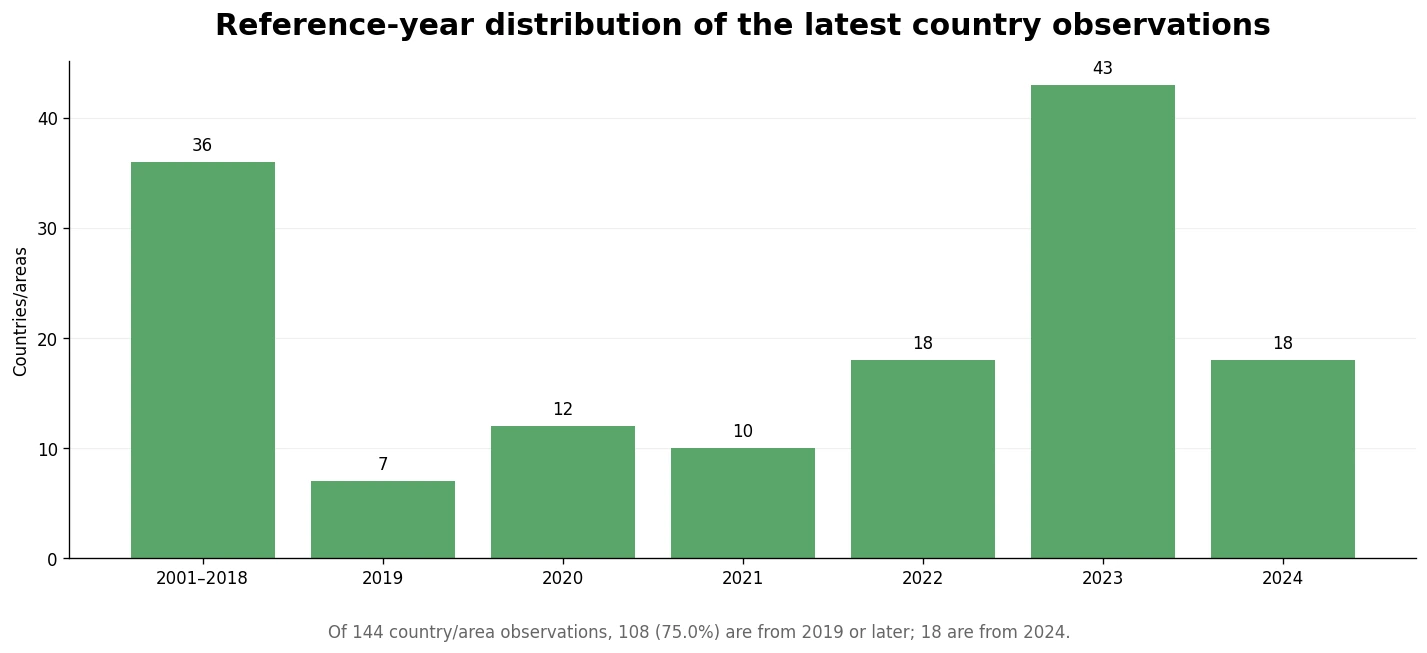
Restricting the dataset to the 108 observations dated 2019 or later produces a median of 0.37% and an unweighted mean of 0.66%. Those values are somewhat higher than the full mixed-vintage set, but this cannot be interpreted as a global time trend. The recent subset contains different countries rather than repeated observations of the same countries through time.
Recent observations still show a very wide gap
Within the 2019-or-later subset, relatively high observations include Switzerland at 3.31% (2024), Luxembourg at 2.84% (2023), Turkiye at 2.74% (2023), Lebanon at 2.41% (2019), Slovenia at 2.41% (2023), and the United States at 2.30% (2024). At the low end are Guatemala at 0.008% (2019), Turkmenistan at 0.020% (2022), Cabo Verde at 0.029% (2024), Ethiopia at 0.037% (2021), Pakistan at 0.039% (2021), and Bangladesh at 0.044% (2023).
This is not a ranking of education-system quality. The share of adults with doctoral-level attainment can vary with the size and history of graduate education, age structure, migration, professional credential pathways, labor-market demand, and the role of doctoral qualifications in different national systems. None of those explanatory variables is present in the supplied table, so the article reports the distribution without assigning causes.
Among the 18 countries with 2024 values, Switzerland, the United States and Australia are highest
A strict 2024-only filter leaves just 18 rows. Their median is 0.60% and their simple mean is 0.80%. This removes the year mismatch for those countries, but a sample of 18 cannot stand in for the whole world. It is best treated as a limited same-year comparison rather than a global 2024 ranking.
| Country/area | Reference year | Doctoral or equivalent attainment |
|---|---|---|
| Switzerland | 2024 | 3.31% |
| United States | 2024 | 2.30% |
| Australia | 2024 | 1.82% |
| Korea, Rep. | 2024 | 0.97% |
| Portugal | 2024 | 0.76% |
| Saudi Arabia | 2024 | 0.73% |
| United Arab Emirates | 2024 | 0.73% |
| Greece | 2024 | 0.73% |
| Bahrain | 2024 | 0.63% |
| Serbia | 2024 | 0.58% |
Within this 2024 subset, Switzerland reports 3.31%, the United States 2.30%, Australia 1.82%, and Korea 0.97%. Portugal is 0.76%, while Saudi Arabia and the United Arab Emirates are both around 0.73%. The advantage of this table is a common reference year; its disadvantage is the small and non-random set of countries with an available 2024 observation.
The 43 observations from 2023 form a larger same-year comparison group
The largest recent common-year group is 2023 with 43 observations. Its median is 0.72% and its unweighted mean is 0.82%. A common year makes the comparison more defensible than ranking all latest values together, but countries without a 2023 observation are excluded, so it still is not a global census.
| Country/area | Reference year | Doctoral or equivalent attainment |
|---|---|---|
| Luxembourg | 2023 | 2.84% |
| Turkiye | 2023 | 2.74% |
| Slovenia | 2023 | 2.41% |
| Germany | 2023 | 1.86% |
| Finland | 2023 | 1.58% |
| Israel | 2023 | 1.58% |
| Ireland | 2023 | 1.54% |
| Norway | 2023 | 1.53% |
| Brunei Darussalam | 2023 | 1.30% |
| Iceland | 2023 | 1.28% |
The 2023 group includes Luxembourg at 2.84%, Turkiye at 2.74%, Slovenia at 2.41%, Germany at 1.86%, Finland at 1.58%, and Israel at 1.58% near the high end. Bangladesh and Indonesia are near 0.05%. The size of these differences is informative for descriptive mapping, but the dataset cannot identify the policy, institutional, demographic, or economic mechanisms behind them.
Selected economies show why the percentage and year belong in the same table
| Country | Latest reference year | Doctoral or equivalent attainment |
|---|---|---|
| United States | 2024 | 2.30% |
| Korea, Rep. | 2024 | 0.97% |
| Australia | 2024 | 1.82% |
| Germany | 2023 | 1.86% |
| France | 2023 | 1.07% |
| United Kingdom | 2021 | 1.28% |
| Canada | 2021 | 1.07% |
| China | 2020 | 0.12% |
| India | 2023 | 0.08% |
| Brazil | 2018 | 0.26% |
| Mexico | 2020 | 0.31% |
| South Africa | 2024 | 0.20% |
| Indonesia | 2023 | 0.05% |
| Nigeria | 2023 | 0.60% |
The United States, Korea and Australia have 2024 observations, so those three can be compared on a common year more directly. Germany and France are represented by 2023 values; the United Kingdom and Canada by 2021 values; China by 2020; Brazil by 2018; and Mexico by 2020. Japan has no non-null row in the supplied verified 144-row dataset, so this article does not insert a value from a different source merely to fill the table.
Doctoral attainment should not be read as a scaled-down bachelor-attainment map
Doctoral or equivalent education is a very high attainment level. A country with a large bachelor-educated population does not necessarily have a doctoral share in the same relative position. Graduate-school structure, professional pathways, migration, the size of academic and research labor markets, and the role of doctoral credentials vary considerably. Subtracting this latest-value map from a bachelor-attainment map and calling the difference a graduate-school participation or dropout rate would be methodologically unsafe unless reference year, denominator, coverage and classification were aligned.
The measure is also not a direct proxy for research performance. Evaluating national research capacity would require separate evidence such as R&D expenditure, researcher headcounts, publication and citation patterns, patents, research institutions, or industry R&D. The strength of this series is narrower: it answers how large the adult population with doctoral-or-equivalent educational attainment is among reporting economies.
The spatial pattern identifies differences, not causes
The latest-value map shows relatively high shades in parts of North America and Western and Northern Europe, with Australia also in a higher band. Many countries in South Asia and Sub-Saharan Africa fall into lower percentage bands, while Europe, the Middle East and Central Asia contain substantial within-region variation. The map is useful for locating broad differences, but geographic clustering does not prove a common cause.
Tajikistan illustrates the importance of dates particularly well. Its latest retained row is 5.47% from 2017, the highest value in the full latest-observation file, but this article does not present it as the current world leader because it is not contemporaneous with 2023–2024 observations. Where the latest retained value is old, current-country analysis should use newer census, labor-force survey, UIS, or other official national evidence if available.
Data source and calculation method
The statistical source is World Bank World Development Indicators series SE.TER.CUAT.DO.ZS. World Bank metadata defines it as the percentage of the population age 25 and older that attained or completed doctoral or equivalent education and identifies the UNESCO Institute for Statistics (UIS) as the underlying provider. The official definition and methodology are available in the World Bank DataBank metadata glossary.
All means, medians, band counts, and country values in this article were calculated directly from the verified 144-row CSV bundled with the writing package. The file keeps one latest non-null observation per real country/area and excludes World Bank regional and income-group aggregates. The map joins ISO-3 codes to a low-resolution world boundary layer. Fourteen small countries or areas absent from that polygon layer are plotted as approximate reference points so their statistical rows are not silently lost from the visualization; point coordinates are not used in any statistical calculation.
Frequently Asked Questions
Is this a 2024 global ranking of doctoral attainment?
No. The package uses the latest non-null observation for 144 countries/areas, with reference years spanning 2001–2024. Only 18 rows are from 2024, so each percentage should be read together with its year.
Is doctoral attainment the same as current PhD enrollment?
No. It is the cumulative share of the population age 25+ that has attained or completed doctoral or equivalent education. Current enrollment and annual doctorate awards are different measures.
Does the 0.29% median represent all adults in the world?
No. It is the median across 144 country/area rows with equal weight per row. A global population share would require age-appropriate population weighting or an official aggregate.
Does a higher doctoral-attainment share prove stronger research performance?
No. The indicator measures educational attainment, not R&D spending, researcher numbers, publications, patents, university quality, or innovation output.
Related Articles
- Global Short-Cycle Tertiary Attainment Map
- Global Upper-Secondary Attainment Map
- Global Lower-Secondary-or-Higher Attainment Map
Green Map creates custom-edited map images using open geographic data sources such as geoBoundaries, Natural Earth, OpenStreetMap, and government open data.
These maps are edited visual materials, not raw data files, and are provided for education, documents, presentations, and graphic reference.