The 2020 World Bank data show a striking spread in pastureland natural capital per capita. Across the 150 countries and economies in the verified dataset, values range from about USD 41 per person to USD 31,083. The median is about USD 1,733. Unlike indicators assembled from each country’s latest available observation, every row in this package refers to 2020, so the map supports a true same-year cross-country comparison.
The metric should not be read as a pasture-area map. Its official World Bank name is Renewable natural capital per capita, agricultural land: pastureland (current US$), indicator code NW.NCA.PAST.PC.CD. In the World Bank’s Changing Wealth of Nations (CWON) framework, agricultural land is treated as an asset and separated into cropland and pastureland. The wealth estimate is built from the present value of resource rents associated with agricultural land, while this series expresses the pastureland component on a per-person, current-dollar basis.
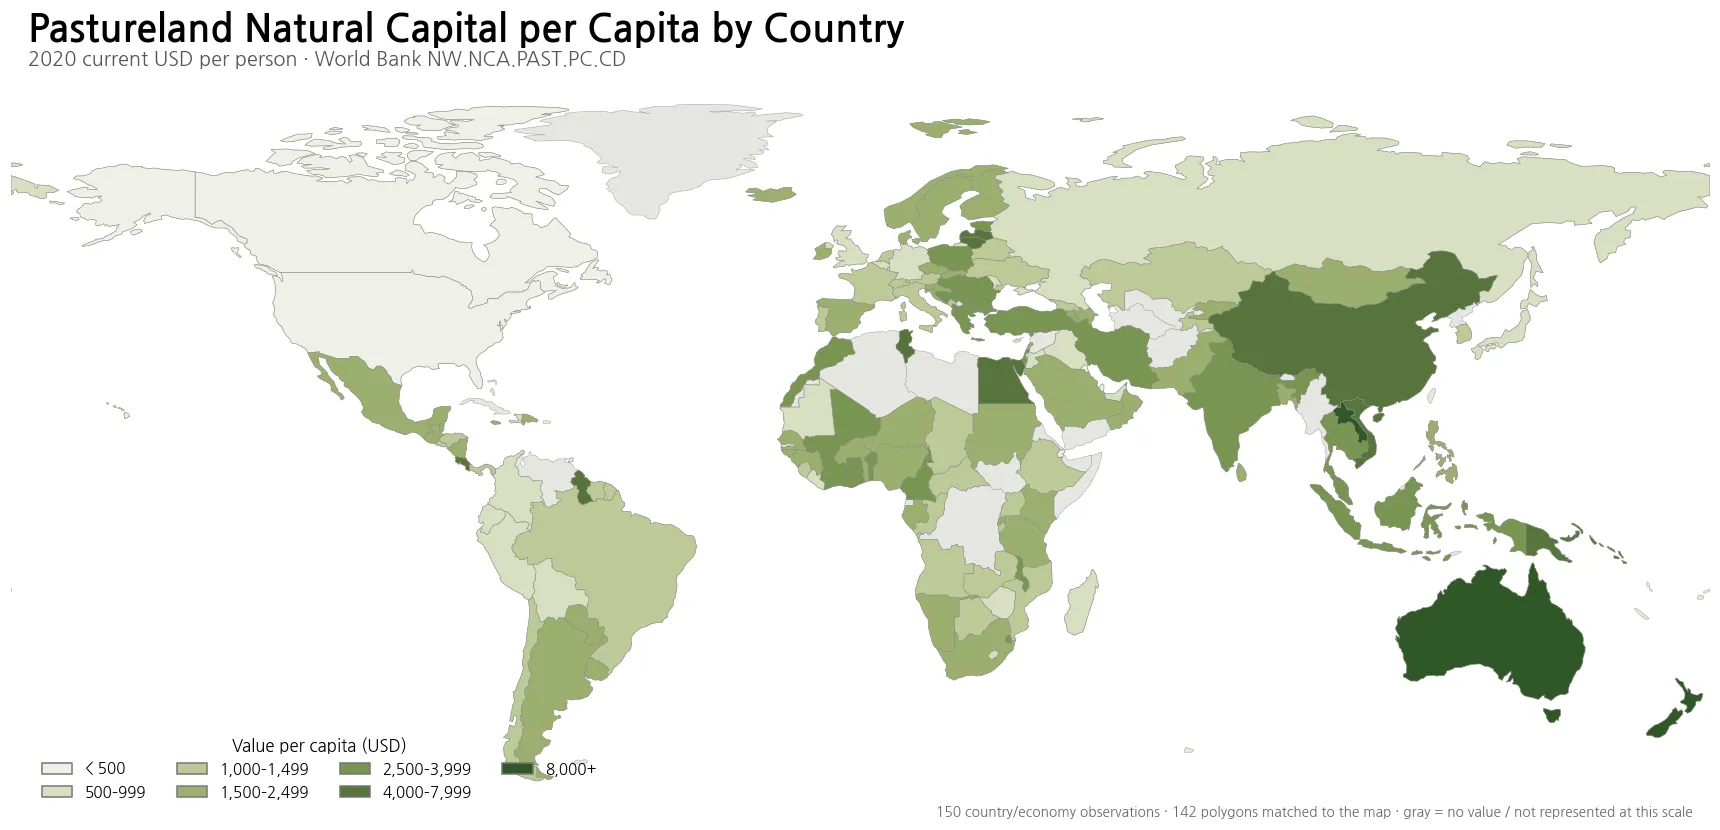
Table of Contents
Pastureland wealth is different from pasture area, livestock output and land prices
CWON is designed to complement production measures such as GDP with a balance-sheet view of the assets that support future production and consumption. Its portfolio includes produced capital, human capital, natural capital and net foreign assets. Renewable natural capital covers assets such as agricultural land, forests, fisheries, mangroves and hydropower. The indicator mapped here isolates pastureland within agricultural land and then divides the estimated value by population.
The 2024 CWON methodology defines agricultural land as cropland plus pastureland. Because direct land-sale information is often unavailable, the World Bank estimates agricultural land wealth from the discounted present value of future crop and pasture rents. For the physical land-volume calculations, cropland is derived from arable land plus permanent cropland, and pastureland is the remaining agricultural land after cropland is removed. That distinction helps explain why this indicator is not a simple count of hectares and why a high number cannot be attributed to pasture area alone.
The denominator matters as well. Two countries with similar pastureland asset values in total can have very different per-capita results if their populations differ. Conversely, a country with a very large grazing area does not automatically rank high if the estimated asset value per resident is modest. Total pastureland wealth, hectares of pasture, pasture share of land, livestock production and value per hectare all answer different questions and should not be substituted for this per-capita measure.
The median is USD 1,733, while the mean rises to USD 2,227
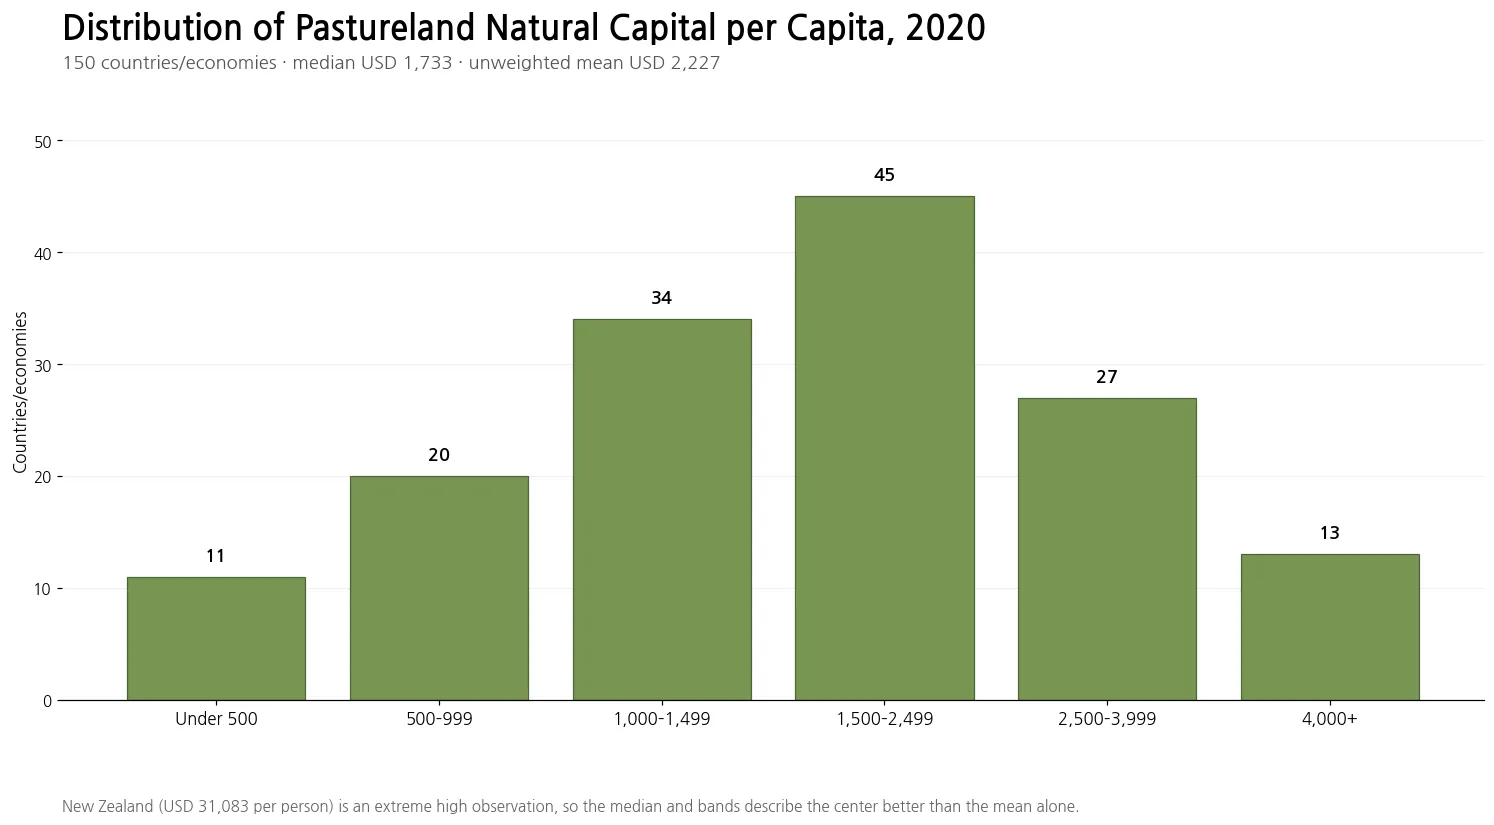
The most populated value band is USD 1,500–2,499, with 45 observations, or 30.0% of the dataset. Another 34 observations fall between USD 1,000 and 1,499, 27 are between USD 2,500 and 3,999, 20 are between USD 500 and 999, 13 are at or above USD 4,000, and 11 are below USD 500. In total, 119 of 150 observations are at least USD 1,000 per person and 85 are at least USD 1,500.
The first quartile is about USD 1,069 and the third quartile about USD 2,616. The simple, unweighted mean of USD 2,227 sits roughly USD 494 above the median. That difference is important because the distribution is not symmetrical. A few very high observations pull the average upward, so the median and the band counts provide a better description of where most countries sit than the mean alone.
New Zealand is an extreme high observation at about USD 31,083 per person
New Zealand records the highest 2020 value at approximately USD 31,083 per person. Australia is second at about USD 10,546 and Lao PDR third at about USD 10,340. Papua New Guinea follows at roughly USD 7,022, while Lithuania and Guyana are just above USD 5,000. The gap between New Zealand and the next-highest country is so large that it should be treated as an outlier when describing the overall distribution.
The maximum is roughly 758 times the minimum observation, but that ratio is not a measure of livestock productivity. The indicator combines a wealth-accounting valuation with a population denominator. Explaining New Zealand’s position would require additional official data on pasture area, livestock output, land rents, population and possibly changes in the valuation inputs. None of those causal contributions can be separated from the supplied indicator alone, so the map is best used to identify where the per-capita asset value is unusually high or low.
Oceania forms the clearest high-value geographic cluster
The strongest visible cluster is in Oceania. New Zealand is at about USD 31,083, Australia at USD 10,546, Papua New Guinea at USD 7,022 and Solomon Islands at USD 4,858. All four mapped observations are well above the global median. The pattern is useful because it shows that the very high New Zealand value is not surrounded entirely by low-valued neighbours; several countries in the same broad region also occupy high bands.
Even inside that cluster, however, scale differs dramatically. New Zealand is almost three times Australia, while Australia is roughly USD 3,500 above Papua New Guinea. A choropleth groups values into bands, so exact differences can be hidden by similar shades. Small Pacific islands also pose a mapping limitation: a valid statistical observation may be too small to appear as a separate polygon at this world-map scale. Regional clustering should therefore be read alongside the numeric table rather than from color alone.
East and Southeast Asia combine high clusters with sharp neighbouring contrasts
Asia contains another group of high observations. Lao PDR is at about USD 10,340, Viet Nam USD 4,506, China USD 4,438, Thailand USD 3,960, Malaysia USD 3,906 and Cambodia USD 3,620. India is around USD 2,789 and Indonesia USD 2,529. Several geographically close countries therefore sit above the overall median, creating a visible high-value belt across parts of mainland and Southeast Asia.
The same region also illustrates why neighbouring countries should not be assumed to share similar results. China’s value is about USD 4,438, compared with roughly USD 1,081 in South Korea and USD 728 in Japan. Farther north and west, Mongolia is near USD 1,905, Kazakhstan USD 1,021 and the Russian Federation USD 763. These contrasts reinforce the difference between a wealth-per-person measure and a visual impression of how much grazing land a country appears to have.
Europe and Africa show large within-region differences
In Europe, Lithuania is about USD 5,233 and Latvia USD 4,160, while Serbia and Albania are both close to USD 3,900. Romania is approximately USD 3,470. The other side of the range includes the United Kingdom at about USD 533 and Germany at USD 902. France sits near USD 1,424, Spain USD 1,858, Ireland USD 1,870 and Iceland USD 1,839. The continent therefore spans nearly every major value band on the map.
Africa is similarly varied. Egypt records about USD 4,255, Tunisia USD 4,087, Côte d’Ivoire USD 3,909 and Benin USD 3,831. Nigeria is around USD 2,455 and Namibia USD 2,137. Kenya and Tanzania are both close to USD 1,800, while South Africa is about USD 1,711 and Botswana USD 1,326. Some high observations appear in North and West Africa, but there is no single continent-wide level that describes all countries.
The Americas include very high values in Guyana and Costa Rica but very low values in the US and Canada
Guyana stands out in South America at about USD 5,173 per person, while Costa Rica reaches roughly USD 4,503 in Central America. Argentina is around USD 1,934, Paraguay USD 1,759, Uruguay USD 1,728 and Brazil USD 1,003. Mexico records about USD 1,518. By contrast, the United States is near USD 301 and Canada about USD 336, both in the sub-USD-500 band.
Those low North American values are not evidence that pastureland is absent or that livestock is unimportant. The metric does not report land area or agricultural output. Likewise, Guyana’s or Costa Rica’s higher per-capita value does not mean their livestock sectors are larger in absolute terms than those of the United States. The countries are being ranked on one specific wealth-per-person concept, and changing the denominator or the economic quantity would produce a different comparison.
Selected countries on a common 2020 basis
| Country/economy | Pastureland natural capital per capita, 2020 |
|---|---|
| New Zealand | USD 31,083 |
| Australia | USD 10,546 |
| Lao PDR | USD 10,340 |
| Papua New Guinea | USD 7,022 |
| Lithuania | USD 5,233 |
| Guyana | USD 5,173 |
| Viet Nam | USD 4,506 |
| China | USD 4,438 |
| Egypt | USD 4,255 |
| Tunisia | USD 4,087 |
| India | USD 2,789 |
| Indonesia | USD 2,529 |
| Nigeria | USD 2,455 |
| Argentina | USD 1,934 |
| Mongolia | USD 1,905 |
| Spain | USD 1,858 |
| South Africa | USD 1,711 |
| Mexico | USD 1,518 |
| France | USD 1,424 |
| South Korea | USD 1,081 |
| Brazil | USD 1,003 |
| Germany | USD 902 |
| Russian Federation | USD 763 |
| Japan | USD 728 |
| United Kingdom | USD 533 |
| Canada | USD 336 |
| United States | USD 301 |
All figures in the table are current 2020 US dollars, so they do not suffer from mixed observation years. They are still nominal values, however. Current US$ is not a constant-price series and it is not adjusted for differences in national purchasing power. For long-run change analysis, the CWON real chained series is more appropriate because it is designed to track changes in asset volumes and relative values over time.
Land-use share maps answer a different but complementary question
Three related land-use measures help clarify what this map does and does not show. Agricultural land share measures how much of national land is used as arable land, permanent crops or permanent meadows and pastures. Arable land share focuses on land used for temporary crops, temporary meadows, market gardens and temporary fallow. Permanent cropland share covers long-lived crops such as orchards, coffee, rubber and vines. Each uses physical land area as the core quantity.
This pastureland natural-capital series instead expresses a monetary asset value per resident. A country can rank high on pasture share but not on pastureland wealth per capita, or the reverse, because valuation and population enter the calculation. It would therefore be incorrect to infer that high wealth per person is caused by a large land share without combining additional aligned datasets. The most useful role of the map is to reveal where the World Bank wealth accounts assign unusually high or low pastureland asset value on a per-capita basis.
Data source and mapping method
The underlying observations come from the World Bank NW.NCA.PAST.PC.CD indicator. The broader wealth-accounting framework is documented in The Changing Wealth of Nations, and the agricultural-land valuation and land-volume procedures are described in the CWON 2024 Methodology.
The analysis retains 150 non-aggregate countries and economies with a verified 2020 value. No missing observation is converted to zero and no older or newer year is substituted. The median, mean, quartiles, band counts and table values are calculated directly from the supplied cleaned CSV. The map joins ISO3 country codes to low-resolution Natural Earth boundaries; after normalising the France and Norway boundary codes, 142 polygons carry values.
Statistical coverage and map coverage are not identical. Some small islands and separately reported economies have valid observations but are too small or absent as separate polygons in this boundary layer. Gray therefore should not be interpreted as USD 0. For exact country values, use the table or the underlying World Bank record rather than estimating a number from map color.
Frequently Asked Questions
Does a high pastureland natural capital value mean a country has more pasture area?
Not necessarily. The indicator is the monetary value attributed to pastureland natural capital divided by population. Pasture area or pasture share of land must be checked with separate land-use statistics.
Are all countries in this map measured in the same year?
Yes. All 150 country/economy observations in the supplied dataset refer to 2020, so the comparison does not mix observation years.
Does current US$ mean values are expressed in today’s dollars?
No. Current US$ means nominal US dollars for the observation year. These are 2020 current-dollar values, not constant-price or purchasing-power-parity figures.
Can this map be used as a ranking of livestock-sector strength?
No. The series measures pastureland natural capital in the World Bank wealth-accounting framework. It does not directly measure livestock output, productivity, employment, exports or farm income.
Related Articles
These Green Map articles provide physical land-use context for the pastureland wealth indicator. They cover agricultural land as a whole, arable land and permanent cropland, so they are useful for separating asset value from the share of national land devoted to different agricultural uses.
- Global Agricultural Land Share Map – 2023 Country Comparison
- Global Arable Land Share Map – 2023 Country Comparison
- Global Permanent Cropland Share Map – 2023 Country Comparison
Green Map creates custom-edited map images using open geographic data sources such as geoBoundaries, Natural Earth, OpenStreetMap, and government open data.
These maps are edited visual materials, not raw data files, and are provided for education, documents, presentations, and graphic reference.