Natural resource rents make up very different shares of national output across the world. Using a strict 2021 same-year comparison, 197 countries and separately reported economies have numeric observations. Libya records the highest value at 61.0% of GDP, followed by Iraq at 43.4%. The median across all 197 observations is only 1.7%, showing how strongly a smaller group of high values stretches the distribution.
The World Bank series is NY.GDP.TOTL.RT.ZS, formally titled Total natural resources rents (% of GDP). “Rents” here do not mean gross sales revenue. The World Bank estimates the difference between the price of a resource and its average extraction, production, or harvesting cost, then multiplies the unit rent by the physical quantity extracted or harvested. The total series sums oil, natural gas, coal, mineral and forest rents and expresses the result as a share of GDP.
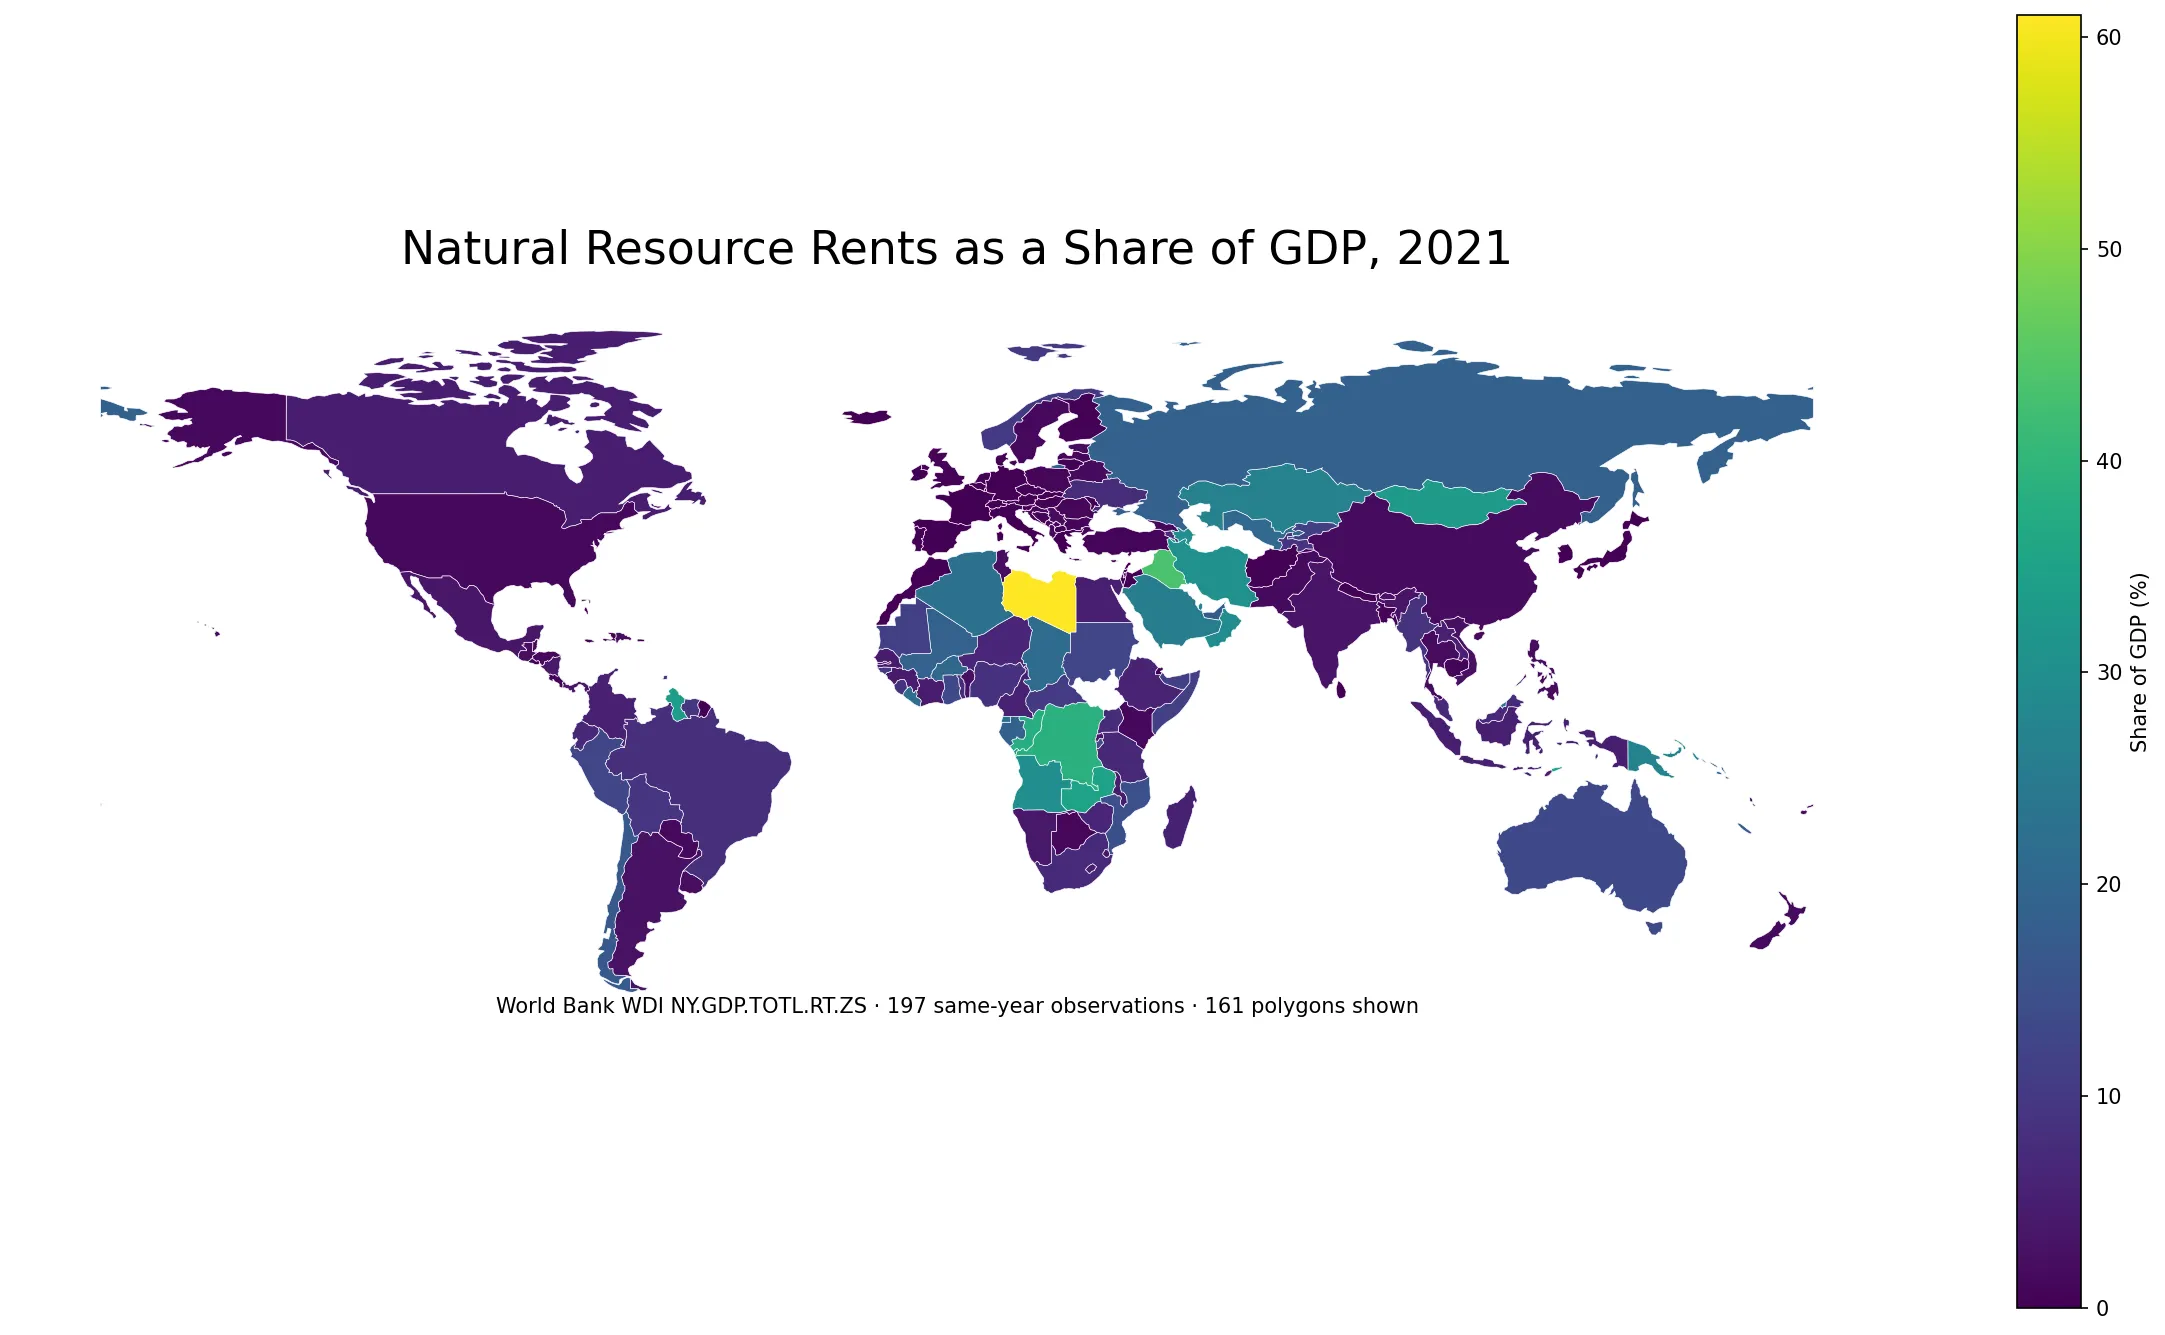
Table of Contents
A same-year comparison leaves 197 usable 2021 observations
The source package stores the latest non-empty value for each economy, but not every latest value is from 2021. 17 rows carry older observations ranging from 2007 to 2020. Those older values are excluded from every ranking, table and chart on this page so that a 2021 observation is never compared directly with a value from a different year.
That restriction is particularly important for a resource-rent indicator because commodity prices and production costs can change sharply over time. A mixed-year map could therefore create apparent cross-country differences that partly reflect different market periods rather than only different economic structures.
Libya is highest at 61.0%, followed by Iraq and the two Congos
The highest 2021 observations span several regions. Libya, Iraq and Iran stand out in North Africa and the Middle East. The Democratic Republic of the Congo, Republic of the Congo, Zambia and Angola are prominent in Africa, while Guyana, Mongolia and Timor-Leste also sit above 30%. Because the indicator combines several resource categories, these values should not be treated as an oil-only ranking.
| Country or economy | Natural resource rents, 2021 (% of GDP) |
|---|---|
| Libya | 61.0% |
| Iraq | 43.4% |
| Congo, Dem. Rep. | 38.8% |
| Congo, Rep. | 37.7% |
| Zambia | 35.3% |
| Timor-Leste | 34.7% |
| Guyana | 33.7% |
| Mongolia | 33.1% |
| Iran, Islamic Rep. | 30.4% |
| Angola | 30.0% |
A high percentage is not a one-number verdict on economic performance. The ratio depends on resource prices, extraction or harvesting costs, physical output and the size of GDP. Two countries with similar production volumes can therefore have different rent shares, while a large diversified economy can record a small percentage even when its resource sector is substantial in absolute terms.
84 of 197 observations are below 1%, while 44 are at 10% or more
The distribution is strongly right-skewed. 84 observations are below 1% of GDP and 128 are below 5%. At the other end, 44 are at 10% or more, 23 reach 20% or more, and only 9 are at 30% or above. The simple mean is 6.63%, compared with a median of 1.71%.
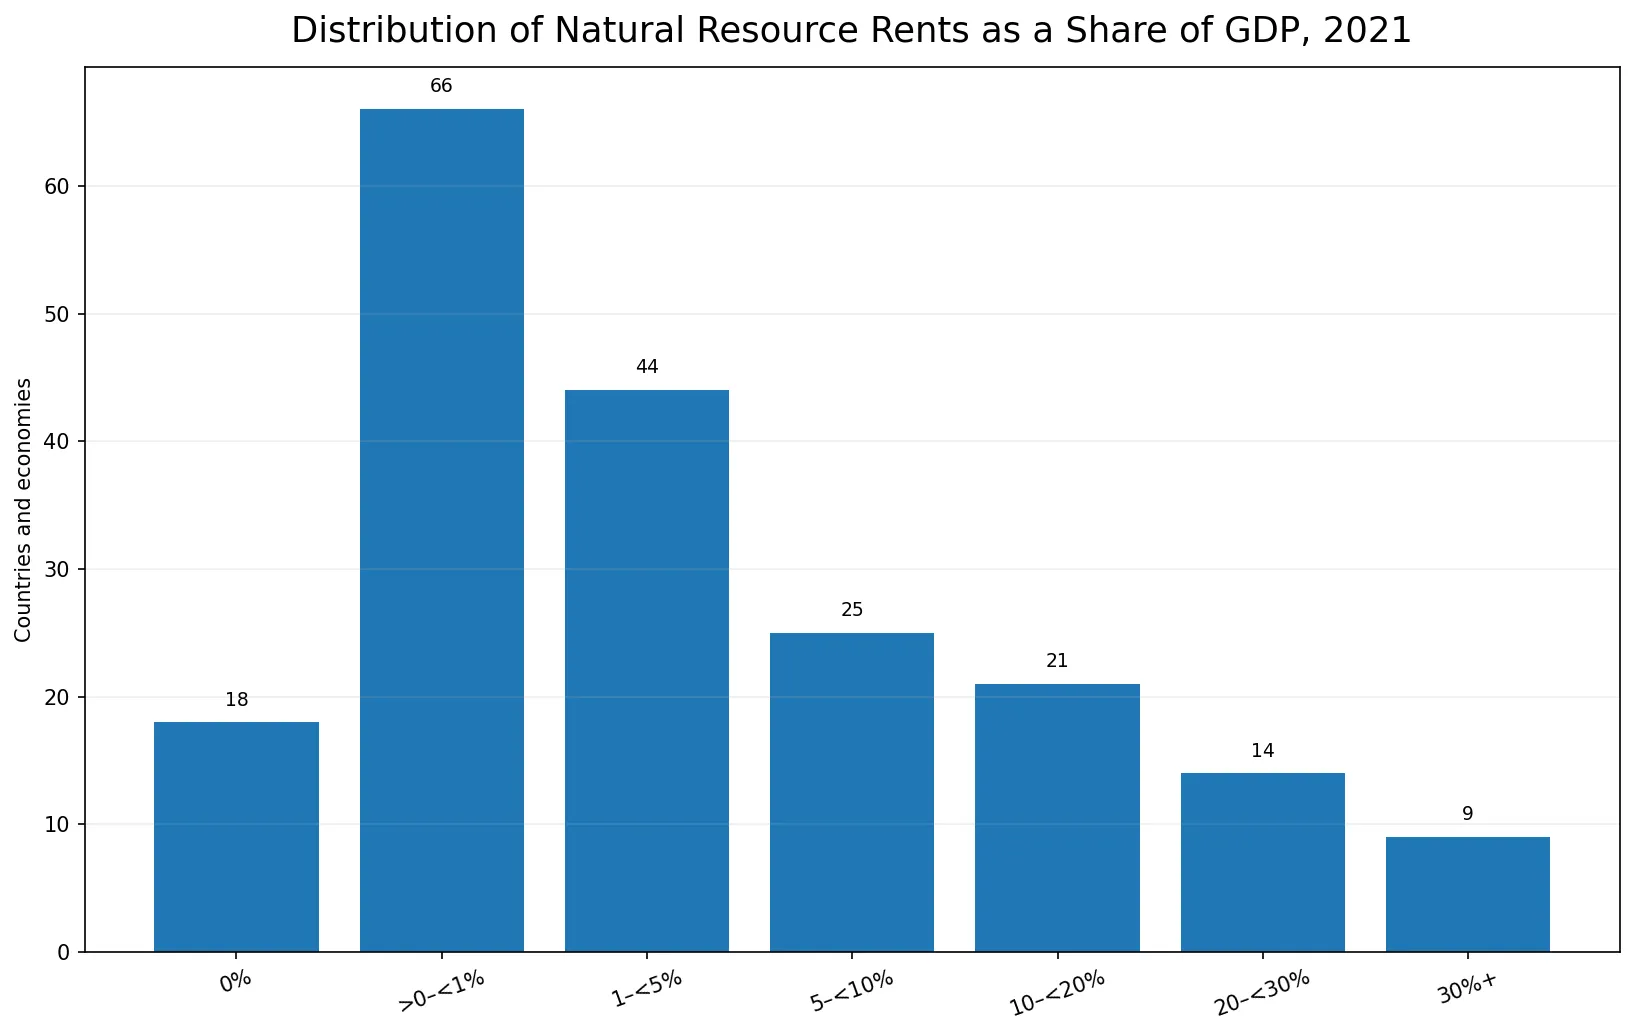
| Share of GDP | Countries/economies | Share of 197 |
|---|---|---|
| 0% | 18 | 9.1% |
| >0–<1% | 66 | 33.5% |
| 1–<5% | 44 | 22.3% |
| 5–<10% | 25 | 12.7% |
| 10–<20% | 21 | 10.7% |
| 20–<30% | 14 | 7.1% |
| 30%+ | 9 | 4.6% |
Selected economies occupy very different parts of the same scale
Saudi Arabia is at 25.6%, the Russian Federation at 18.5%, the United Arab Emirates at 17.6%, Australia at 13.4%, and Norway at 10.0%. Brazil is 7.9%, Indonesia 5.2%, Canada 4.9%, India 3.2%, China 1.7%, and the United States 1.3%. Germany, South Korea, Japan and France are all below 0.1% in this 2021 series.
| Country | Natural resource rents, 2021 (% of GDP) |
|---|---|
| Saudi Arabia | 25.6% |
| Russian Federation | 18.5% |
| United Arab Emirates | 17.6% |
| Australia | 13.4% |
| Norway | 10.0% |
| Nigeria | 8.6% |
| Brazil | 7.9% |
| South Africa | 7.3% |
| Indonesia | 5.2% |
| Canada | 4.9% |
| Mexico | 3.6% |
| India | 3.2% |
| China | 1.7% |
| United States | 1.3% |
| Germany | 0.1% |
| Korea, Rep. | 0.0% |
| Japan | 0.0% |
| France | 0.0% |
These percentages are not rankings of physical resource production. A country can produce large quantities of resources but show a modest share if GDP is much larger, while a smaller economy can show a high ratio when resource rents are large relative to its total output.
The total combines oil, gas, coal, minerals and forest rents
The World Bank metadata glossary defines total natural resource rents as the sum of oil rents, natural gas rents, hard- and soft-coal rents, mineral rents and forest rents. For each resource, the methodology estimates unit rent as price minus average unit production cost and applies that rent to the quantity extracted or harvested.
The indicator therefore does not represent the full monetary value of every ecosystem service or natural asset. It also does not include all tourism, fishery, land-price or biodiversity values. It is a narrower macroeconomic measure tied to specific extractive and harvest-based resource categories.
A high share is neither automatically good nor automatically bad
A high value means that the estimated natural-resource rents in that year are large relative to GDP. It does not by itself tell us whether those proceeds are invested productively, whether public finances are resilient, whether the economy is diversified, or how large the environmental costs are. Those questions require additional fiscal, trade, production, governance and environmental data.
Likewise, a low value does not prove that a country lacks natural resources. It can reflect low production in that year, high extraction costs, lower prices, or simply an economy in which manufacturing and services make up a much larger share of GDP. The map is best read as a comparison of the economic weight of measured resource rents in 2021, not as a resource-reserve map.
Data source and calculation method
The values come from World Bank WDI series NY.GDP.TOTL.RT.ZS. All statistics on this page use only the 197 observations dated 2021; older latest-available observations are not backfilled into the map. The unweighted mean is 6.63%, the median 1.71%, the first quartile 0.12%, and the third quartile 8.55%.
ISO-3 codes are joined to a low-resolution Natural Earth boundary layer for visualization. The statistical sample contains 197 observations, while 161 are directly represented as polygons. Small islands and separately reported territories may have valid statistics without a distinct visible polygon at world-map scale.
Frequently Asked Questions
What does total natural resource rents as a share of GDP measure?
World Bank NY.GDP.TOTL.RT.ZS sums estimated oil, natural gas, coal, mineral and forest rents and expresses the total as a percentage of GDP. It is not gross resource-sector revenue or a measure of reserves.
Which country has the highest 2021 value?
Among the same-year 2021 observations, Libya is highest at about 61.0% of GDP, followed by Iraq at about 43.4% and the Democratic Republic of the Congo at about 38.8%.
Why are some latest available values excluded?
The source package contains 17 latest non-empty observations dated before 2021. They are excluded so every ranking, chart and map compares the same reference year.
Does a high percentage mean a country has more natural resources?
Not necessarily. The ratio also depends on commodity prices, average production costs, extraction or harvest volumes, and the size of GDP. It is not a direct measure of physical reserves.
Related Articles
These Green Map articles provide directly relevant context on economically valued forest depletion, forest extent, and broader land use.
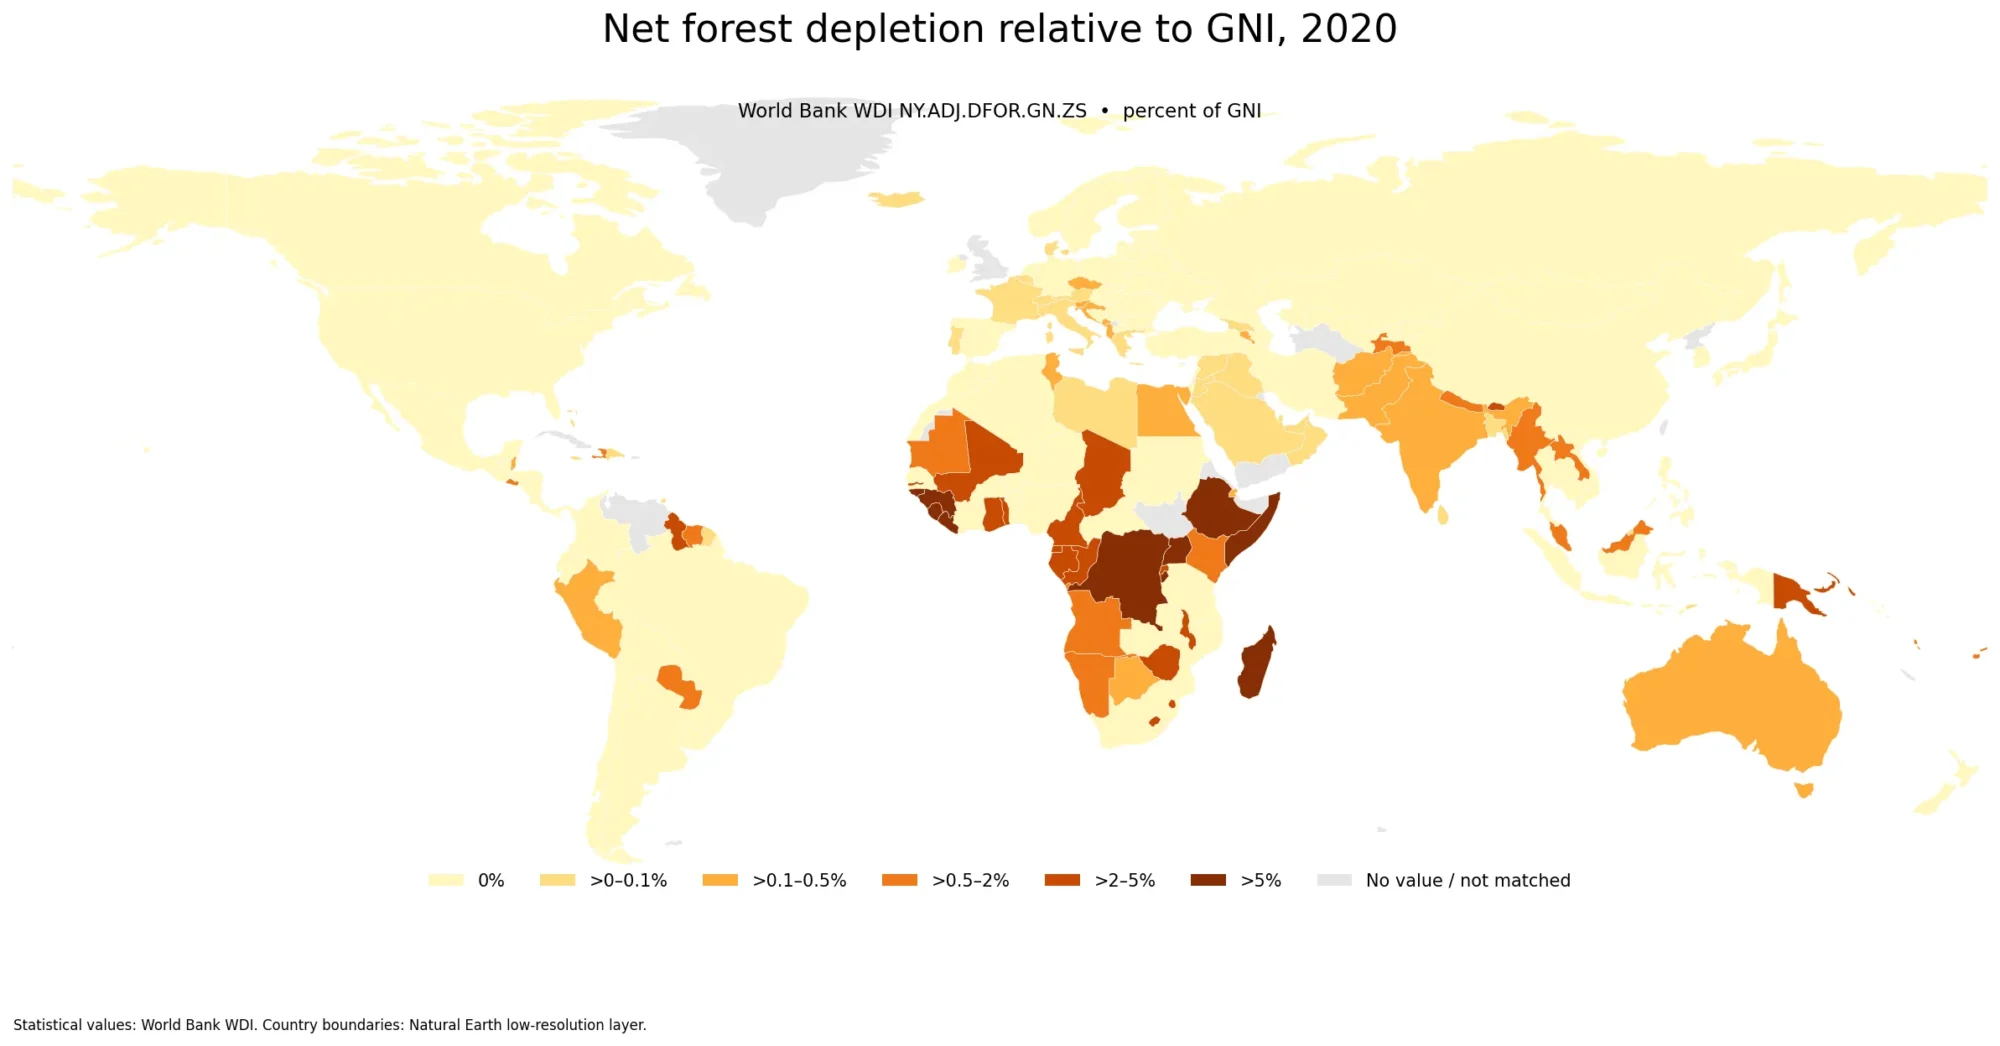
- Global Net Forest Depletion Map – 2021 Country Comparison
- Global Forest Area Share Map – 2023 Country Comparison
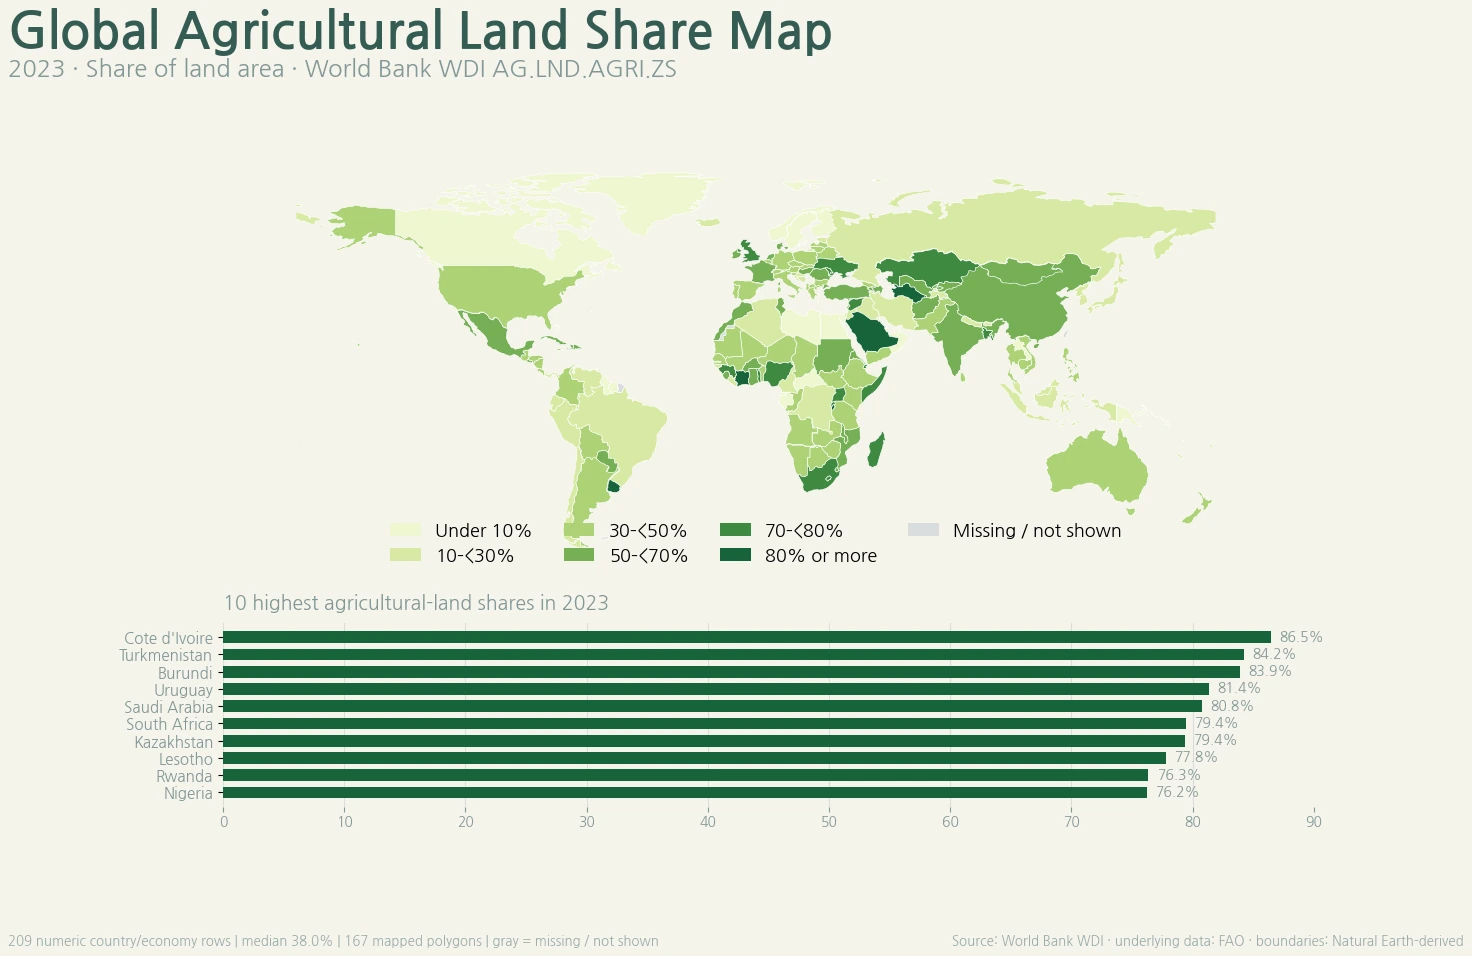
- Global Agricultural Land Share Map – 2023 Country Comparison
Green Map creates custom-edited map images using open geographic data sources such as geoBoundaries, Natural Earth, OpenStreetMap, and government open data.
These maps are edited visual materials, not raw data files, and are provided for education, documents, presentations, and graphic reference.