Countries can face very different external repayment pressure relative to the foreign earnings generated by exports of goods and services plus primary income. Using World Bank indicator DT.TDS.DECT.EX.ZS, this comparison contains the latest available observation for 121 countries and separately reported economies. The median is 12.9%, the simple unweighted mean is 16.6%, and El Salvador has the highest retained value at 96.2%.
“Latest available” does not mean every economy is measured in 2024. 109 of the 121 rows are from 2024, while the remaining 12 use the most recent non-empty observation available between 1997 and 2023. The map is therefore useful for seeing the broad geography of debt-service pressure, but the full 121-row ranking should not be treated as a perfectly aligned same-year snapshot.
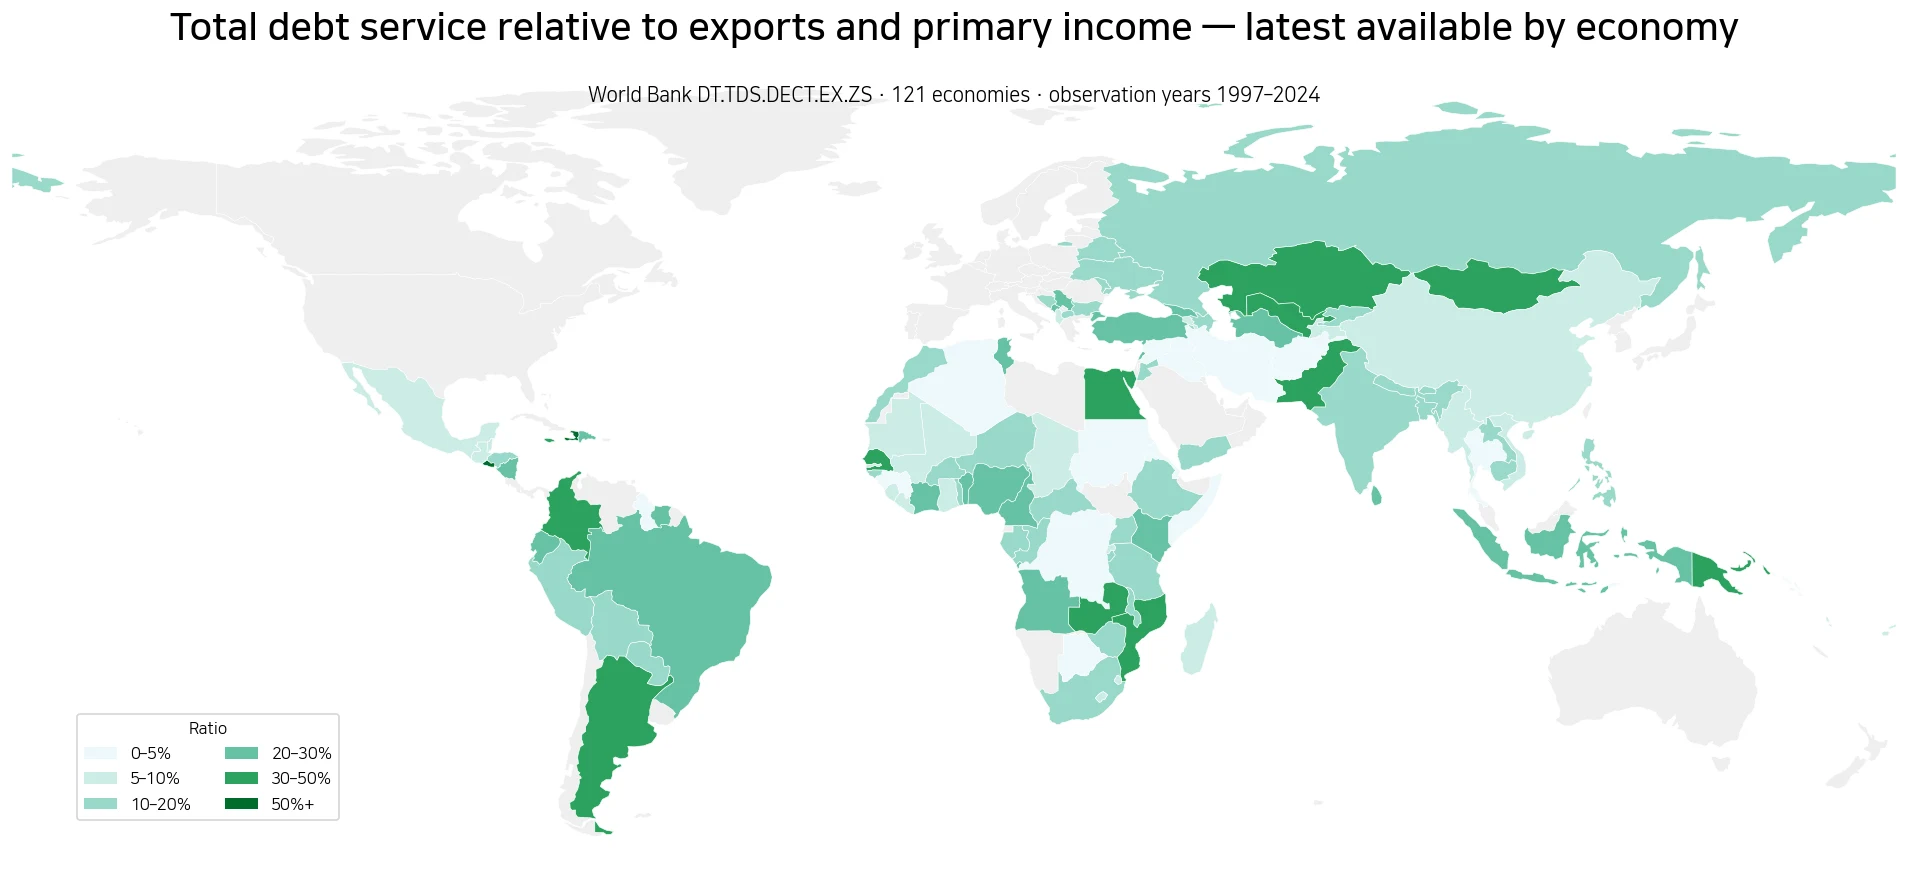
Table of Contents
What the debt-service ratio measures
The official World Bank series is Total debt service (% of exports of goods, services and primary income). Total debt service includes principal repayments and interest actually paid on long-term debt, interest paid on short-term debt, and relevant IMF repayments and charges. The denominator combines exports of goods and services with primary income. A higher ratio therefore means that debt-service payments are large relative to these external income flows.
A value of 20% means debt-service payments were equivalent to roughly one-fifth of the denominator used by the indicator. It does not mean exactly 20% of export receipts were physically set aside in an account and used to repay debt. This is a macroeconomic flow ratio, not a government budget share, corporate interest-expense ratio, or measure of the country’s total debt stock.
The median across 121 latest observations is 12.9%
Giving every economy one equal observation, the median is 12.9% and the simple mean is 16.6%. 36 observations are at or above 20%, 14 are at or above 30%, and 8 exceed 40%. Only two are above 50%: El Salvador and Haiti. The mean sits above the median because several high values stretch the upper tail of the distribution.
The ratio does not rank economies by the absolute amount of external debt or debt-service payments. A large economy may make very large repayments but still record a moderate ratio if exports and primary income are also large. A smaller economy can post a high ratio when its external earning base is narrow relative to repayments. The map therefore answers a burden question rather than a “who owes the most?” question.
El Salvador, Haiti and Egypt are the highest latest observations
El Salvador is highest at 96.2%, followed by Haiti at 63.2%, Egypt at 49.2%, Kazakhstan at 48.4%, and Mozambique at 46.5%. Papua New Guinea and Colombia are both around 43%, while Senegal is at 41.8%. Importantly, all of the top 12 retained observations are from 2024, so the ordering within this high-value group is a same-year comparison.
| Economy | Ratio | Observation year |
|---|---|---|
| El Salvador | 96.2% | 2024 |
| Haiti | 63.2% | 2024 |
| Egypt, Arab Rep. | 49.2% | 2024 |
| Kazakhstan | 48.4% | 2024 |
| Mozambique | 46.5% | 2024 |
| Papua New Guinea | 43.3% | 2024 |
| Colombia | 43.0% | 2024 |
| Senegal | 41.8% | 2024 |
| Pakistan | 39.5% | 2024 |
| Argentina | 38.3% | 2024 |
| Uzbekistan | 36.0% | 2024 |
| Mongolia | 32.0% | 2024 |
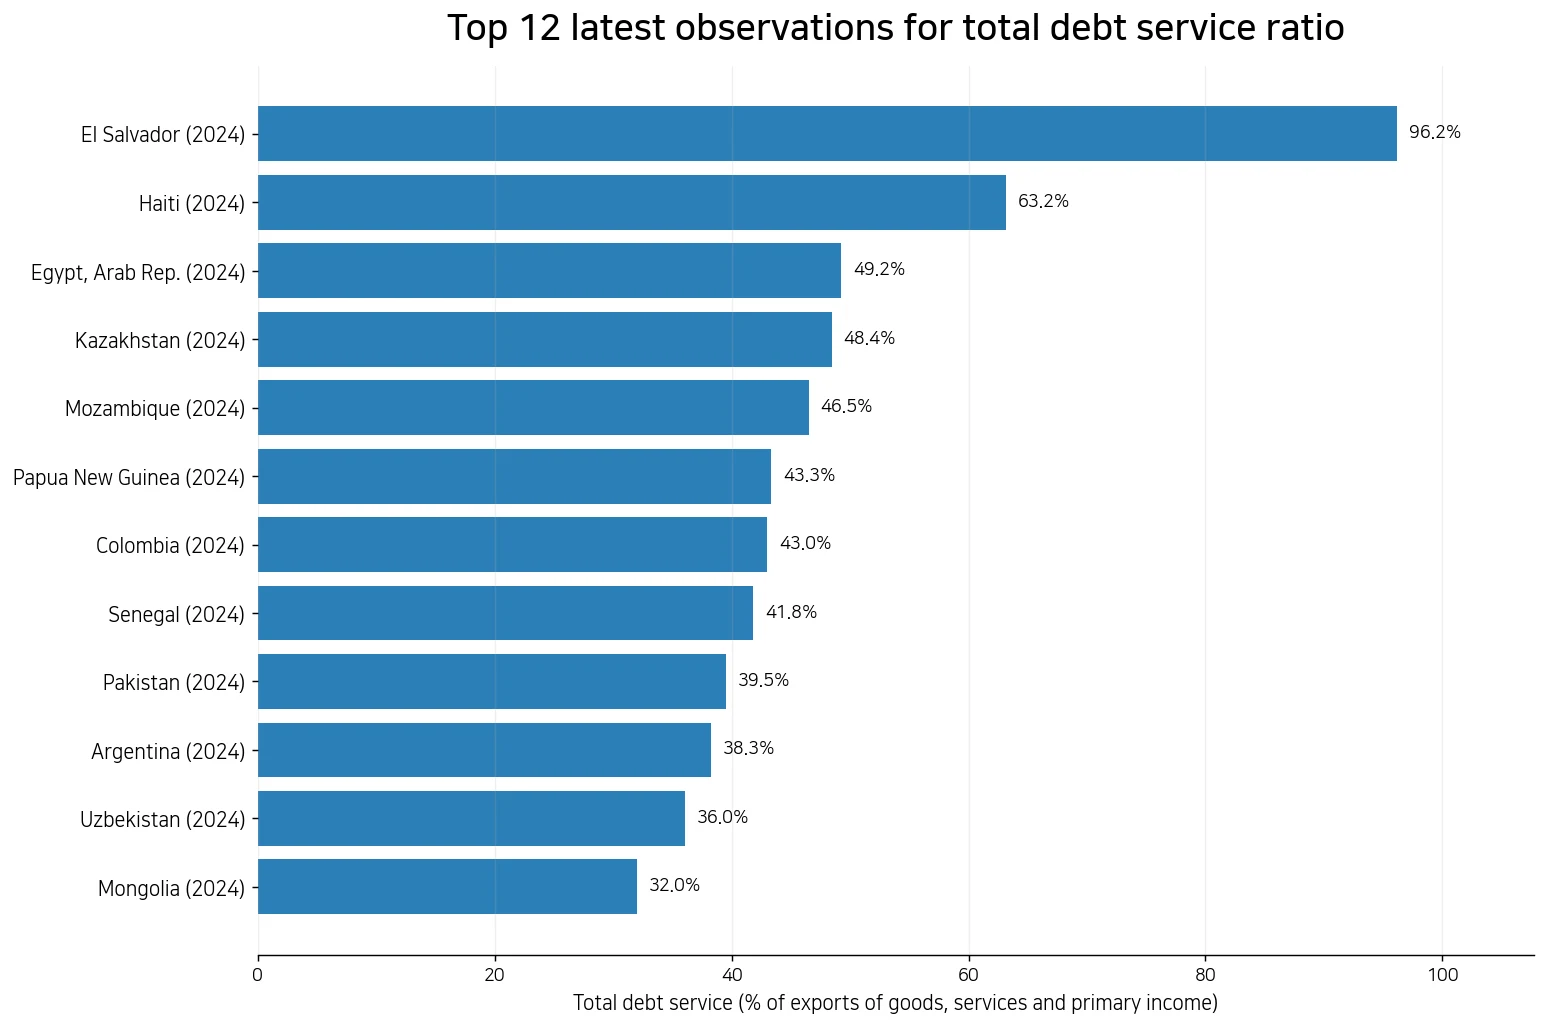
El Salvador’s 96.2% is striking, but it is not by itself a declaration of imminent default. The indicator does not show reserve adequacy, maturity structure, interest rates, exchange-rate exposure, the public-private split of debt, access to refinancing, or export volatility. A high value is a useful signal for deeper debt-sustainability analysis, not a complete sovereign-risk score.
The 2024-only comparison still shows a very wide spread
Restricting the data to the 109 economies with a 2024 observation gives a median of 12.9% and a simple mean of 17.1%. Thirty-three are at or above 20%, and 14 are at or above 30%. At the low end, Iran is about 0.3%, Somalia 0.7%, Algeria 0.8%, and the Democratic Republic of the Congo 1.3%. A low value should not be read as proof that external debt is harmless; it only says that debt service was small relative to this particular external-income denominator.
The map shows relatively high values in parts of Latin America, Africa, Central Asia, and South Asia, but the pattern is far from uniform. Colombia is near 43%, yet neighboring economies do not all occupy the same band. Kazakhstan stands near 48%, while nearby Central Asian economies differ substantially. Geographic clustering can suggest where to investigate further, but the ratio alone cannot establish a shared regional cause.
Selected major economies occupy very different positions
| Economy | Ratio | Observation year |
|---|---|---|
| Egypt, Arab Rep. | 49.2% | 2024 |
| Colombia | 43.0% | 2024 |
| Pakistan | 39.5% | 2024 |
| Argentina | 38.3% | 2024 |
| Brazil | 26.7% | 2024 |
| Indonesia | 24.7% | 2024 |
| Turkiye | 23.4% | 2024 |
| Nigeria | 21.9% | 2024 |
| South Africa | 16.3% | 2024 |
| India | 10.5% | 2024 |
| Mexico | 9.5% | 2024 |
| China | 8.6% | 2024 |
Colombia, Argentina, and Brazil are all in Latin America but record about 43.0%, 38.3%, and 26.7% respectively. Pakistan is at 39.5%, Türkiye 23.4%, Nigeria 21.9%, South Africa 16.3%, India 10.5%, and China 8.6%. These differences show why continent, income group, or economic size cannot substitute for the actual debt-service ratio.
Twelve economies require extra caution because their observation year is older
Of the 121 rows, 109 are from 2024. Five are from 2023, Gabon is from 2021, Afghanistan from 2020, and Sudan from 2022. The oldest retained observations are Yemen in 2016, Syria in 2010, Eritrea in 2000, and Turkmenistan in 1997. Those figures remain the latest non-empty values in this comparison, but they are not contemporaneous with the 2024 observations.
For a broad latest-available map, keeping those rows makes coverage more complete. For strict cross-country comparison, however, the 109 2024 observations are the cleaner subset. Any assessment of the current position of an economy represented by an old year should use more recent debt, export, balance-of-payments, and reserve information rather than carrying the historical ratio forward as if nothing had changed.
Why a high ratio is not a complete judgment on the economy
The debt-service ratio is important, but it can move for several reasons. Exports may fall and shrink the denominator. Large maturities can concentrate repayments in one year. Exchange-rate changes can alter the local burden of foreign-currency debt. Conversely, an economy can accumulate new debt while current debt service remains modest if principal repayments fall later. A single annual ratio therefore works best alongside debt stocks, maturities, reserves, the current account, and a longer time series.
This series is also different from government debt as a percentage of GDP. The denominator here is exports of goods and services plus primary income, and the numerator is debt-service payments rather than the debt stock. An economy can rank very differently on the two measures because they answer different questions about fiscal position and external repayment capacity.
Data source and calculation method
Values come from the World Bank World Development Indicators series DT.TDS.DECT.EX.ZS. The comparison keeps the most recent non-empty country/economy observation and excludes World Bank regional and income-group aggregates. The statistical sample contains 121 rows with observation years from 1997 through 2024. The mean, median, thresholds, and rankings above are calculated directly from those observations.
The map joins ISO-3 economy codes to a low-resolution Natural Earth country boundary layer. Some small islands and separately reported statistical units may have a value but no distinct visible polygon at this world scale. Gray should therefore not be interpreted as a measured zero; exact values and years should be checked in the statistical data.
Frequently Asked Questions
Does a 50% ratio mean half of export receipts were literally used to repay debt?
Not exactly. The indicator compares total debt-service payments with exports of goods and services plus primary income. It is a macroeconomic ratio, not a direct tracing of how each export dollar was spent.
Are all economies compared using 2024 data?
No. 109 of the 121 observations are from 2024. The remaining 12 use the latest available non-empty value from 1997–2023, so a strict same-year comparison should use the 2024 subset.
Does a high debt-service ratio prove that default risk is high?
No. The ratio is one pressure indicator. Reserve adequacy, debt maturities, interest rates, exchange-rate exposure, the current account, refinancing access, and debt stocks also matter.
Related Articles
- Global GDP Growth Map – Country Patterns in 2025
- Global GDP per Capita Map – Country Levels in 2025
- World Bank Global Economic Monitor Guide
Green Map creates custom-edited map images using open geographic data sources such as geoBoundaries, Natural Earth, OpenStreetMap, and government open data.
These maps are edited visual materials, not raw data files, and are provided for education, documents, presentations, and graphic reference.