The share of firms naming access to land as their single biggest business obstacle varies widely across countries. Using the latest available observation for each country in the supplied World Bank Enterprise Surveys series, the 146 reported country/economy observations have a median of 1.65% and an unweighted mean of 3.24%. The most important limitation is timing: these observations span 2006 to 2020. The map and rankings therefore compare each country’s latest available survey result in this dataset, not a single-year snapshot of the current global business environment.
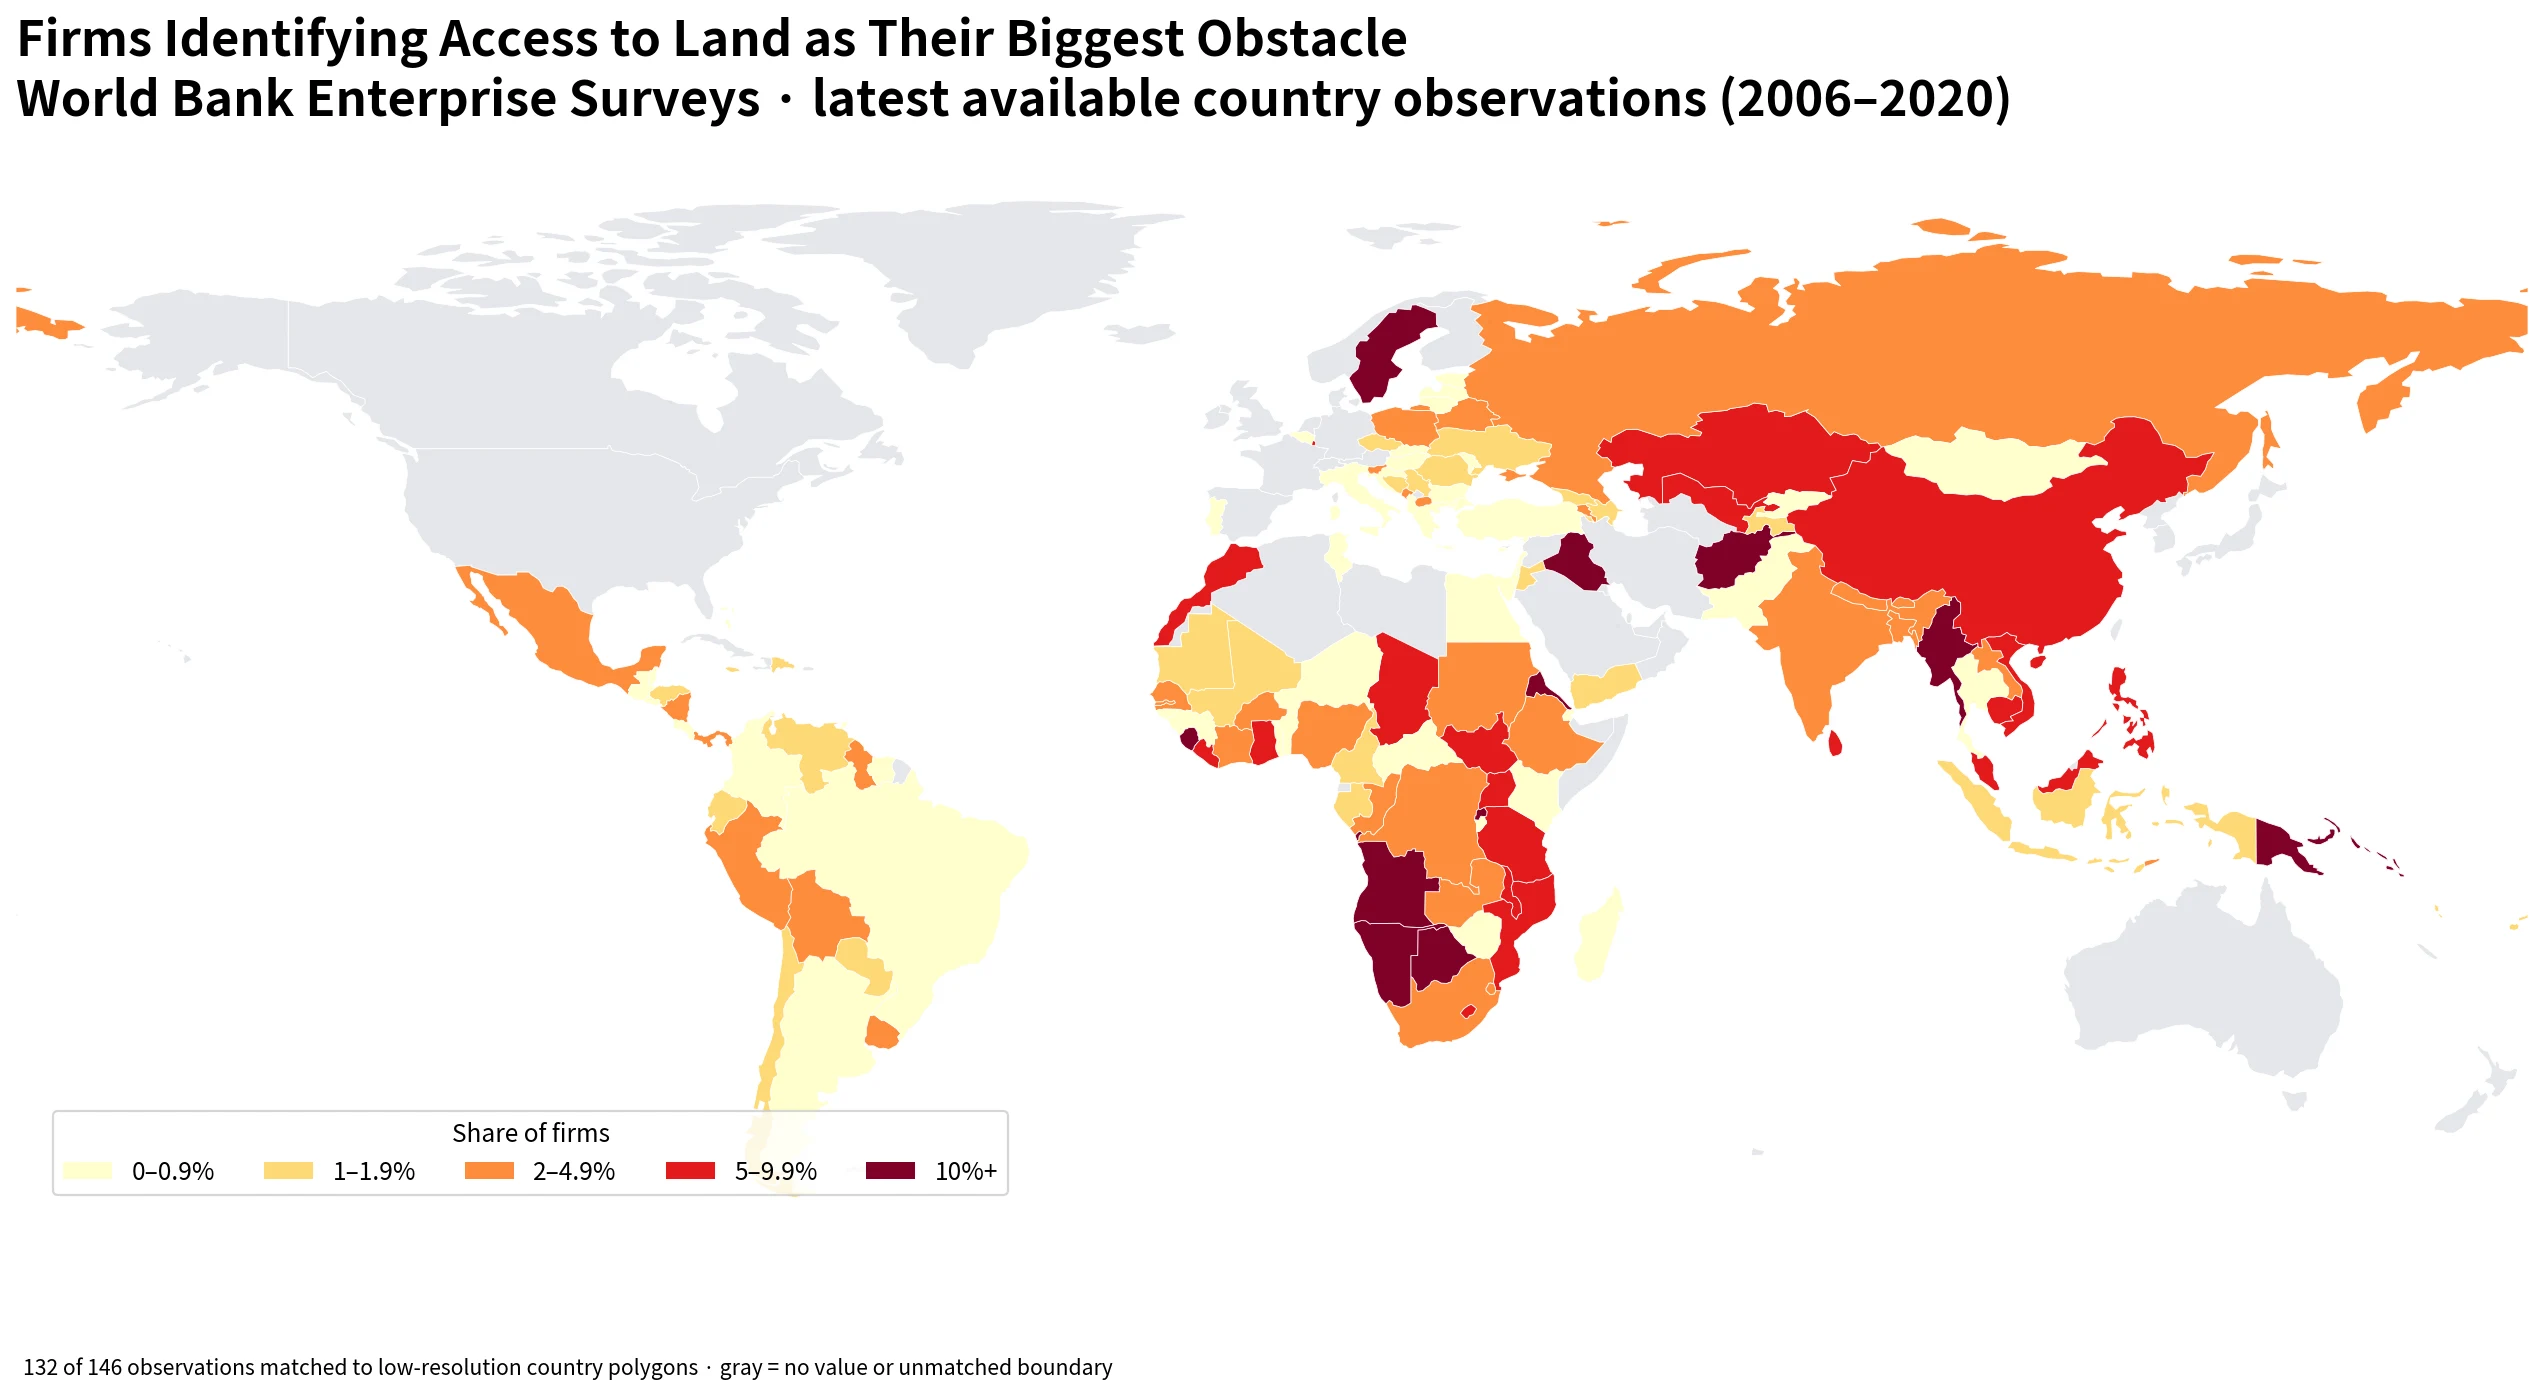
Table of Contents
What this indicator actually measures
The World Bank indicator used here is IC.FRM.OBS.OBST2. It measures the percentage of establishments that select access to land as the biggest obstacle from a list of business-environment constraints. This is different from an indicator asking whether land is a “major” or “very severe” constraint. Here, the firm is choosing the single obstacle it regards as the largest problem. World Bank documentation for Enterprise Surveys describes these country indicators as weighted survey estimates.
A value of 10% does not mean that 10% of national land is unavailable, that land prices rose by 10%, or that 10% of firms failed to obtain a site. It means that roughly 10% of surveyed establishments, after weighting, selected access to land as their biggest obstacle among the listed options. The indicator by itself cannot separate possible causes such as land prices, title registration, permitting, industrial-site supply, urban planning, or local market conditions.
The typical observation is low, but the upper tail reaches 10–20%
Across all 146 observations, the median is 1.65% and the simple mean is 3.24%. The first quartile is 0.7% and the third quartile is 4.6%. Thirty-two observations are above 5%, 12 are at or above 10%, and 12 are recorded as 0.0%. The mean sits well above the median because a relatively small group of high observations stretches the upper tail of the distribution.
That pattern does not support a claim that land access is the dominant business problem in most countries. Half of the observations are at or below 1.65%. Since respondents choose among multiple business-environment obstacles—such as finance, electricity, tax rates, informality, political instability and others—a low land-access share can also mean that other constraints were more frequently chosen as the single biggest problem.
Namibia has the highest observation at 20.5%
Namibia has the highest retained observation at 20.5% in 2014. It is followed by Eritrea at 17.0% (2009), Angola at 16.3% (2010), Myanmar at 14.3% (2016), and Afghanistan at 13.5% (2014). Botswana, Papua New Guinea, the Solomon Islands, Rwanda and Sierra Leone are also above 11%. Sweden and Iraq each record 10.5% in their respective survey years.
| Country | Share of firms | Survey year |
|---|---|---|
| Namibia | 20.5% | 2014 |
| Eritrea | 17.0% | 2009 |
| Angola | 16.3% | 2010 |
| Myanmar | 14.3% | 2016 |
| Afghanistan | 13.5% | 2014 |
| Botswana | 12.8% | 2010 |
| Papua New Guinea | 12.6% | 2015 |
| Solomon Islands | 11.8% | 2015 |
| Rwanda | 11.5% | 2019 |
| Sierra Leone | 11.4% | 2017 |
| Sweden | 10.5% | 2014 |
| Iraq | 10.5% | 2011 |
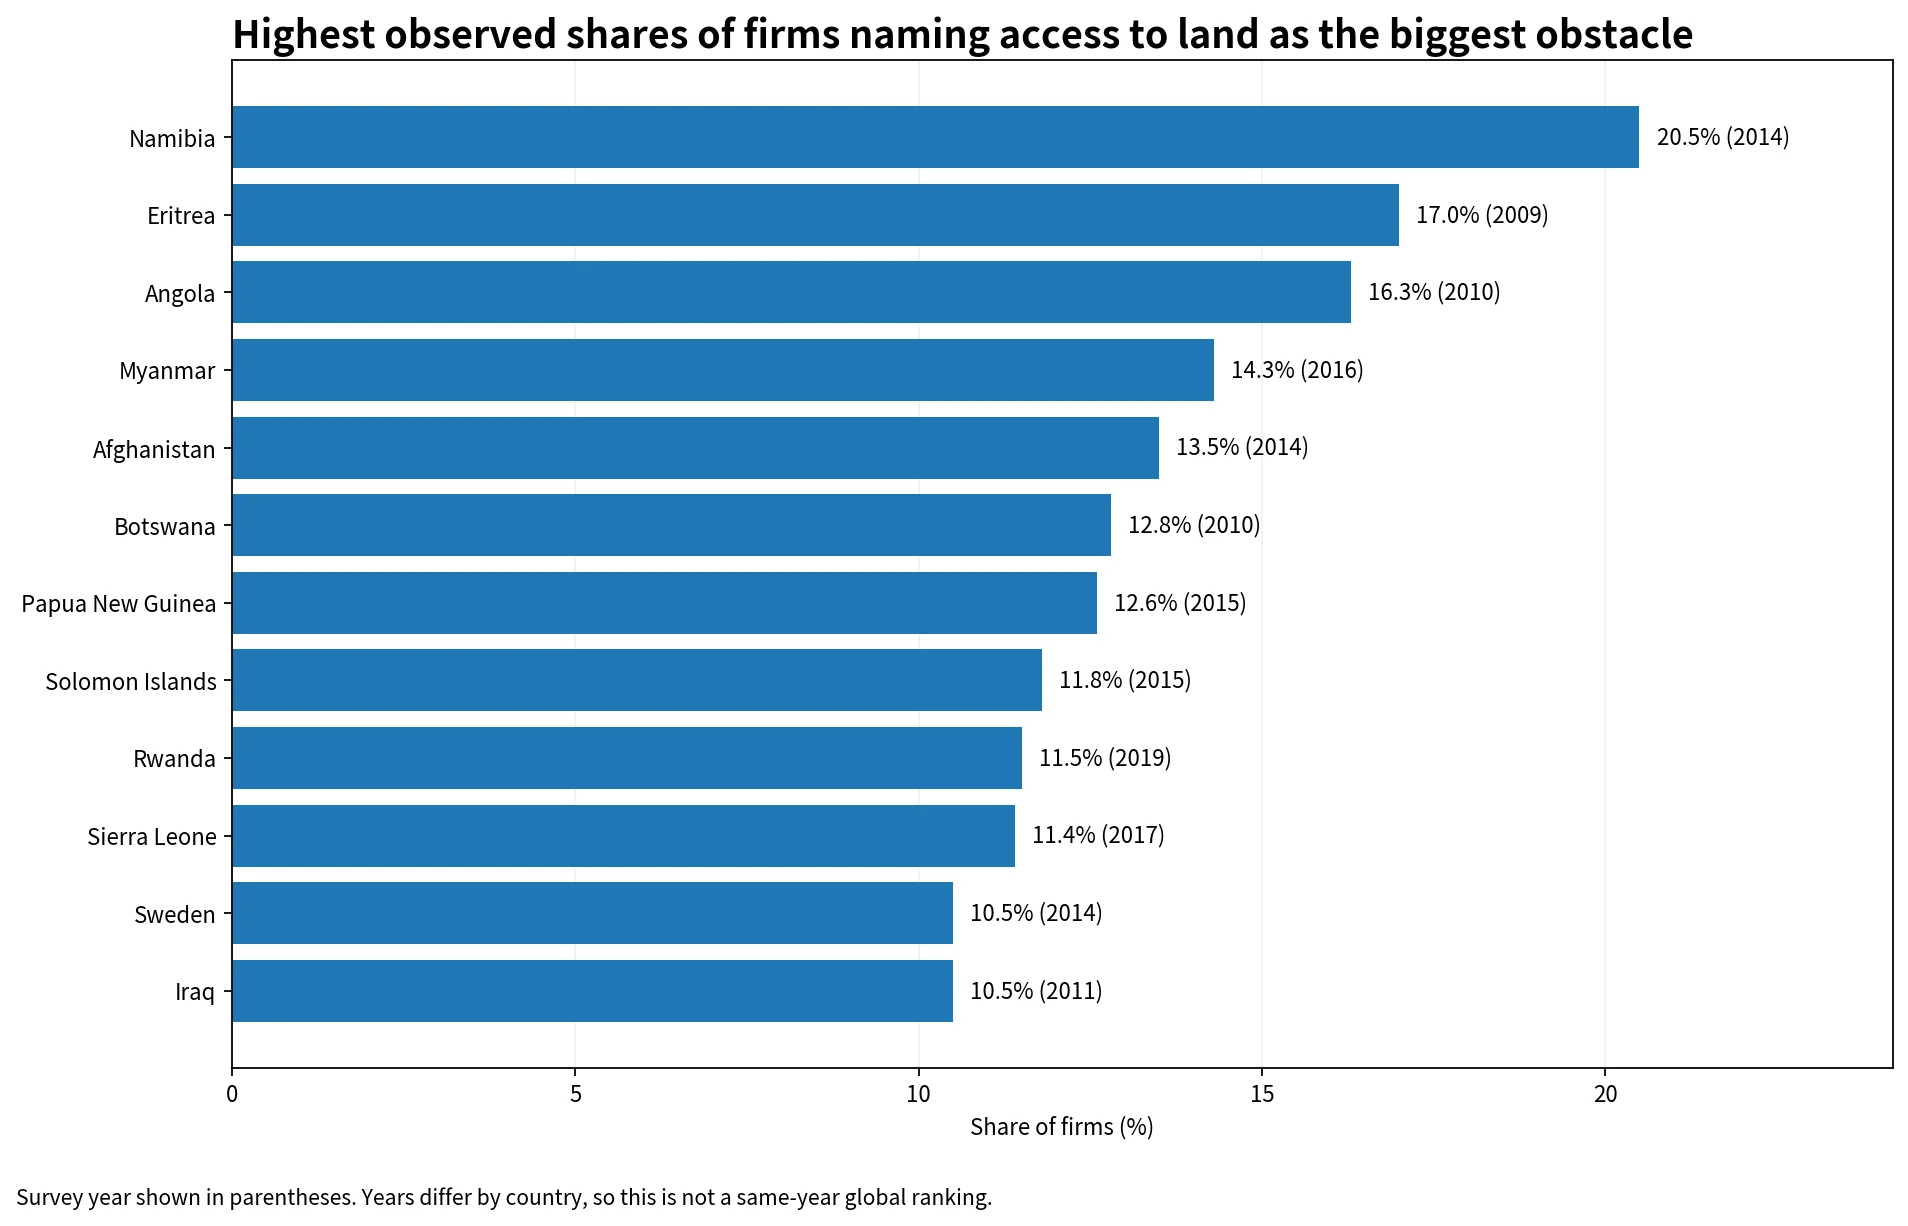
Several of the highest observations are in Africa and parts of Asia and the Pacific, but the indicator does not identify a common cause. Land administration, property systems, urban growth, site availability and other factors may be relevant topics for follow-up research, yet none can be inferred from this percentage alone. A high observation is best treated as a signal for deeper country-specific investigation using data aligned to the same survey period.
Different survey years are the key limitation
The dataset keeps the most recent non-empty observation available for each country. Only five retained observations are from 2020, while 38 are from 2019. Together, 43 of the 146 observations are from 2019–2020, and 87 are from 2015 or later. The remaining 59 observations predate 2015. Business conditions and land institutions can change substantially over such a long span, so a cross-country comparison must keep the survey year visible.
For example, China is at 5.6% in 2012, India at 4.6% in 2014, Mexico at 3.3% in 2010, South Africa at 2.7% in 2007, Nigeria at 2.6% in 2014, the Russian Federation at 2.0% in 2019, Indonesia at 1.2% in 2015, and Brazil at 0.5% in 2009. The values are useful as the latest observations retained in this series, but they should not be used as a table of current policy performance or investment attractiveness without more recent, aligned evidence.
| Country | Latest available value | Survey year |
|---|---|---|
| China | 5.6% | 2012 |
| India | 4.6% | 2014 |
| Mexico | 3.3% | 2010 |
| South Africa | 2.7% | 2007 |
| Nigeria | 2.6% | 2014 |
| Russian Federation | 2.0% | 2019 |
| Indonesia | 1.2% | 2015 |
| Brazil | 0.5% | 2009 |
Gray countries on the map are not automatically zero
The statistical table contains 146 country/economy observations, but 132 of them connect directly to visible polygons in the low-resolution world boundary layer used for the map. Some small islands and separately reported economies have valid statistical rows but are not represented as independent visible polygons at this scale. Other countries have no retained observation for this indicator. Gray therefore means either no value in this comparison or no direct boundary match—not a measured value of 0%.
This is why the map is best used to spot broad spatial patterns, while the table should be used to confirm exact values and years. Small island economies and other unmatched statistical units remain in the 146-observation summary calculations even when they cannot be colored on the map.
This is not a map of how much land is agricultural
“Access to land” in this Enterprise Surveys indicator is not a measure of the share of national territory used for farming. Agricultural land share, arable land share and permanent cropland share are physical land-use indicators with land area in the denominator. The indicator here is a business survey measure: the percentage of firms choosing land access as their biggest business-environment obstacle. A country with a large agricultural land share does not automatically have a high business land-access obstacle, and a country with little agricultural land does not automatically have easy access to commercial or industrial sites.
The two types of evidence can be examined together, but they answer different questions. Land-use maps describe the physical composition of territory; Enterprise Surveys describe firms’ reported priorities among business constraints. Any claim of correlation or causation would require additional datasets matched by country and year.
Data source and calculation method
Values come from the World Bank IC.FRM.OBS.OBST2 indicator. The comparison uses the latest non-empty country observation supplied for each economy and excludes regional, income-group and other aggregate rows. Descriptive statistics, thresholds and rankings are calculated directly from the 146 retained values. The world map uses Natural Earth 1:110m country boundaries, with 132 observations matched to visible polygons by country code.
The indicator is derived from World Bank Enterprise Surveys responses. Firms select the largest obstacle from a list of business-environment constraints, and the resulting percentage reflects reported priorities at the time of the survey. It is not a direct measure of land prices, transaction volumes, registration time, or the physical amount of land available for business use.
Frequently Asked Questions
What does the access-to-land biggest-obstacle percentage mean?
It is the share of surveyed establishments that selected access to land as the single biggest obstacle among a list of business-environment constraints. It is not a percentage of national land area.
Why do survey years differ across countries?
This comparison uses the latest available non-empty observation for each country in the supplied series. The retained observations span 2006–2020, so the map is not a same-year global snapshot.
Does gray on the map mean 0%?
No. Gray includes countries with no retained observation and statistical units that do not match a visible polygon in the low-resolution boundary layer. A recorded 0.0% is a separate statistical value.
Related Articles
- Global Agricultural Land Share Map – 2023 Country Comparison
- Global Arable Land Share Map – 2023 Country Comparison
- Global Permanent Cropland Share Map – 2023 Country Comparison
Green Map creates custom-edited map images using open geographic data sources such as geoBoundaries, Natural Earth, OpenStreetMap, and government open data.
These maps are edited visual materials, not raw data files, and are provided for education, documents, presentations, and graphic reference.