The World Bank Global Economic Monitor (GEM) is a public database for comparing frequently updated economic indicators across economies. The Data Catalog page is the official entry point for understanding the dataset and its access options, while the linked DataBank interface lets you choose countries, series, and time periods and then view the results as a table, chart, or map. GEM brings together indicators such as consumer prices, exchange rates, foreign reserves, GDP, industrial production, merchandise trade, retail sales, stock markets, terms of trade, and unemployment.
Think of the Data Catalog as the dataset landing page and DataBank as the workspace where you select variables, compare economies, switch to a map, and download results.
What you can find in Global Economic Monitor
The official catalog describes GEM as a high-frequency database covering global economic developments in advanced economies as well as emerging market and developing economies. The database is updated frequently, but the observations do not all share one frequency. The catalog explicitly notes monthly and/or quarterly data along with annual series, so the time scale of each selected indicator matters.
The catalog lists the dataset granularity as National. That makes GEM useful for country- and economy-level comparisons, not for parcel, county, municipal, or neighborhood GIS analysis. The map available through DataBank is best understood as a thematic view of selected economic values by economy rather than a service for downloading administrative boundary layers.
| Item | How GEM should be used |
|---|---|
| Indicator coverage | Consumer prices, exchange rates, reserves, GDP, industrial production, merchandise trade, retail sales, stock markets, terms of trade, unemployment, and related series |
| Geographic level | Primarily national/economy-level comparison |
| Time frequency | Varies by series; monthly, quarterly, annual, and other available periods should be checked before comparison |
| Views | DataBank offers Table, Chart, Map, and Metadata views |
| Downloads | DataBank provides Excel, CSV, and tab-delimited options; the catalog also links an Excel package and API resources |
The simplest workflow
- Open the official World Bank Global Economic Monitor Data Catalog page. Read the dataset description, geographic coverage, access information, and license.
- For interactive country comparisons, follow the DataBank link or open Global Economic Monitor in DataBank.
- Choose the economies you need in the Country panel. Selecting multiple economies makes it easier to compare the same series on a common screen.
- Choose the economic indicator in Series. If two series have similar names, open Metadata and confirm the definition and unit before continuing.
- Choose the relevant period in Time. Do not treat monthly, quarterly, and annual observations as interchangeable simply because they refer to the same year.
- Check the values in Table or Chart first. If a geographic comparison is useful, switch to Map after confirming that the selected economies have observations for that series and period.
- Use Download options for Excel, CSV, or tab-delimited output when you need the underlying values. For repeated or programmatic retrieval, use the API and API documentation paths listed by the Data Catalog.
Data Catalog and DataBank serve different purposes
The two official pages belong to the same GEM product but solve different parts of the task. The Data Catalog is the reference page: it tells you what the database covers, how it is classified, the geographic granularity, the license, and which access routes are available. It is the better page to cite when you need to identify the dataset itself.
DataBank is the working interface. It exposes Country, Series, and Time selections, along with Table, Chart, Map, and Metadata views. It also provides download options. A practical habit is to verify the value in Table, read the series definition in Metadata, and only then use Map for a spatial comparison. That sequence makes it easier to spot missing observations or a mismatched period before they become a misleading map.
Use the map as a thematic economic comparison
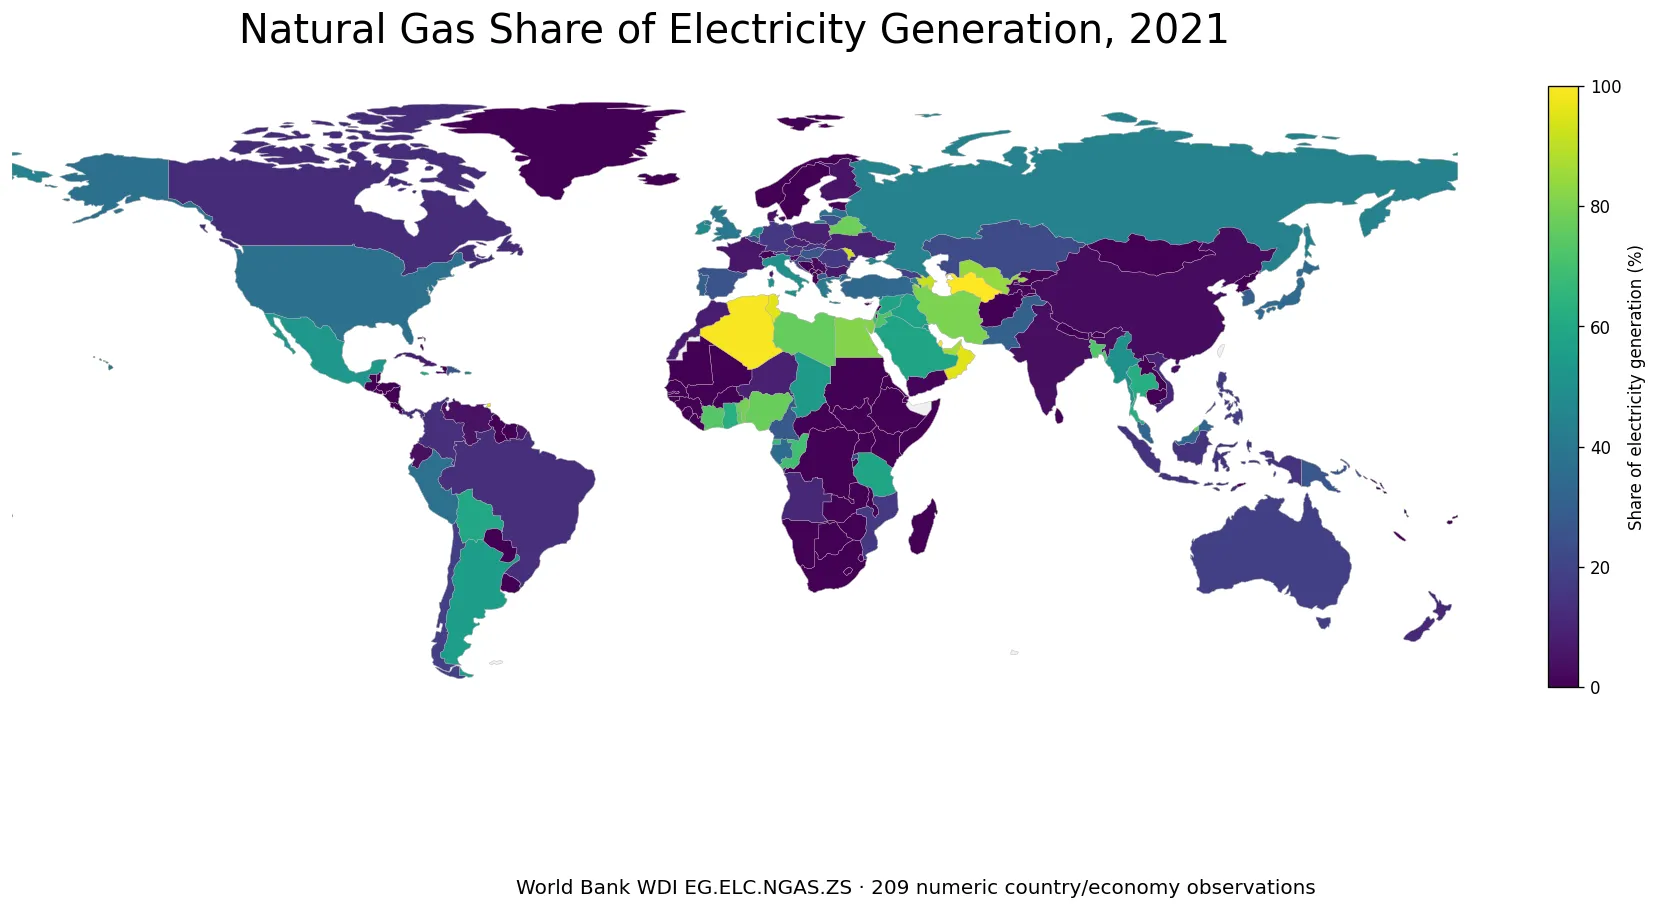
The GEM map is useful when geography helps you see differences among selected economies. A national indicator can be displayed spatially so that high and low values are easier to compare than in a long table. This is particularly useful for a first look at cross-country patterns in exchange rates, prices, industrial activity, trade, or other available GEM series.
The map does not turn GEM into a detailed GIS database. It should not be used to infer conditions within a country, locate infrastructure, inspect local administrative units, or obtain boundary geometry. If an economy is blank on the map, do not automatically interpret that as zero. Check Table or the downloaded data to determine whether the observation is actually missing for the selected time and series.
Read Metadata before comparing similar series
Economic databases often contain series that look similar in a short label but differ in important ways. A price or trade series may be seasonally adjusted or unadjusted; an exchange-rate series may use a particular currency convention; an index may have a base or transformation that changes how the numbers should be read. GEM provides a Metadata view for this reason.
- Definition: confirm exactly what the series measures.
- Unit: check whether the values are an index, percent, currency amount, ratio, or another unit.
- Frequency: verify whether the observations are monthly, quarterly, annual, or another available period.
- Adjustment: distinguish seasonally adjusted and unadjusted variants when the metadata indicates that difference.
- Availability: make sure the selected economy actually has observations for the period you intend to compare.
Daily updates do not mean every series is daily
The catalog describes GEM as being updated daily, while also stating that the database contains monthly and/or quarterly data and annual series. Those are different concepts. A database can be refreshed whenever new releases arrive even though the underlying indicator is observed only once a month, once a quarter, or once a year.
This distinction matters when you build a cross-country chart or map. Two indicators that both look “current” may refer to different reference periods. Always use the selected Series and Time information rather than treating the dataset update date as the observation date for every value.
When Excel, CSV, and API access are useful
For a quick comparison of a few economies, DataBank may be all you need. When you need many economies, several time periods, or your own charting and mapping workflow, downloading the underlying values is more practical. DataBank lists Excel, CSV, and tab-delimited download formats, and the Data Catalog also exposes an Excel package plus API and API documentation links.
For automated work, record the actual series identifier together with its definition and unit rather than relying only on the display title. That makes later updates easier to reproduce and reduces the risk of accidentally switching to a similarly named series.
Licensing and source notes
The World Bank Data Catalog classifies GEM as Public and lists the license as Creative Commons Attribution 4.0. When you reuse the data in a table, chart, or map, identify the World Bank Global Economic Monitor as the source and record the series, period, and unit used in your output. This is more useful than a generic “World Bank data” label because it allows the comparison to be reproduced.
Do not assume that a dataset-level update date is the latest observation date for every series. Before publishing a “latest” comparison, check the actual final period available for the selected series and economy and keep missing values distinct from zero.
When GEM is a good fit
- Comparing recent economic conditions across multiple countries in one official database
- Finding frequently updated indicators such as exchange rates, prices, industrial production, and trade
- Checking values in a table and then using a chart or map for a clearer cross-country comparison
- Downloading Excel or CSV data, or connecting a repeatable workflow to World Bank API resources
GEM is not the right source when the task requires city- or county-level statistics, parcel information, road networks, land-cover layers, or GIS boundary files. Its strength is the consistent exploration of national economic time series through a single World Bank product.
Official sources: World Bank Data Catalog – Global Economic Monitor · World Bank DataBank – Global Economic Monitor (GEM)
Frequently asked questions
Can I make a country-level economic map with Global Economic Monitor?
Yes. The GEM DataBank interface includes a Map view for the selected country, series, and time choices. It is a thematic comparison of economic values, not a GIS boundary-download service or a source of subnational spatial layers.
Is every GEM observation daily?
No. The database is updated frequently, but the official catalog says it includes monthly and/or quarterly data as well as annual series. Check the frequency and time selection for the specific series you use.
Should I start with Data Catalog or DataBank?
Start with the Data Catalog when you need to understand or cite the dataset. Move to DataBank when you want to select countries, series, and periods and view the results as a table, chart, or map.
Does a blank country on the map mean the value is zero?
Not necessarily. The observation may be unavailable for the selected series or period. Verify the value in Table or in the downloaded data before interpreting a blank area.
Related Maps
Green Map creates custom-edited map images using open geographic data sources such as geoBoundaries, Natural Earth, OpenStreetMap, and government open data.
These maps are edited visual materials, not raw data files, and are provided for education, documents, presentations, and graphic reference.