World Bank indicator SE.TER.CUAT.MS.ZS provides latest non-null observations for 170 countries and separately reported economies, but the reference years span 2001 to 2024. To avoid treating old surveys as current, this page uses only the 126 observations dated 2020–2024 for the main map, ranking tables and distribution statistics.
The recent-sample median is 3.4% and the unweighted mean is 6.9%. Luxembourg reports 29.1% in 2023, Georgia 24.9% in 2024, and the Slovak Republic 22.3% in 2023. Because the years differ, these values should be described as recent observations rather than a synchronized 2024 league table.
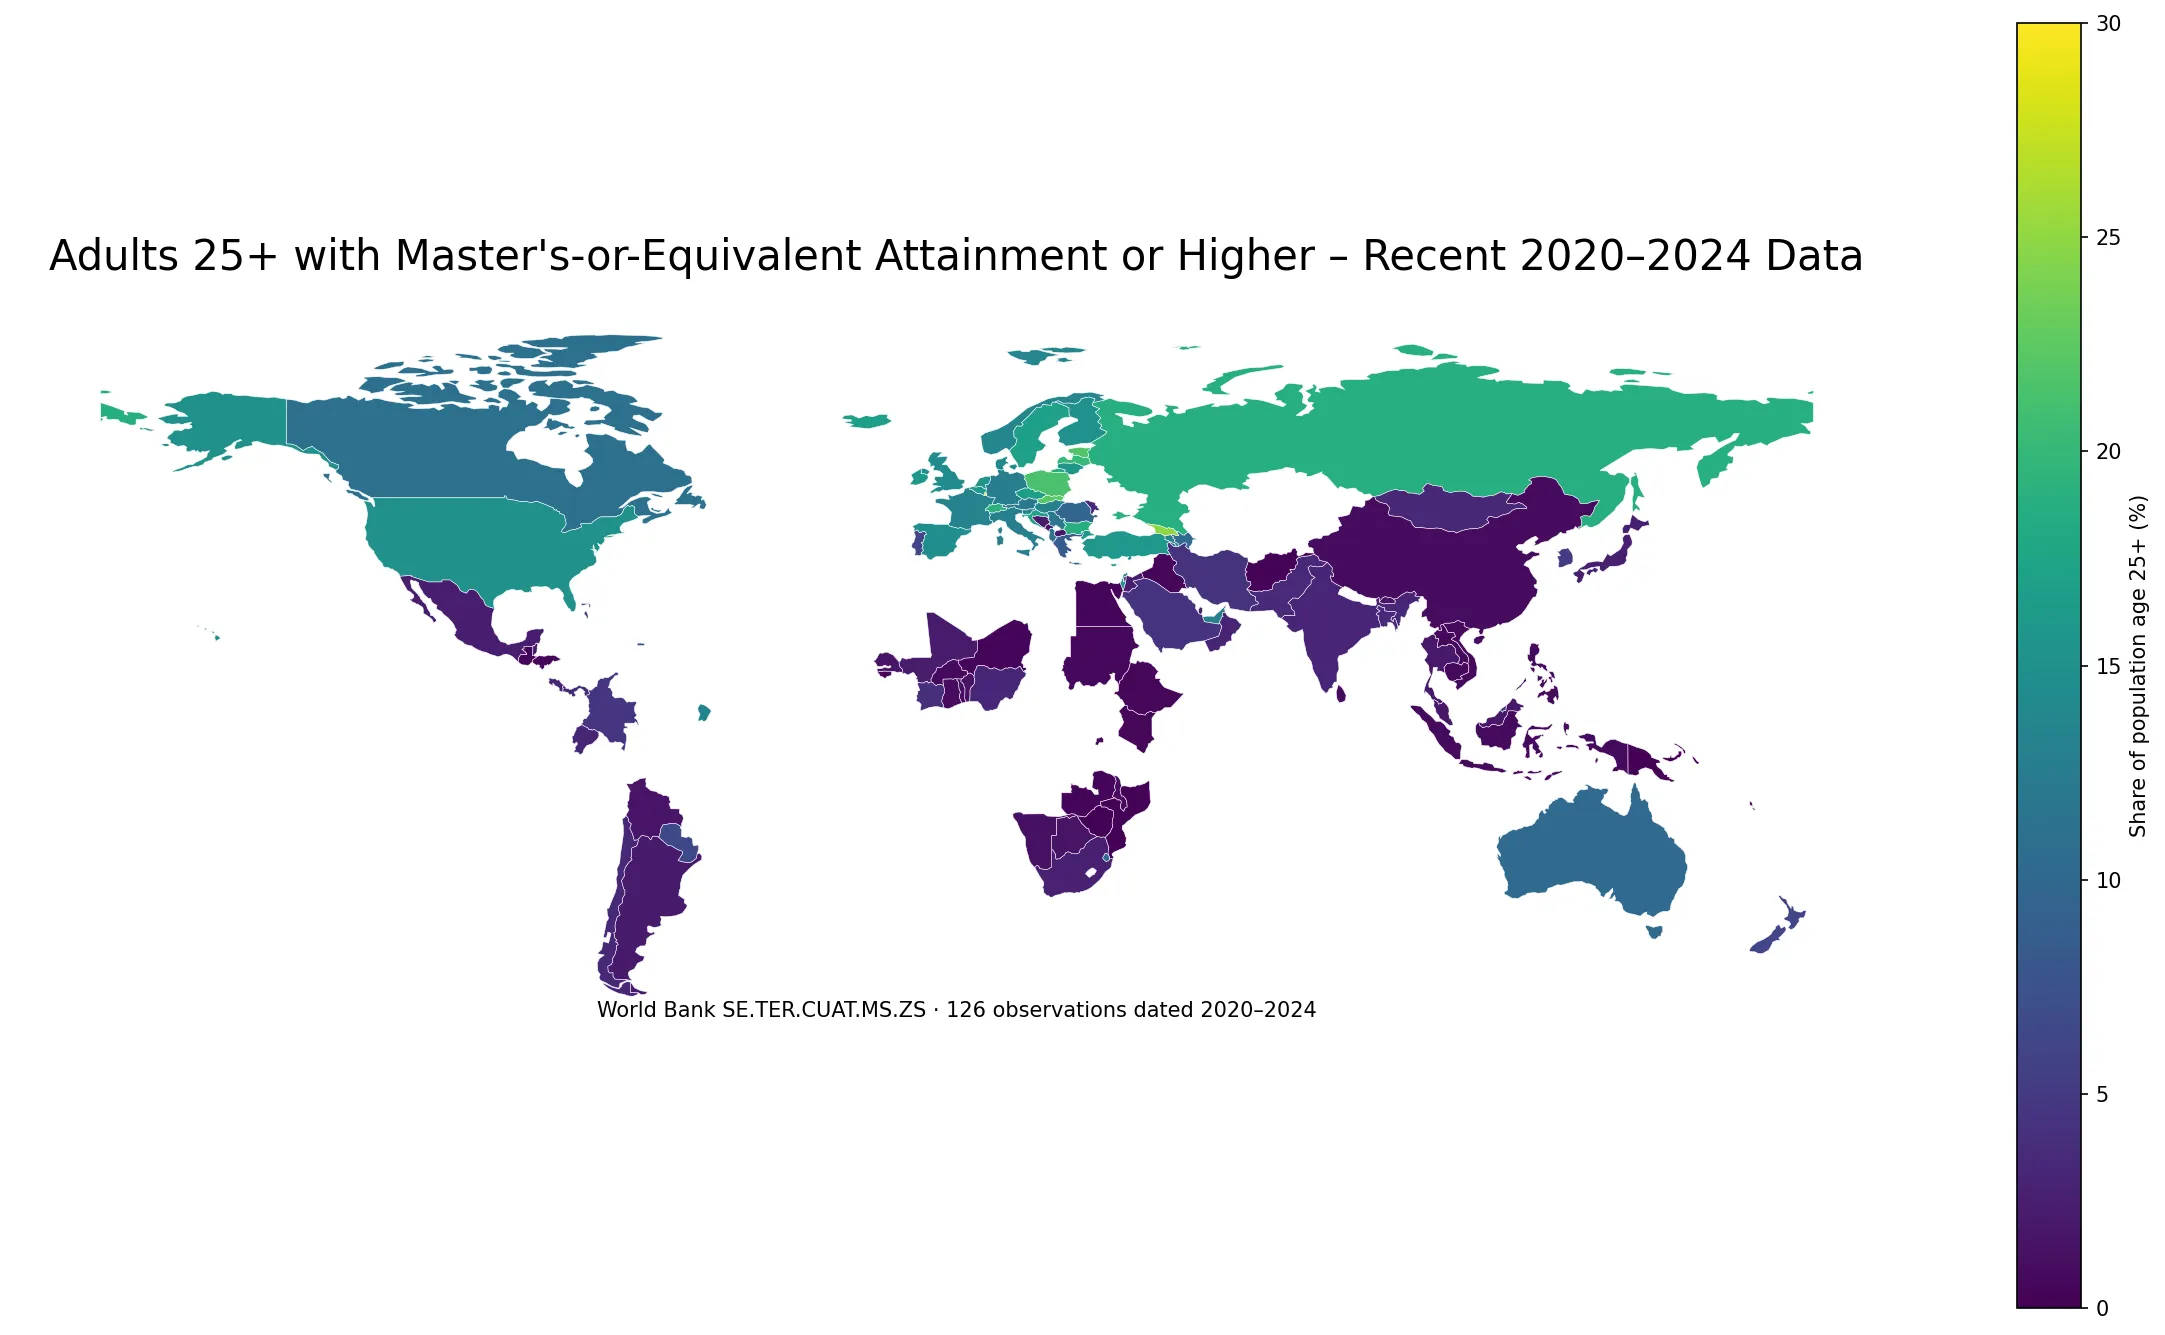
Table of Contents
The indicator measures adults 25+ who completed a Master’s-or-equivalent level or higher
The official series is World Bank SE.TER.CUAT.MS.ZS, titled Educational attainment, at least Master’s or equivalent, population 25+, total (%) (cumulative). The denominator is the population age 25 and older. The numerator includes people who have attained or completed Master’s-or-equivalent education and those who continued to a higher level.
In the UNESCO ISCED framework, Master’s-or-equivalent programs are generally classified at ISCED level 7. The classification supports international comparison, but national degree names, professional qualifications and program structures do not map perfectly one-for-one across countries. A broad comparison of the harmonized level is more defensible than treating every national qualification as identical.
The phrase “at least” is important. Doctoral-level completers are also above this threshold. A value of 10% therefore means that about one in ten adults age 25+ have completed a Master’s-or-equivalent level or higher, not that exactly 10% stopped their education at the Master’s level.
Only 20 observations are from 2024, so this is not a 2024 world ranking
The source package retains one latest non-null observation per country/economy. Only 20 recent rows are dated 2024. There are 55 from 2023, 28 from 2022, 11 from 2021 and 12 from 2020. Together, the five-year window contains 126 observations, or 74.1% of the full latest-value set.
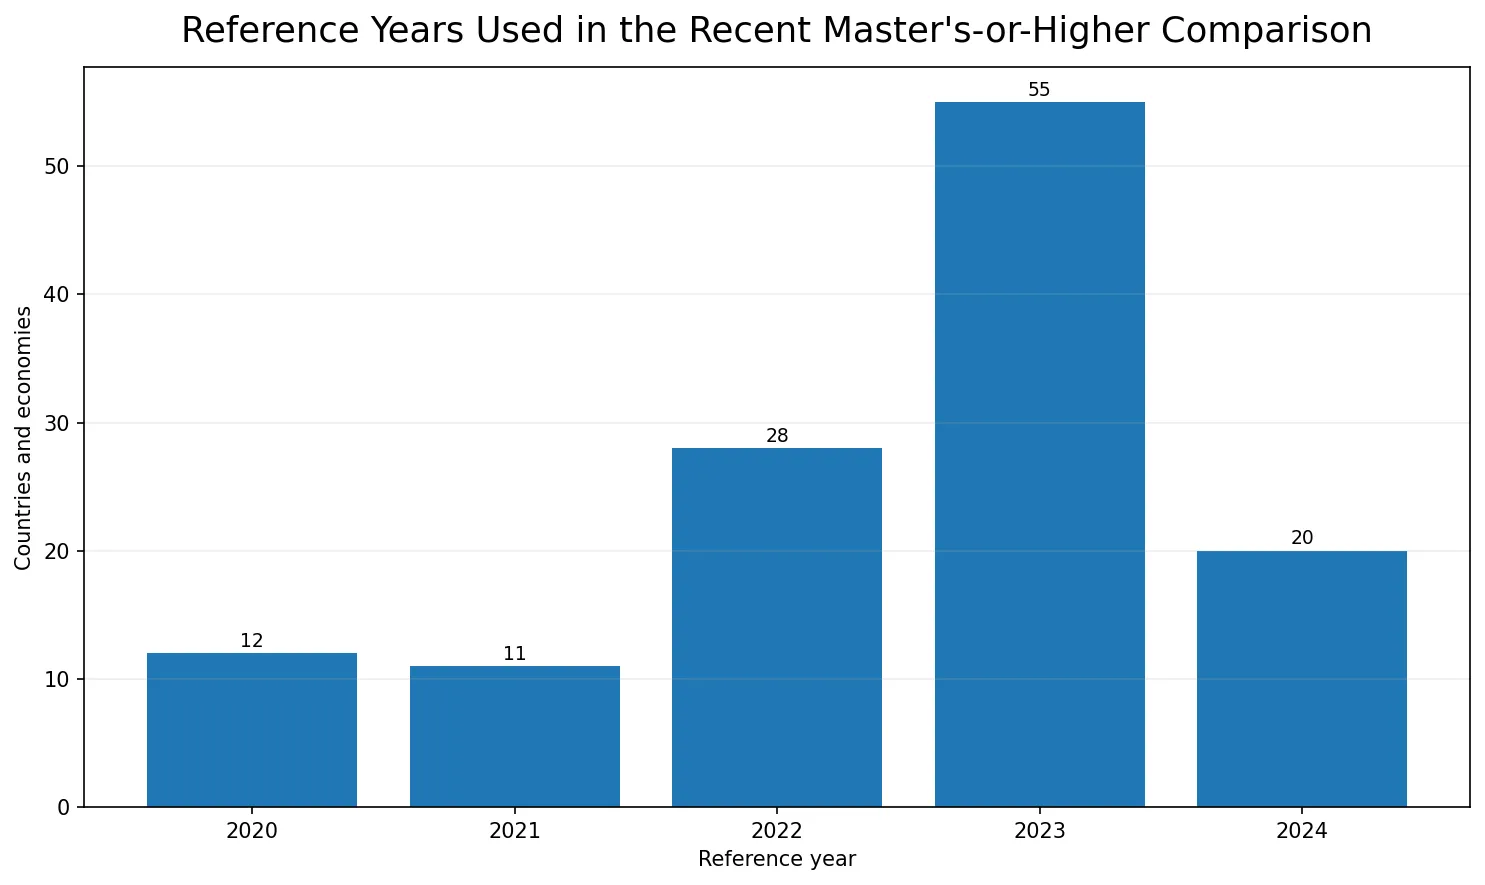
The remaining 44 latest-value rows are dated 2019 or earlier, with the oldest reaching back to 2001. Adult educational attainment changes more slowly than a monthly economic indicator, but a decade-old or two-decade-old observation should not be presented as a current peer comparison. Those older rows are preserved in the source package but excluded from the main currentness-focused visuals.
The recent median is 3.4%, and more than half of the observations are below 5%
Among the 126 recent observations, 28 are below 1%, 58 below 3%, and 73 below 5%. At the higher end, 44 are at 10% or above, 21 at 15% or above, 6 at 20% or above, and only 1 reaches 25%.
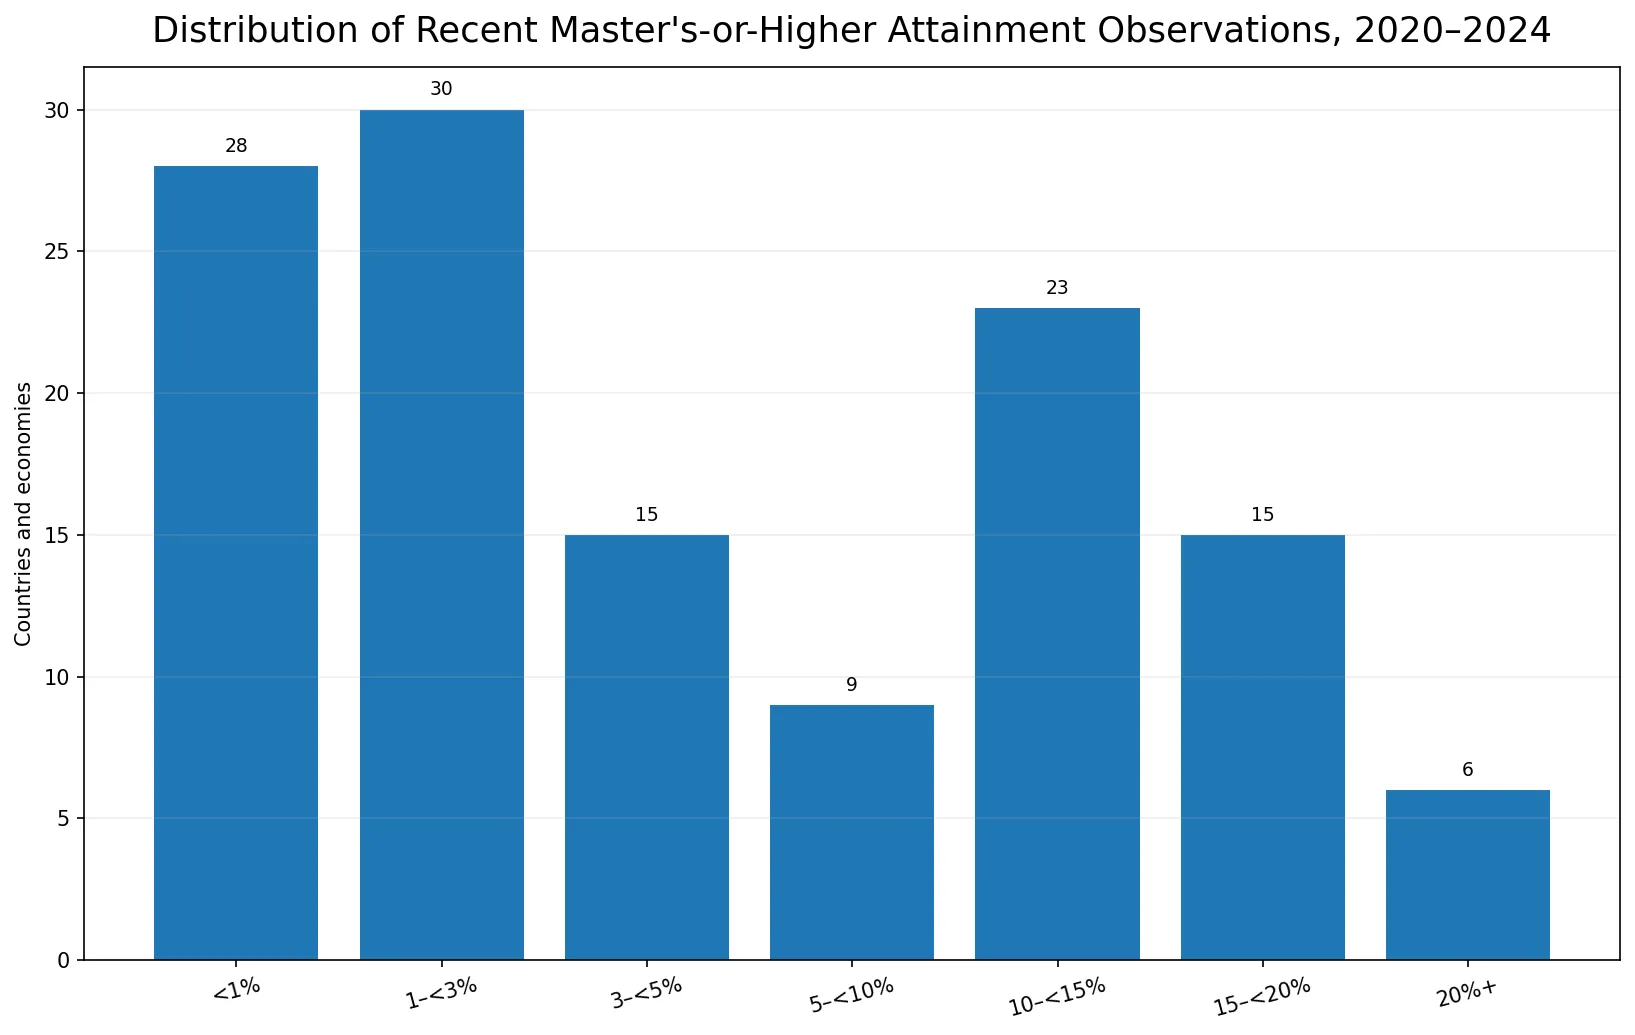
| Master’s-or-higher attainment | Countries/economies | Share of 126 |
|---|---|---|
| <1% | 28 | 22.2% |
| 1–<3% | 30 | 23.8% |
| 3–<5% | 15 | 11.9% |
| 5–<10% | 9 | 7.1% |
| 10–<15% | 23 | 18.3% |
| 15–<20% | 15 | 11.9% |
| 20%+ | 6 | 4.8% |
The unweighted mean of 6.9% is roughly double the 3.4% median because a small group of high observations pulls the average upward. Neither statistic is a population-weighted estimate of the share of all adults worldwide with Master’s-or-higher attainment; every country/economy row receives equal weight here.
Luxembourg, Georgia, the Slovak Republic and Estonia are among the highest recent observations
Luxembourg is highest in the 2020–2024 subset at 29.1% in 2023. Georgia reports 24.9% in 2024, the Slovak Republic 22.3% in 2023, Estonia 21.8% in 2023, Poland 21.4% in 2021, and Latvia 20.2% in 2023. Switzerland, Bulgaria and the Russian Federation are in the high teens.
| Country or economy | Reference year | Adults 25+ at Master’s-or-equivalent or higher |
|---|---|---|
| Luxembourg | 2023 | 29.1% |
| Georgia | 2024 | 24.9% |
| Slovak Republic | 2023 | 22.3% |
| Estonia | 2023 | 21.8% |
| Poland | 2021 | 21.4% |
| Latvia | 2023 | 20.2% |
| Switzerland | 2024 | 19.1% |
| Bulgaria | 2023 | 18.9% |
| Russian Federation | 2021 | 18.9% |
| Croatia | 2023 | 17.0% |
| Sweden | 2023 | 17.0% |
| Iceland | 2023 | 16.7% |
The table is intentionally a recent-observation comparison rather than an exact synchronized ranking. Small percentage-point differences should not be converted into claims about education quality or national human-capital superiority when the reference years and qualification structures differ.
28 recent observations are below 1%
Mozambique is at 0.18% in 2022, Papua New Guinea 0.22% in 2022, Zimbabwe 0.22% in 2023, Guinea-Bissau 0.28% in 2022, and Afghanistan 0.31% in 2021. Honduras, Egypt, Niger, Guatemala and Zambia are also below 0.5%.
| Country or economy | Reference year | Adults 25+ at Master’s-or-equivalent or higher |
|---|---|---|
| Mozambique | 2022 | 0.2% |
| Papua New Guinea | 2022 | 0.2% |
| Zimbabwe | 2023 | 0.2% |
| Guinea-Bissau | 2022 | 0.3% |
| Afghanistan | 2021 | 0.3% |
| Honduras | 2024 | 0.4% |
| Egypt, Arab Rep. | 2023 | 0.4% |
| Niger | 2022 | 0.4% |
| Guatemala | 2023 | 0.4% |
| Zambia | 2023 | 0.4% |
| Ethiopia | 2021 | 0.5% |
| Vanuatu | 2020 | 0.5% |
The indicator does not identify the causes of low or high attainment. University capacity, tuition and financial aid, Bachelor’s-level participation, labor-market demand, migration, gender gaps, regional access and demographic history can all matter, but they require separate evidence.
Korea is 5.1% in 2024 and the United States is 15.0%
Selected recent observations include the United States at 15.0% in 2024, Korea at 5.1% in 2024, Australia at 10.3% in 2024, and the United Arab Emirates at 13.4% in 2024. Canada reports 11.2% in 2023, Germany 12.7% in 2023, France 13.5% in 2023, Spain 14.9% in 2023, and Italy 13.0% in 2023. The United Kingdom and Russian Federation are represented by 2021 observations.
| Country | Reference year | Adults 25+ at Master’s-or-equivalent or higher |
|---|---|---|
| United States | 2024 | 15.0% |
| Korea, Rep. | 2024 | 5.1% |
| Canada | 2023 | 11.2% |
| Australia | 2024 | 10.3% |
| Germany | 2023 | 12.7% |
| France | 2023 | 13.5% |
| United Kingdom | 2021 | 14.4% |
| Spain | 2023 | 14.9% |
| Italy | 2023 | 13.0% |
| Russian Federation | 2021 | 18.9% |
| United Arab Emirates | 2024 | 13.4% |
| China | 2020 | 0.9% |
| India | 2023 | 3.1% |
| Indonesia | 2023 | 0.7% |
| Japan | 2020 | 2.5% |
| South Africa | 2024 | 2.6% |
China is represented by a 2020 value of 0.9%, Japan by 2.5% in 2020, India by 3.1% in 2023, Indonesia by 0.7% in 2023, and South Africa by 2.6% in 2024. For country-specific change over time, a national time series is more appropriate than comparing one latest observation against another country’s different reference year.
This is a much higher education threshold than short-cycle tertiary attainment
The related short-cycle-tertiary attainment indicator uses a much lower threshold in the education hierarchy. Upper-secondary and lower-secondary attainment use lower thresholds still. Within the same country, year and classification basis, the share reaching a higher threshold will normally be no larger than the share reaching a lower one.
However, differences between separate latest-value articles should not be converted into a Master’s progression rate or a Bachelor’s-to-Master’s transition rate unless the reference year, coverage and denominator are aligned. This indicator measures the accumulated stock of adult attainment, not the annual flow of graduates moving from one degree level to the next.
This is not the current graduate-school enrollment rate or this year’s Master’s graduation rate
SE.TER.CUAT.MS.ZS is a cumulative attainment measure for the population age 25 and older. It does not measure how many students are currently enrolled in graduate school, how many Master’s degrees were awarded this year, or what percentage of Bachelor’s graduates entered a Master’s program.
The denominator combines younger adults educated recently with older adults educated under earlier systems. That makes the indicator useful for the stock of advanced educational attainment accumulated in the adult population, while making it slower to reflect recent expansion of postgraduate education than a current-cohort enrollment or graduation measure.
Data source and comparison method
The statistical source is World Bank World Development Indicators SE.TER.CUAT.MS.ZS. World Bank metadata identifies the UNESCO Institute for Statistics as the underlying source and defines the series as the percentage of the population age 25+ that attained or completed Master’s-or-equivalent education.
The verified source CSV contains 170 latest non-null country/economy observations spanning 2001–2024. The main map, ranking tables and distribution statistics on this page restrict the sample to the 126 observations dated 2020–2024. The recent-sample mean is 6.94% and median 3.42%. ISO-3 codes are joined to a simplified world boundary layer, with 112 polygons directly matched to recent values. An unfilled area does not mean zero attainment.
Frequently Asked Questions
What does Master’s-or-higher attainment measure?
It is the share of the population age 25+ that has attained or completed a Master's-or-equivalent level or a higher education level. The World Bank indicator code is SE.TER.CUAT.MS.ZS.
Why is this not presented as a 2024 world ranking?
Only 20 of the 170 latest non-null observations are dated 2024, and the full package spans 2001–2024. The main map and comparison tables use the 126 observations dated 2020–2024.
Is this the current graduate-school enrollment rate?
No. It is a cumulative attainment measure for adults age 25 and older, not current enrollment, annual Master's graduates or a Bachelor's-to-Master's transition rate.
Does Master’s or equivalent mean the exact same credential in every country?
No. The data are harmonized to an international education level, generally ISCED 7, while national degree names and professional qualifications can differ.
Related Articles
These live Green Map attainment pages show the same adult-education concept at lower thresholds in the education hierarchy.
- Global Short-Cycle Tertiary Attainment Map – Latest Values for Adults 25+
- Global Upper-Secondary Educational Attainment Map – Latest Values for Adults 25+
- Global Lower-Secondary-or-Higher Attainment Map – Latest Values for Adults 25+
Green Map creates custom-edited map images using open geographic data sources such as geoBoundaries, Natural Earth, OpenStreetMap, and government open data.
These maps are edited visual materials, not raw data files, and are provided for education, documents, presentations, and graphic reference.