A same-year comparison of nuclear electricity reveals a highly uneven global distribution. The verified World Bank master contains 217 countries and economies, with 208 numeric observations for 2021. Of those numeric rows, 176 report exactly 0.0%, leaving only 32 observations above zero. At the upper end, France reaches 68.3%, Ukraine 54.6%, the Slovak Republic 52.4%, and Belgium 50.1%. The map therefore separates a small group where nuclear power is a meaningful part of the electricity mix from a much larger set of reported zero-share systems.
The indicator is World Bank World Development Indicators series EG.ELC.NUCL.ZS, officially labeled Electricity production from nuclear sources (% of total). The denominator is total electricity production within each country or economy. A value of 60% means that nuclear sources supplied about 60% of that economy’s electricity production; it does not mean the country generated 60% of the world’s nuclear electricity. Installed nuclear capacity, reactor counts, and absolute generation in TWh are different measures.
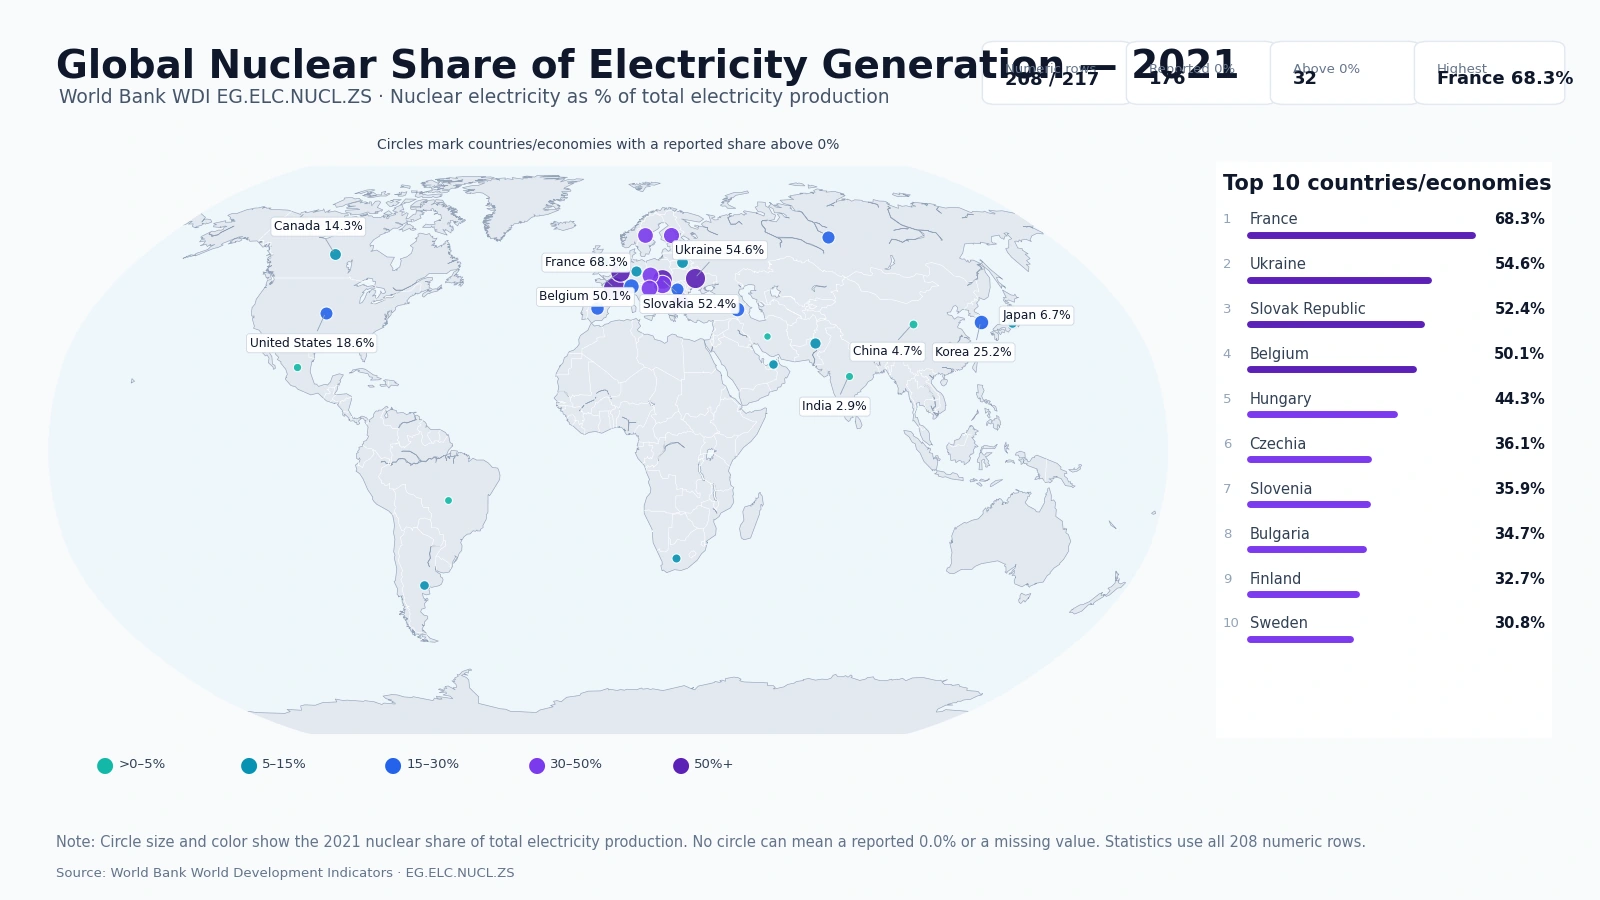
Table of Contents
Reported zero shares dominate the country/economy distribution
Exactly 176 of the 208 numeric observations are 0.0%, equal to 84.6% of the numeric set. Six observations are above zero but below 5%, nine fall from 5% to under 15%, seven from 15% to under 30%, six from 30% to under 50%, and only four are at 50% or above. The median across all 208 observations is therefore 0.0%. That median describes the cross-country distribution; it is not a statement that half of world electricity comes from systems with zero nuclear generation.
| 2021 nuclear share | Countries/economies | Share of 208 |
|---|---|---|
| 0% | 176 | 84.6% |
| >0% to <5% | 6 | 2.9% |
| 5% to <15% | 9 | 4.3% |
| 15% to <30% | 7 | 3.4% |
| 30% to <50% | 6 | 2.9% |
| 50%+ | 4 | 1.9% |
The unweighted mean across all 208 numeric observations is only 3.4%. Restricting the calculation to the 32 observations above zero changes the picture sharply: their mean is 22.1% and their median is 18.8%. This split is why a single all-country average is not a very useful summary of nuclear use. Most observations sit at zero, while a relatively small positive-share group spans from roughly 1% to more than two-thirds of electricity production.
Four reported systems are above 50% nuclear electricity
France has the highest 2021 observation at 68.3%. Ukraine follows at 54.6%, the Slovak Republic at 52.4%, and Belgium at 50.1%. Hungary is next at 44.3%. Czechia, Slovenia, Bulgaria, Finland, and Sweden round out the top ten, all above 30%. A strong European concentration is visible in the map: many of the highest positive shares are clustered across Western, Northern, Central, and Eastern Europe rather than being evenly distributed across continents.
| Rank | Country or economy | 2021 nuclear share |
|---|---|---|
| 1 | France | 68.3% |
| 2 | Ukraine | 54.6% |
| 3 | Slovak Republic | 52.4% |
| 4 | Belgium | 50.1% |
| 5 | Hungary | 44.3% |
| 6 | Czechia | 36.1% |
| 7 | Slovenia | 35.9% |
| 8 | Bulgaria | 34.7% |
| 9 | Finland | 32.7% |
| 10 | Sweden | 30.8% |
South Korea is at 25.2%, well above Japan, China, and India
Korea, Rep. records 25.2% in the verified 2021 file. The United States is 18.6% and Canada 14.3%. Japan is 6.7%, China 4.7%, and India 2.9%. Brazil is 2.2% and South Africa 5.2%. These comparisons are shares within national electricity systems, not rankings by the amount of nuclear electricity generated. A very large power market at a lower percentage can still generate more nuclear electricity in absolute terms than a smaller market at a higher percentage.
| Country or economy | 2021 nuclear share |
|---|---|
| Korea, Rep. | 25.2% |
| United States | 18.6% |
| Canada | 14.3% |
| Japan | 6.7% |
| China | 4.7% |
| India | 2.9% |
| Brazil | 2.2% |
| South Africa | 5.2% |
A percentage share does not rank countries by nuclear output
EG.ELC.NUCL.ZS is a composition indicator. It tells us how important nuclear generation is inside each electricity mix, but the supplied file does not include total national electricity generation. Without that denominator in GWh or TWh, this article does not manufacture an absolute nuclear-generation ranking. France at 68.3% and the United States at 18.6% answer a mix question, not a volume question. The same caution applies to comparisons between small and large electricity markets throughout the table.
Reported 0.0% and missing data are kept separate
Nine master rows do not have a retained 2021 value: Bermuda, the Channel Islands, Gibraltar, the Isle of Man, Liechtenstein, Macao SAR, Monaco, the Northern Mariana Islands, and San Marino. They remain missing rather than being converted to zero or filled with another year. By contrast, the 176 zero-share rows are numeric observations explicitly present in the cleaned file. Because the map draws circles only for values above zero, the text and tables preserve the important distinction between a reported 0.0% and no 2021 observation.
Why the comparison holds every observation to 2021
The package collection rule does not mix each economy’s latest available year. It selects the latest single reference year that clears an 80% coverage threshold. For this indicator, 2021 provides 208 numeric observations out of the 217-row master, or about 95.9% coverage. Holding the year fixed makes country comparisons internally consistent. More recent country-specific values may exist, but they are outside this 2021 common-year analysis and should not be silently mixed into the map.
Europe has the densest cluster of high shares, while Asia spans a wide range
Plotting the 32 positive observations reveals a dense European cluster, including the four 50%+ observations and many of the 30–50% values. Asia is more dispersed: Armenia is 25.4%, Korea 25.2%, Pakistan 12.0%, Japan 6.7%, China 4.7%, India 2.9%, and Iran 1.2%. In South America, Argentina is 7.1% and Brazil 2.2%; South Africa is 5.2% in Africa. The map is useful for identifying where nuclear power occupies a large share of the electricity mix, but explaining those differences requires separate evidence on national power systems, policy, generation assets, and market structure.
Data source and calculation method
The primary dataset is World Bank WDI EG.ELC.NUCL.ZS. The cleaned package excludes World Bank regional and income aggregates while retaining the 217-country/economy geography master. All 208 numeric 2021 observations are used as supplied, and the nine source-missing rows remain missing. The World Bank indicator page identifies the IEA Energy Statistics Data Browser as the underlying source. Rankings, threshold counts, the mean, and the median in this article are calculated directly from the packaged 2021 file.
Frequently Asked Questions
Which country had the highest nuclear share of electricity in 2021?
France had the highest observation in the verified file at 68.3%, followed by Ukraine at 54.6%, the Slovak Republic at 52.4%, and Belgium at 50.1%.
What was South Korea’s nuclear electricity share in 2021?
Korea, Rep. was at 25.2% in World Bank WDI series EG.ELC.NUCL.ZS. This is the share of national electricity production from nuclear sources, not a share of world nuclear output.
Does no circle on the map always mean 0% nuclear electricity?
No. The cleaned file has 176 reported 0.0% observations and nine separate missing rows. The map shows circles only for positive values, so zero and missing status must be distinguished from the statistical table and notes.
Why does this comparison use 2021?
The package rule selects the latest single year with at least 80% coverage. The 2021 file contains 208 numeric observations out of 217 master rows, about 95.9% coverage.
Related Maps
Green Map creates custom-edited map images using open geographic data sources such as geoBoundaries, Natural Earth, OpenStreetMap, and government open data.
These maps are edited visual materials, not raw data files, and are provided for education, documents, presentations, and graphic reference.