Government spending on primary education varies sharply when measured against the size of each economy. Among the 103 countries and territories with a 2022 observation in the UNESCO Institute for Statistics data, the value ranges from 0.11% of GDP in Thailand to 3.65% in Bhutan. The median is 1.22% and the simple mean is 1.30%, so the typical observation sits well below the highest outliers.
The indicator measures government expenditure on primary education as a percentage of gross domestic product. It is a ratio, not a measure of spending per pupil, school quality, or learning outcomes. That distinction matters because countries with very different GDP levels, student populations, and budget structures can post similar percentages.
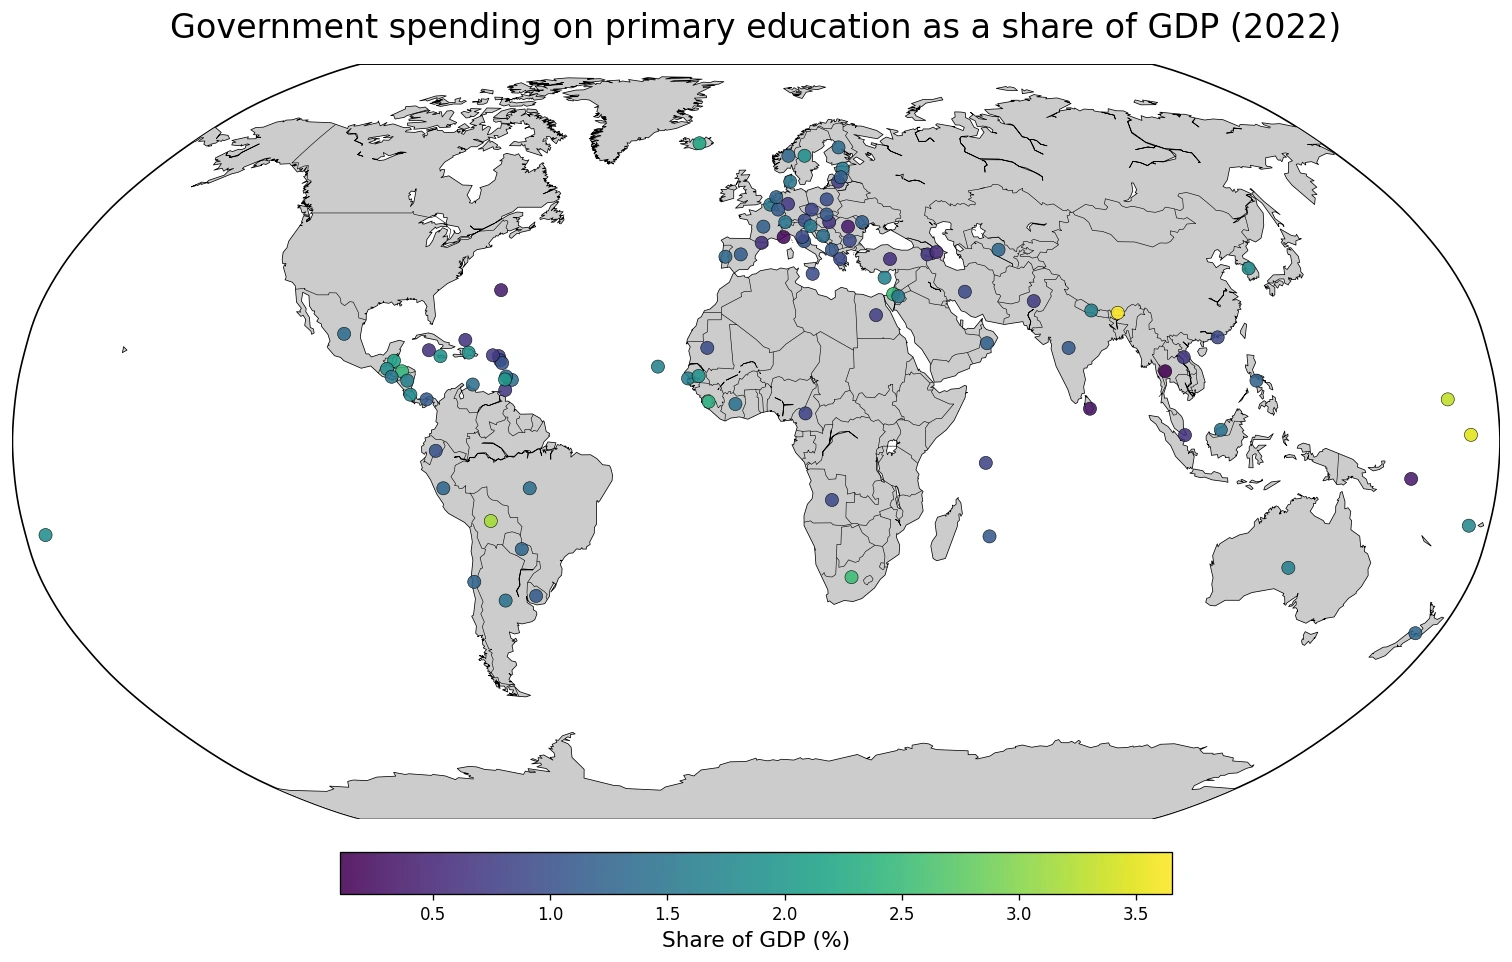
Table of Contents
The 2022 distribution is wide, even before looking at the extremes
The middle half of the observations falls between 0.88% and 1.58% of GDP. 36 observations are below 1%, 57 fall from 1% to under 2%, and 10 are at or above 2%. That makes the 1% to 2% band the most common range, but it does not describe the full geographic story.
High values are not confined to one continent. Bhutan leads in South Asia, Kiribati and the Marshall Islands stand out in the Pacific, Bolivia is high in South America, South Africa and Sierra Leone are among the higher African observations, Israel is high in Western Asia, Honduras and Belize stand out in Central America, and Iceland is high in Northern Europe. The map therefore points to a scattered pattern rather than a single high-spending world region.
The ten highest shares all exceed 2% of GDP
The upper end contains several very large ratios. Bhutan, Kiribati, the Marshall Islands, and Bolivia are all above 3% of GDP. The remaining members of the top ten are above 2%, including South Africa, Israel, Honduras, Sierra Leone, Iceland, and Belize.
| Rank | Country or territory | Primary education spending as share of GDP |
|---|---|---|
| 1 | Bhutan | 3.65% |
| 2 | Kiribati | 3.50% |
| 3 | Marshall Islands | 3.31% |
| 4 | Bolivia (Plurinational State of) | 3.18% |
| 5 | South Africa | 2.52% |
| 6 | Israel | 2.51% |
| 7 | Honduras | 2.45% |
| 8 | Sierra Leone | 2.37% |
| 9 | Iceland | 2.21% |
| 10 | Belize | 2.14% |
The difference between the top and the middle of the distribution is substantial. A 3.5% share is nearly three times the median observation of 1.22%. That does not automatically mean the top-ranked systems spend three times as much per child, because the denominator is GDP and population structure differs across countries.
At the lower end, several observations are below 0.5%
Thailand has the lowest reported 2022 value in this set at 0.11% of GDP, followed by Monaco at 0.19% and Sri Lanka at 0.32%. The Solomon Islands, Romania, and Bermuda are also below 0.4%. These figures deserve careful interpretation because a low GDP share can result from many combinations of budget structure and economic scale.
| Low-end rank | Country or territory | Primary education spending as share of GDP |
|---|---|---|
| 1 | Thailand | 0.11% |
| 2 | Monaco | 0.19% |
| 3 | Sri Lanka | 0.32% |
| 4 | Solomon Islands | 0.37% |
| 5 | Romania | 0.38% |
| 6 | Bermuda | 0.39% |
| 7 | Azerbaijan | 0.57% |
| 8 | Türkiye | 0.58% |
| 9 | Andorra | 0.61% |
| 10 | Singapore | 0.62% |
Nearby countries can still look very different
The Pacific offers one of the clearest contrasts. Kiribati records 3.50% and the Marshall Islands 3.31%, while the Solomon Islands is at 0.37%. The map makes this contrast easier to notice than a global ranking alone because the high and low observations occupy the same broad oceanic region.
South Asia is similarly uneven. Bhutan has the highest value in the full dataset at 3.65%, while Sri Lanka is at 0.32% and Pakistan at about 0.76%. Central America, by contrast, contains several relatively high observations close together: Honduras at 2.45%, Belize at 2.14%, Guatemala at 1.85%, and Costa Rica at 1.77%.
Europe also spans a wide range. Iceland is at 2.21% and Sweden at 1.85%, while Monaco is at 0.19% and Romania at 0.38%. These within-region differences are a reminder that geography can reveal clusters and exceptions, but geography alone does not explain the fiscal choices behind them.
Most observations sit between 1% and 2%, but the tails matter
57 of the 103 observations, or about 55.3%, are between 1% and 2%. About 35.0% are below 1%, while 9.7% are at or above 2%. The mean is only modestly above the median because the handful of values above 3% pull the average upward without dominating the entire distribution.
Differences inside the 1% to 2% band can still be meaningful. A country at 1.8% is devoting a substantially larger share of GDP to primary education than one at 1.0%, even though both may be casually described as being in the same range. This is why the map and the exact table values are more informative than broad labels alone.
What this GDP ratio can and cannot tell you
This indicator is useful for comparing the relative fiscal weight of primary education against national economic output. It can highlight countries that devote an unusually large or small share of GDP to this level of education and can identify places that merit deeper comparison with neighbors.
It cannot tell you how much is spent per student, whether teachers are well paid, whether classrooms are adequately equipped, or whether students achieve stronger learning outcomes. Two countries with the same percentage can have very different absolute spending because their GDP levels and primary-school populations differ. It also excludes spending on secondary and tertiary education, so it should not be read as a complete measure of the education budget.
Because GDP is the denominator, changes in economic output can move the ratio even when the education budget changes little. A one-year ranking should therefore be treated as a snapshot. A trend analysis would require comparable observations across multiple years using the same UIS definition.
Data scope and source
The comparison uses the 2022 national-level observations for UNESCO UIS indicator XGDP.1.FSGOV from the UNESCO Institute for Statistics official API. There are 103 country and territory rows in the supplied 2022 dataset. This is not a complete list of every country in the world, so the mean, median, and ranks refer only to these 103 observations.
Missing countries should not be interpreted as having zero expenditure. They simply do not have a 2022 observation in this comparison. The point map follows that rule by leaving places without an included value unmarked rather than assigning them a zero.
The main takeaway from the map
The 2022 values span from 0.11% to 3.65% of GDP, with a median of 1.22%. The largest group of observations is in the 1% to 2% range, yet the map shows strong local contrasts and several high outliers across different regions. For that reason, the most useful reading is not simply ‘which country ranks first,’ but how each observation compares with nearby countries and with the center of the distribution.
Frequently Asked Questions
What does primary education spending as a share of GDP measure?
It compares government expenditure on primary education with the size of the economy. It is not the same as spending per pupil or a measure of education quality.
Which observations are highest and lowest in 2022?
Among the 103 included observations, Bhutan is highest at 3.65% of GDP and Thailand is lowest at 0.11%.
Do countries missing from the map have zero spending?
No. A missing dot means that a 2022 observation is not included in this comparison; missing values are not converted to zero.
Related Maps
Green Map creates custom-edited map images using open geographic data sources such as geoBoundaries, Natural Earth, OpenStreetMap, and government open data.
These maps are edited visual materials, not raw data files, and are provided for education, documents, presentations, and graphic reference.