Banks earn income from more than lending and interest. Fees and commissions, trading and derivatives gains, securities-related income, and other operating activities can all contribute to revenue. This article uses World Bank Global Financial Development indicator GFDD.EI.03, Bank noninterest income to total income (%), to compare the share of total bank income generated by noninterest activities across countries.
The date attached to each observation is essential. The validated file contains the latest non-null value for 171 countries or areas, but the reference years range from 2002 to 2021. Of those rows, 132 are dated 2021, 16 are from 2020, 12 from 2019, and 11 are older. The map is therefore a latest-available-value map, not a synchronized 2021 ranking of all 171 places.
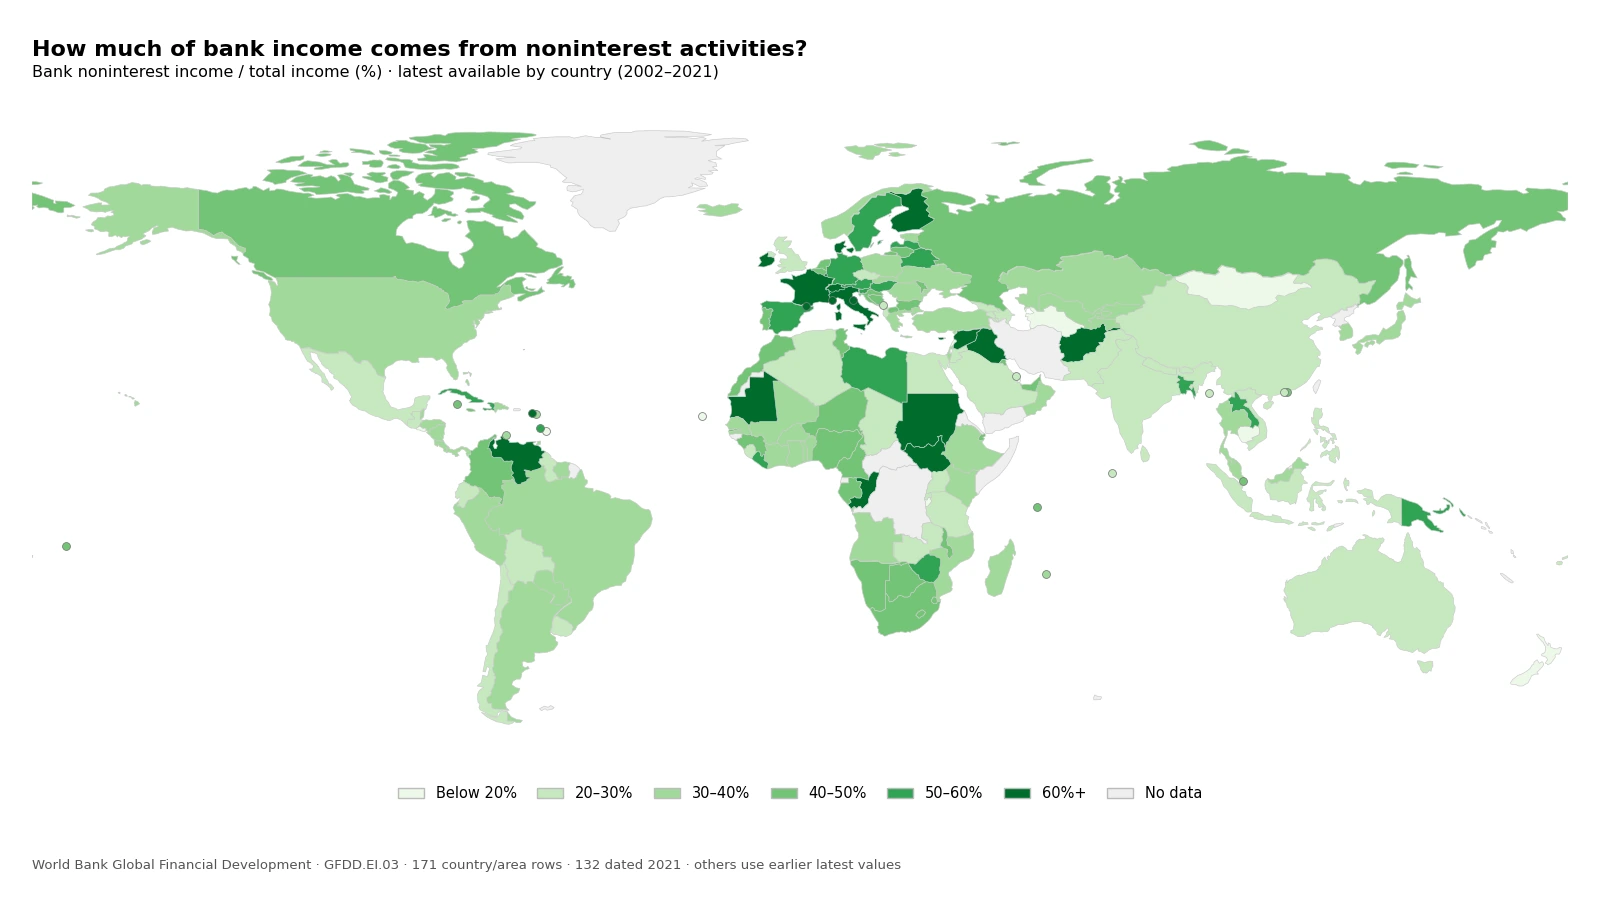
Table of Contents
What counts as noninterest income?
World Bank metadata defines noninterest income as bank income generated by activities that are not interest related. It includes net gains on trading and derivatives, net gains on other securities, net fees and commissions, and other operating income. The denominator is total income, defined for this indicator as net interest income plus noninterest income. A value of 40% therefore means that roughly two-fifths of the measured bank income comes from noninterest activities.
This is not a 40% profit margin. It is also different from return on assets, return on equity, or net interest margin. The World Bank notes that the ratio is calculated only when net interest income is not negative, that the banks used in the calculation may differ across indicators, and that a country-year result is not reported when fewer than three bank-level observations are available.
A higher share is not automatically better
A high noninterest-income share does not by itself prove that a banking system is safer, more efficient, or more profitable. It may reflect a larger contribution from fees and services, securities activities, trading income, or other operating revenue. A lower share can indicate a more interest-centered revenue mix. The supplied CSV does not break the total into those underlying components, so it cannot identify which source drives an individual country’s ratio.
The map is best used to identify differences in bank revenue composition. Questions about resilience, credit quality, customer costs, or profitability require other measures such as capital adequacy, nonperforming loans, cost-to-income ratios, net interest margins, and returns on equity or assets.
The 171 latest values have a 36.1% median, but the years are mixed
If each of the 171 latest observations receives equal weight, the simple median is 36.1% and the simple mean is 39.7%. These figures summarize a mixed-vintage distribution spanning 2002–2021. They should not be described as the global average bank noninterest-income share for 2021 or for the present day.
| Latest-value band | Countries/areas |
|---|---|
| Below 20% | 10 |
| 20–30% | 40 |
| 30–40% | 49 |
| 40–50% | 35 |
| 50–60% | 17 |
| 60% or more | 20 |
The largest band in the mixed-year map is 30–40%, with 49 observations. Another 40 fall between 20% and 30%, and 35 lie between 40% and 50%. There are 20 observations at 60% or above, but some are from 2019 or much earlier. A dark map color should therefore prompt a check of the reference year before it is treated as a current condition.
A same-year 2021 comparison contains 132 observations
Restricting the file to 2021 removes the cross-year mismatch and leaves 132 countries or areas. The simple median is 34.2% and the mean is 38.1%. The middle half of observations lies between roughly 28.0% and 45.2%. For a direct league-table comparison, this 2021 subset is more defensible than ranking all 171 latest observations together.
| 2021 band | Countries/areas |
|---|---|
| Below 20% | 7 |
| 20–30% | 36 |
| 30–40% | 40 |
| 40–50% | 25 |
| 50–60% | 13 |
| 60% or more | 11 |
Highest 2021 noninterest-income shares
| Country/area | Noninterest income / total income |
|---|---|
| Syrian Arab Republic | 91.1% |
| Afghanistan | 79.0% |
| Cyprus | 77.9% |
| Iraq | 74.0% |
| Venezuela, RB | 72.9% |
| Switzerland | 71.0% |
| France | 67.8% |
| Italy | 65.3% |
| Denmark | 63.1% |
| Finland | 62.4% |
Within the synchronized 2021 set, the Syrian Arab Republic records 91.1%, followed by Afghanistan at 79.0%, Cyprus at 77.9%, Iraq at 74.0%, and Venezuela at 72.9%. Switzerland is 71.0%, France 67.8%, and Italy 65.3%. These are revenue-composition ratios, not rankings of banking-sector size or total profit.
Low 2021 values do not mean low profitability
| Country/area | Noninterest income / total income |
|---|---|
| Cambodia | 10.7% |
| Burundi | 17.8% |
| New Zealand | 18.3% |
| El Salvador | 19.2% |
| Mongolia | 19.3% |
| Cabo Verde | 19.4% |
| Qatar | 20.0% |
| Rwanda | 21.3% |
| Egypt, Arab Rep. | 21.8% |
| Philippines | 22.5% |
Cambodia is the lowest 2021 observation at 10.7%, followed by Burundi at 17.8%, New Zealand at 18.3%, El Salvador at 19.2%, and Mongolia at 19.3%. A lower share is not a loss rate or a measure of bad loans. It indicates that net interest income occupies a larger share of the denominator relative to noninterest income.
Europe shows sharp differences between nearby countries
Several 2021 European observations are high: Switzerland is 71.0%, France 67.8%, Italy 65.3%, Spain 57.1%, and Germany 56.2%. The United Kingdom is much lower at 26.5%. That spread shows why a single regional average would hide important differences in bank revenue composition even among geographically close economies.
Major Asian economies cluster in the 20–40% range, with exceptions
In 2021, Korea is 32.3%, Japan 30.7%, China 24.0%, India 27.1%, and Indonesia 26.7%. Singapore is higher at 45.1%, as is the United Arab Emirates at 46.5%. Afghanistan and Iraq sit above 70%, so Asia cannot be summarized as one revenue model.
The Americas also show a broad 2021 spread
Canada records 46.7%, the United States 39.8%, Argentina 38.9%, Brazil 36.2%, and Mexico 27.5%. Differences in banking models, fee structures, market activity, and regulation could matter, but the indicator alone does not establish those causes. Its strongest use is to show where revenue mixes differ and where a country-specific follow-up is worthwhile.
Selected economies and reference years
| Country/area | Year | Noninterest-income share |
|---|---|---|
| United States | 2021 | 39.8% |
| Canada | 2021 | 46.7% |
| Mexico | 2021 | 27.5% |
| Brazil | 2021 | 36.2% |
| Argentina | 2021 | 38.9% |
| United Kingdom | 2021 | 26.5% |
| France | 2021 | 67.8% |
| Germany | 2021 | 56.2% |
| Italy | 2021 | 65.3% |
| Spain | 2021 | 57.1% |
| Switzerland | 2021 | 71.0% |
| China | 2021 | 24.0% |
| Japan | 2021 | 30.7% |
| Korea, Rep. | 2021 | 32.3% |
| India | 2021 | 27.1% |
| Indonesia | 2021 | 26.7% |
| Singapore | 2021 | 45.1% |
| Australia | 2021 | 24.5% |
| South Africa | 2021 | 40.9% |
| Saudi Arabia | 2021 | 25.2% |
| United Arab Emirates | 2021 | 46.5% |
The major economies in this table are all dated 2021, so their values can be compared on a common reference year. The full 171-row map is different: South Sudan is dated 2019, Andorra 2020, Sudan 2012, Ireland 2019, and the Republic of Congo 2011. An older latest value should not be assumed to describe the banking system in 2026.
Source and interpretation limits
The statistical source is World Bank Global Financial Development indicator GFDD.EI.03. World Bank metadata states that the underlying bank-level unconsolidated data come from Bankscope for 2000–2014 and Orbis for 2015–2021. This matters for freshness: the article is a comparison of the latest observations currently contained in this indicator, not a real-time picture of bank revenue structures in 2026.
The official definition and methodological notes are available in the World Bank Global Financial Development metadata. All map classes, tables, year counts, means, and medians in this article were calculated directly from the validated CSV. Missing observations were not converted to zero or replaced with another country’s value.
Frequently Asked Questions
What is included in bank noninterest income?
The World Bank definition includes net gains on trading and derivatives, net gains on other securities, net fees and commissions, and other operating income that is not interest related.
Does a higher noninterest-income share mean a better banking system?
No. The indicator describes the composition of total income, not bank safety or profitability. A high or low value should be interpreted as a difference in revenue mix before any quality judgment is made.
Are all values on the map from 2021?
No. The 171 latest available observations span 2002–2021. There are 132 rows dated 2021, which are analyzed separately for same-year comparisons.
Is this a bank profit-margin indicator?
No. It measures noninterest income as a share of total income. It is different from return on assets, return on equity, net interest margin, or a net profit margin.
Related Articles
- World Bank Global Economic Monitor Guide: Find, Map, and Download GEM Data
- World Bank Data Catalog Licensing Guide – Check Access and Reuse Terms
- Global GDP per Capita Map – Country Levels in 2025
Green Map creates custom-edited map images using open geographic data sources such as geoBoundaries, Natural Earth, OpenStreetMap, and government open data.
These maps are edited visual materials, not raw data files, and are provided for education, documents, presentations, and graphic reference.