World Bank indicator NE.GDI.TOTL.ZS provides a latest non-empty gross-capital-formation share of GDP for 187 countries and territories. 131 observations are from 2025 and 38 from 2024, so most coverage is recent. The unweighted country mean is 23.50% and the median 23.20%. Micronesia has the highest latest observation at 47.79%, but that value is from 1983; Algeria leads the 2025 subset at 45.27%.
Gross capital formation is broader than gross fixed capital formation. The World Bank definition includes acquisitions less disposals of produced assets for fixed capital formation, net changes in inventories, and net acquisitions of valuables. That means factories, machinery, construction, inventory accumulation or drawdown, and some valuable assets can all affect the indicator.
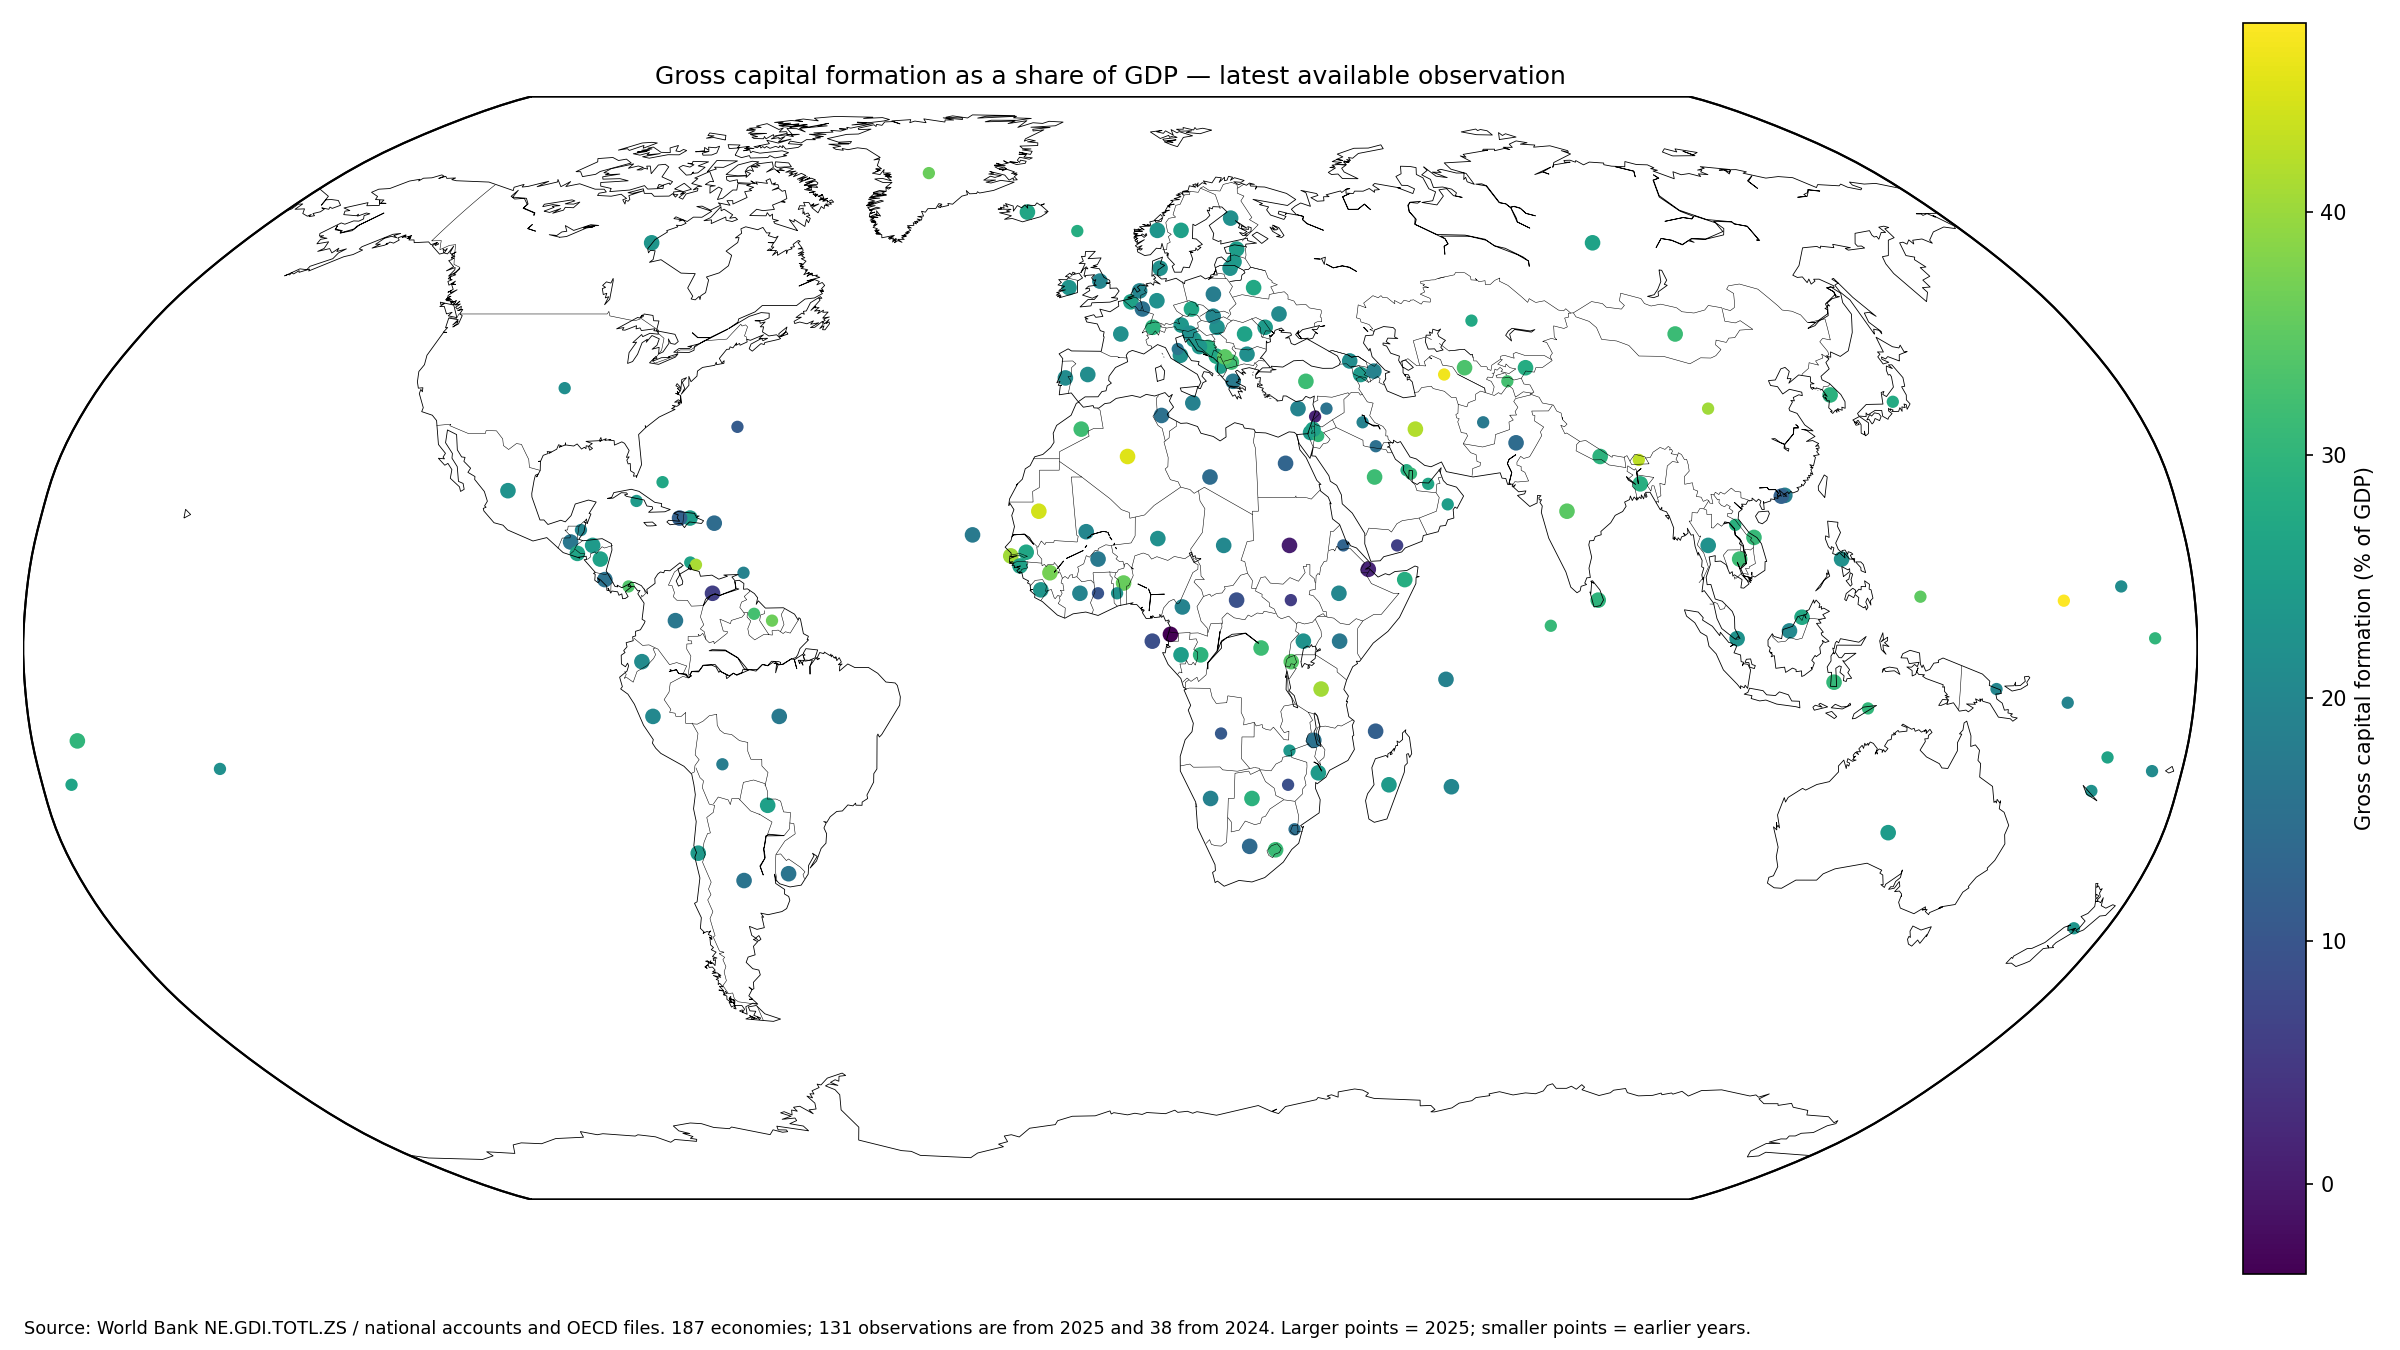
Table of Contents
What gross capital formation includes
World Bank metadata describes gross capital formation as acquisitions less disposals of produced assets for fixed capital, inventories, or valuables. Fixed assets can include land improvements, plant, machinery, equipment, transport infrastructure, schools, offices, hospitals, homes, and commercial or industrial buildings.
The World Bank metadata glossary also explains that inventories include goods held to absorb temporary changes in production or sales and work in progress. The World Bank API provides the latest country observations.
Gross capital formation is not the same as gross fixed capital formation
Gross fixed capital formation focuses on fixed assets. Gross capital formation adds inventory changes and valuables, so the two measures can diverge even within the same economy and year.
A company may keep fixed investment steady while running down inventories sharply, lowering gross capital formation. Conversely, a large inventory build can raise gross capital formation without representing the same kind of long-lived productive investment as a new factory or machine.
The full latest-value ranking mixes old and recent observations
Micronesia records 47.79%, Turkmenistan 46.60%, Algeria 45.27%, Mauritania 44.33%, Bhutan 42.60%, Iran 41.77%, and Curacao 41.07%.
The observation years differ substantially: Micronesia is 1983, Turkmenistan 2009, and Curacao 2018, while Algeria, Mauritania, and Iran are 2025 and Bhutan is 2024. The full 187-economy table is therefore not a synchronized current ranking.
| Rank | Country or territory | Observation year | Gross capital formation / GDP |
|---|---|---|---|
| 1 | Micronesia, Fed. Sts. | 1983 | 47.79% |
| 2 | Turkmenistan | 2009 | 46.60% |
| 3 | Algeria | 2025 | 45.27% |
| 4 | Mauritania | 2025 | 44.33% |
| 5 | Bhutan | 2024 | 42.60% |
| 6 | Iran, Islamic Rep. | 2025 | 41.77% |
| 7 | Curacao | 2018 | 41.07% |
| 8 | Tanzania | 2025 | 40.68% |
| 9 | China | 2024 | 40.48% |
| 10 | Gambia, The | 2025 | 40.39% |
| 11 | Guinea | 2025 | 37.00% |
| 12 | Suriname | 2010 | 36.20% |
| 13 | Greenland | 2023 | 36.00% |
| 14 | Benin | 2025 | 35.83% |
| 15 | Palau | 2024 | 34.97% |
The 2025 same-year subset covers 131 economies
Restricting the data to 2025 leaves 131 economies. Algeria leads at 45.27%, followed by Mauritania at 44.33%, Iran at 41.77%, Tanzania at 40.68%, and The Gambia at 40.39%.
| 2025 rank | Country or territory | Gross capital formation / GDP |
|---|---|---|
| 1 | Algeria | 45.27% |
| 2 | Mauritania | 44.33% |
| 3 | Iran, Islamic Rep. | 41.77% |
| 4 | Tanzania | 40.68% |
| 5 | Gambia, The | 40.39% |
| 6 | Guinea | 37.00% |
| 7 | Benin | 35.83% |
| 8 | India | 34.60% |
| 9 | Kosovo | 34.60% |
| 10 | Rwanda | 34.13% |
| 11 | Uzbekistan | 33.28% |
| 12 | Morocco | 31.87% |
| 13 | North Macedonia | 31.72% |
| 14 | Turkiye | 31.67% |
| 15 | Congo, Dem. Rep. | 31.65% |
The 2025 subset has an unweighted mean of 23.17% and a median of 22.93%. Its first quartile is 19.07% and third quartile 27.12%. 5 economies are at 40% or more, and 70 lie between 20% and under 30%.
The overall median is about 23.20%
Across the 187 latest observations, the median is 23.20%, the first quartile 18.94%, and the third quartile 28.45%. 11 observations are below 10%, 46 are from 10% to under 20%, 93 from 20% to under 30%, 27 from 30% to under 40%, and 10 are at least 40%.
The mean of 23.50% is close to the median. The largest group lies in the 20–30% range, indicating that gross capital formation around one-fifth to one-third of GDP is common among the reported economies.
Why can gross capital formation be negative?
There is 1 negative latest observation: Equatorial Guinea at -3.68% in 2025. Because the measure includes net inventory changes and acquisitions less disposals, a sufficiently large inventory drawdown or asset disposal can pull total gross capital formation below zero.
A negative value does not mean there was literally no fixed investment. Fixed-asset investment can remain positive while inventory reductions or disposals are large enough to make the broader total negative.
| Low-end rank | Country or territory | Observation year | Gross capital formation / GDP |
|---|---|---|---|
| 1 | Equatorial Guinea | 2025 | -3.68% |
| 2 | Sudan | 2025 | 0.73% |
| 3 | Lebanon | 2024 | 1.44% |
| 4 | Djibouti | 2025 | 1.55% |
| 5 | South Sudan | 2015 | 5.75% |
| 6 | Venezuela, RB | 2025 | 5.93% |
| 7 | Yemen, Rep. | 2018 | 6.18% |
| 8 | Sao Tome and Principe | 2025 | 8.74% |
| 9 | Zimbabwe | 2024 | 8.85% |
| 10 | Central African Republic | 2025 | 9.30% |
| 11 | Ghana | 2024 | 9.90% |
| 12 | Angola | 2024 | 10.64% |
| 13 | Bermuda | 2024 | 11.04% |
| 14 | Comoros | 2025 | 11.85% |
| 15 | Haiti | 2025 | 12.06% |
A share of GDP is not an absolute investment amount
The same monetary amount of capital formation produces a higher percentage in a smaller-GDP economy and a lower percentage in a larger-GDP economy. A 40% share therefore does not necessarily represent more dollars of investment than a 20% share elsewhere.
Absolute investment values require a monetary series. The GDP share is designed to compare capital formation relative to the size of each economy.
A high share is not automatically a sign of efficient investment
High gross capital formation can be associated with infrastructure expansion and productive investment, but it can also reflect inventory accumulation or temporary project cycles. The ratio alone does not measure return on capital, project quality, or future growth.
Assessing investment quality requires information on productivity, financing, sector allocation, project performance, and the public-private composition of investment.
A low share does not automatically mean underinvestment
A low ratio can reflect weak fixed investment, but it can also result from inventory drawdowns or temporary adjustment. Economies with mature capital stocks may have different investment needs from rapidly urbanizing or infrastructure-building economies.
Long-run series, gross fixed capital formation, productivity, population growth, and sector structure are needed before labeling a country’s investment rate inadequate.
The measure spans private and public investment activity
National-accounts gross capital formation is not limited to business investment. It can include fixed-asset acquisitions and inventory changes across the economy, including government and other institutional sectors.
A private gross-fixed-capital-formation series answers a narrower question. Comparing the two helps separate economy-wide capital formation from specifically private fixed investment.
The 2025 leaders are spread across several regions
High 2025 observations appear in North Africa, West Africa, parts of Central Asia, South Asia, and other regions rather than forming one single continent-wide block. Algeria, Mauritania, Iran, Tanzania, The Gambia, Guinea, Benin, and India all appear near the upper end.
The dataset does not identify which component—fixed assets, inventories, or valuables—drives each country’s high share. The spatial pattern should therefore be described without assigning a single cause.
Most observations are recent, but some latest values are old
169 of the 187 observations are from 2024–2025. 18 are from 2023 or earlier, and the oldest latest observation is Micronesia in 1983. Turkmenistan 2009, Suriname 2010, and Eritrea 2011 are other examples of old latest values.
For current-period comparisons, the 2025 subset is cleaner. The full latest-value map is useful for broad coverage only when the observation year remains visible.
The country mean is not a GDP-weighted world investment ratio
The 23.50% simple mean gives every one of the 187 economies equal weight. A very large economy and a small economy each count once. It is not equivalent to total world gross capital formation divided by world GDP.
A global weighted ratio would require aggregating capital-formation amounts and GDP or using GDP weights. The mean and median here summarize country ratios only.
Source and calculation notes
The source is World Bank World Development Indicators series NE.GDI.TOTL.ZS, using national official statistics, national accounts, OECD files, and World Bank estimates. The analysis uses the latest non-empty observation for 187 economies and separately examines the 131 observations from 2025. The official World Bank API provides the series.
All 187 reported country codes are joined to geographic centroids for the map, producing a 100% match. Larger points mark 2025 observations and smaller points earlier years. Missing economies are not converted to zero.
Frequently Asked Questions
Is gross capital formation the same as gross fixed capital formation?
No. Gross capital formation also includes net inventory changes and net acquisitions of valuables.
Can gross capital formation be negative?
Yes. Large inventory drawdowns or disposals can outweigh other capital formation and push the total below zero.
Are all 187 observations from 2025?
No. 131 are from 2025, 38 from 2024, and a small number are older latest observations.
Related Articles
Green Map creates custom-edited map images using open geographic data sources such as geoBoundaries, Natural Earth, OpenStreetMap, and government open data. These maps are edited visual materials, not raw data files, and are provided for education, documents, presentations, and graphic reference.