A country can report a growing number of businesses using artificial intelligence while still having relatively few firms that use AI in more than one way. Eurostat’s 2025 measure for enterprises using at least two AI technologies adds that extra layer. It covers enterprises with 10 or more persons employed and records the share that use two or more of the AI technologies listed in the survey. That makes it a useful indicator of breadth of adoption rather than a simple yes-or-no measure of whether a business uses any AI at all.
The 2025 dataset contains 31 European countries. Denmark had the highest recorded share at 32.48%, followed by Finland at 30.16% and Sweden at 25.02%. At the other end, Poland stood at 4.28% and Romania at 4.41%. The gap between the highest and lowest observations was 28.20 percentage points, and Denmark’s rate was about 7.6 times Poland’s. The cross-country spread is therefore substantial even though the observations come from the same year and the same statistical framework.
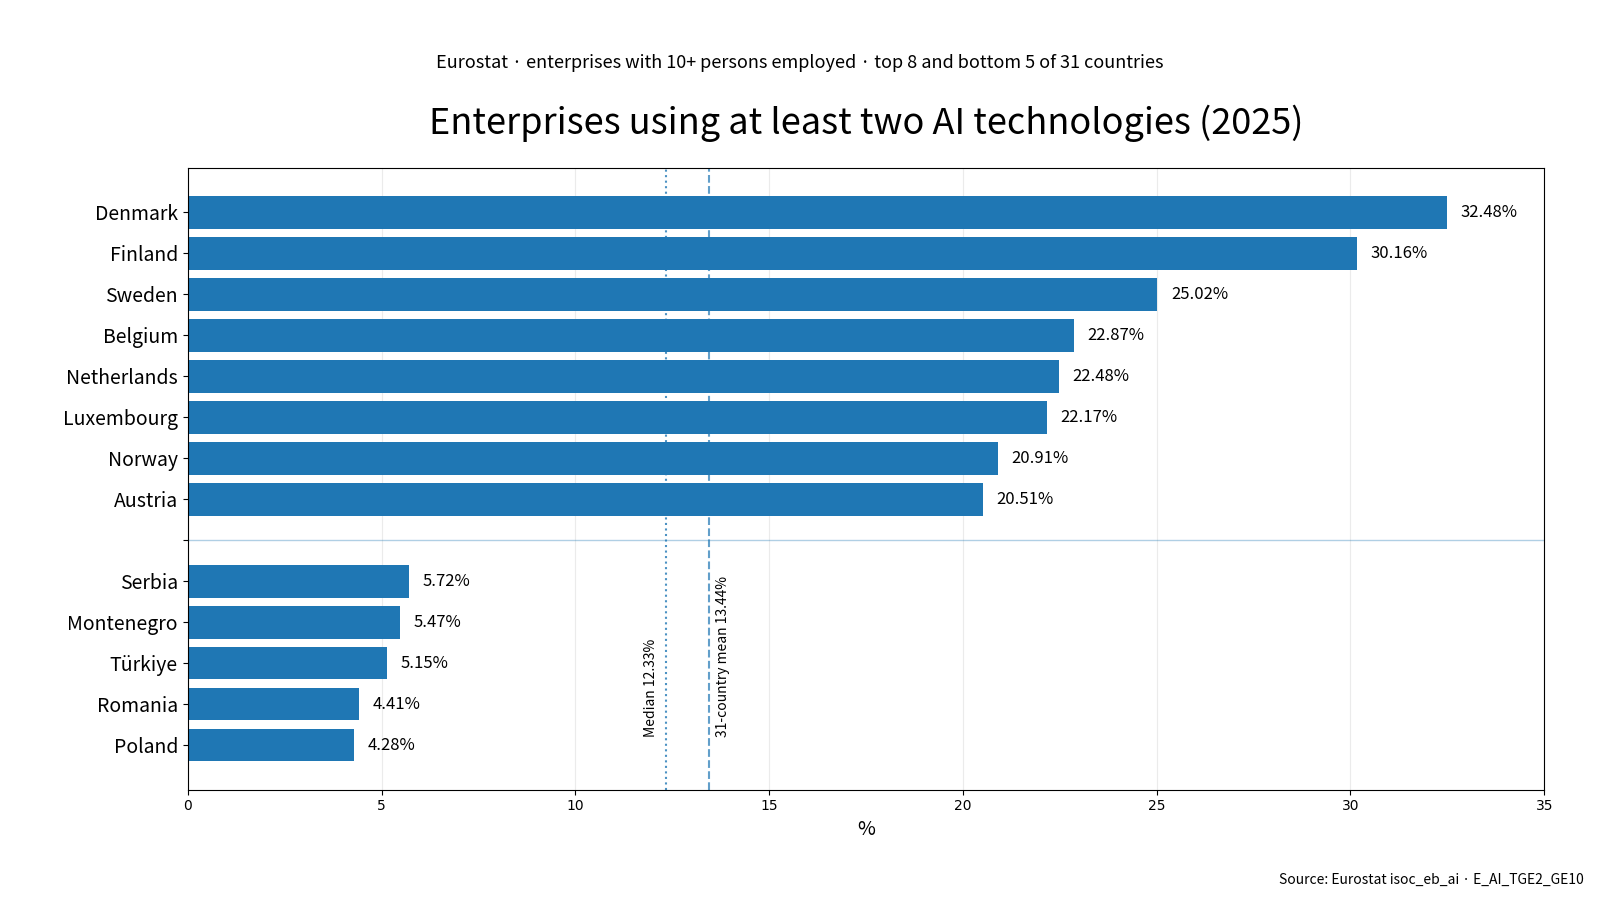
Table of Contents
The 2025 distribution has a clear upper group and a broad middle
Across the 31 countries, the simple average was about 13.44% and the median was 12.33%. The median country was Slovakia, which reported 12.33%. Several countries clustered very close to that point: Czechia was at 12.40%, Slovenia at 12.46%, Malta at 12.84%, and Estonia at 12.86%. Because Denmark and Finland were above 30%, the mean sat somewhat above the median. This is a useful reminder that one or two high observations can lift an average even when most countries are well below those values.
Eight countries reached 20% or more, twelve were between 10% and 20%, and eleven were below 10%. Most observations therefore fell below one fifth of enterprises, but the upper group was distinct. That pattern is more informative than a simple ranking because it shows how the countries are distributed across broad adoption bands.
Denmark and Finland were the only countries above 30%
Denmark led the dataset with 32.48%, while Finland reached 30.16%. Sweden followed at 25.02%. A second group sat in the low twenties: Belgium at 22.87%, the Netherlands at 22.48%, Luxembourg at 22.17%, Norway at 20.91%, and Austria at 20.51%. Taken together, these eight countries formed the entire set above the 20% line.
The average for the top three countries was 29.22%. That statistic summarizes the upper end, but it does not explain why these countries recorded higher shares. The dataset does not directly measure policy quality, investment intensity, worker skills, digital infrastructure, or sector composition as causes. It is safest to describe the observed difference first and use separate evidence for any explanation of the mechanisms behind it.
A dense group appears around 10% to 16%
Germany recorded 16.19% and Lithuania 14.18%, followed by Spain at 13.64%. Estonia, Malta, Slovenia, Czechia, and Slovakia were all between 12.33% and 12.86%. Ireland stood at 11.48%, France at 10.70%, Italy at 10.55%, and Croatia at 10.46%. Within this middle group, the ranking can exaggerate small numerical differences. Estonia and Malta, for example, were separated by only 0.02 percentage points.
This concentration matters for interpretation. Countries that are several places apart in a ranked list can still have nearly identical reported shares. When differences are measured in hundredths or tenths of a percentage point, it is more useful to recognize a cluster than to treat each rank as a sharply distinct level of adoption.
Eleven countries were below 10%
Latvia reported 9.04%, Bosnia and Herzegovina 8.09%, Portugal 8.04%, Hungary 7.03%, and Cyprus 6.73%. Bulgaria, Serbia, Montenegro, and Türkiye were all between 5% and 6%, while Romania and Poland were below 4.5%. The bottom three countries averaged about 4.61%, compared with 29.22% for the top three.
A low value on this indicator does not mean that enterprises in the country do not use AI. The threshold is specifically two or more listed AI technologies. A firm using only one technology is outside this measure even though it is still an AI-using enterprise. This distinction is essential when comparing the result with broader statistics on any AI use.
Country ranking for enterprises using at least two AI technologies
The table below lists all 31 observations from highest to lowest. Each percentage represents the share of enterprises with at least 10 persons employed that used at least two AI technologies under the Eurostat survey definition in 2025.
| Rank | Country | Share |
|---|---|---|
| 1 | Denmark | 32.48% |
| 2 | Finland | 30.16% |
| 3 | Sweden | 25.02% |
| 4 | Belgium | 22.87% |
| 5 | Netherlands | 22.48% |
| 6 | Luxembourg | 22.17% |
| 7 | Norway | 20.91% |
| 8 | Austria | 20.51% |
| 9 | Germany | 16.19% |
| 10 | Lithuania | 14.18% |
| 11 | Spain | 13.64% |
| 12 | Estonia | 12.86% |
| 13 | Malta | 12.84% |
| 14 | Slovenia | 12.46% |
| 15 | Czechia | 12.40% |
| 16 | Slovakia | 12.33% |
| 17 | Ireland | 11.48% |
| 18 | France | 10.70% |
| 19 | Italy | 10.55% |
| 20 | Croatia | 10.46% |
| 21 | Latvia | 9.04% |
| 22 | Bosnia and Herzegovina | 8.09% |
| 23 | Portugal | 8.04% |
| 24 | Hungary | 7.03% |
| 25 | Cyprus | 6.73% |
| 26 | Bulgaria | 5.97% |
| 27 | Serbia | 5.72% |
| 28 | Montenegro | 5.47% |
| 29 | Türkiye | 5.15% |
| 30 | Romania | 4.41% |
| 31 | Poland | 4.28% |
What this indicator captures
The indicator is best understood as a measure of multi-technology adoption. It asks whether enterprises have moved beyond a single AI capability and are using at least two listed technologies. That can reflect a broader operational footprint of AI, but the percentage alone does not reveal whether the technologies are integrated into core workflows, used occasionally, or concentrated in a particular department.
It is also a percentage of enterprises, not a count of firms and not a measure of spending. A smaller country can have a high percentage without having more AI-using firms in absolute terms than a much larger country. Likewise, the data do not measure the value created by AI, the productivity effect, or the quality of deployment.
Why the difference between one AI technology and two matters
Measures of “any AI use” answer whether at least one qualifying AI technology is present. A two-or-more measure asks a stricter question. It can separate initial adoption from a broader technology mix. For readers following enterprise digitalization, this helps distinguish experimentation with one tool from the presence of multiple AI capabilities, although it still does not show how advanced or effective those capabilities are.
The threshold also means that comparisons with other AI statistics require care. A country may rank differently on any-AI-use, generative-AI-use, data-analytics, speech-recognition, or machine-learning measures. These indicators describe related but different behaviors. Combining them without checking definitions can create misleading conclusions.
How to read the 2025 cross-country pattern
Three practical points stand out. First, only two countries exceeded 30%, so very broad multi-technology use was not the norm across the observed set. Second, the median of 12.33% shows that half of the countries were at or below roughly one enterprise in eight. Third, the 28.20-point spread between Denmark and Poland is large enough that country context clearly matters, even though this single dataset cannot establish which contextual factors are responsible.
Regional proximity may look suggestive because Denmark, Finland, Sweden, and Norway all appear in the upper group. However, the data should not be used to infer a geographic cause by themselves. Belgium, the Netherlands, Luxembourg, and Austria also exceeded 20%, while other nearby countries recorded much lower values. The pattern is descriptive, not causal.
Limits to keep in mind
The observations refer to 2025 and should not be treated as a time trend. To say that adoption accelerated or slowed, comparable values from earlier years would be required. The table also does not identify which combinations of AI technologies enterprises used. A business using speech recognition plus data analytics is counted under the same threshold as one using different qualifying technologies.
The enterprise-size threshold matters as well. The measure covers firms with 10 or more persons employed under the specified industry scope. It should not be generalized to every microbusiness or self-employed activity. For cross-country comparisons, the strength of the dataset is the common statistical definition; for interpretation, the limitation is that a single aggregate percentage cannot describe all dimensions of AI adoption.
Key takeaways from the 31-country dataset
- The 31-country mean was about 13.44%, while the median was 12.33%.
- Denmark at 32.48% and Finland at 30.16% were the only observations above 30%.
- Eight countries were at 20% or higher, while eleven were below 10%.
- The highest-to-lowest gap was 28.20 percentage points.
- The indicator is stricter than any-AI-use because an enterprise must use at least two listed AI technologies.
Source and statistical definition
Source: Eurostat 2025 enterprise ICT-use statistics, indicator for enterprises using at least two AI technologies. Eurostat isoc_eb_ai.
Frequently Asked Questions
Which country had the highest share of enterprises using at least two AI technologies in 2025?
Denmark was highest at 32.48%, followed by Finland at 30.16% and Sweden at 25.02% among the 31 countries in the dataset.
What was the median across the 31 countries?
The median was 12.33%, while the simple average was about 13.44%.
Does this measure include every enterprise that uses AI?
No. It counts enterprises with 10 or more persons employed that use at least two listed AI technologies. Firms using only one qualifying AI technology are not included in this specific percentage.
Related Articles
Source: Eurostat 2025 enterprise ICT-use statistics, indicator for enterprises using at least two AI technologies. Eurostat isoc_eb_ai.
Green Map creates custom-edited map images using open geographic data sources such as geoBoundaries, Natural Earth, OpenStreetMap, and government open data. These maps are edited visual materials, not raw data files, and are provided for education, documents, presentations, and graphic reference.