Gross national expenditure can be larger or smaller than GDP even though both are measured within the same national accounts framework. The World Bank indicator Gross national expenditure (% of GDP), code NE.DAB.TOTL.ZS, adds household final consumption expenditure, general government final consumption expenditure, and gross capital formation, then expresses that total as a percentage of GDP. The ratio is therefore not a simple measure of how much households spend. It reflects the relationship between domestic final expenditure, domestic production, and the external balance.
The World Bank extract contains one latest available observation for 186 economies, but the observation year is not uniform. Of those 186 records, 131 are dated 2025, 38 are from 2024, four are from 2023, and 13 have 2022-or-earlier latest values. Mixing all 186 observations into a single “2025 ranking” would compare different periods. For that reason, the map, distribution statistics, and rankings below use only the 131 economies with a 2025 observation. Older latest-available values are discussed separately as a data-freshness issue.
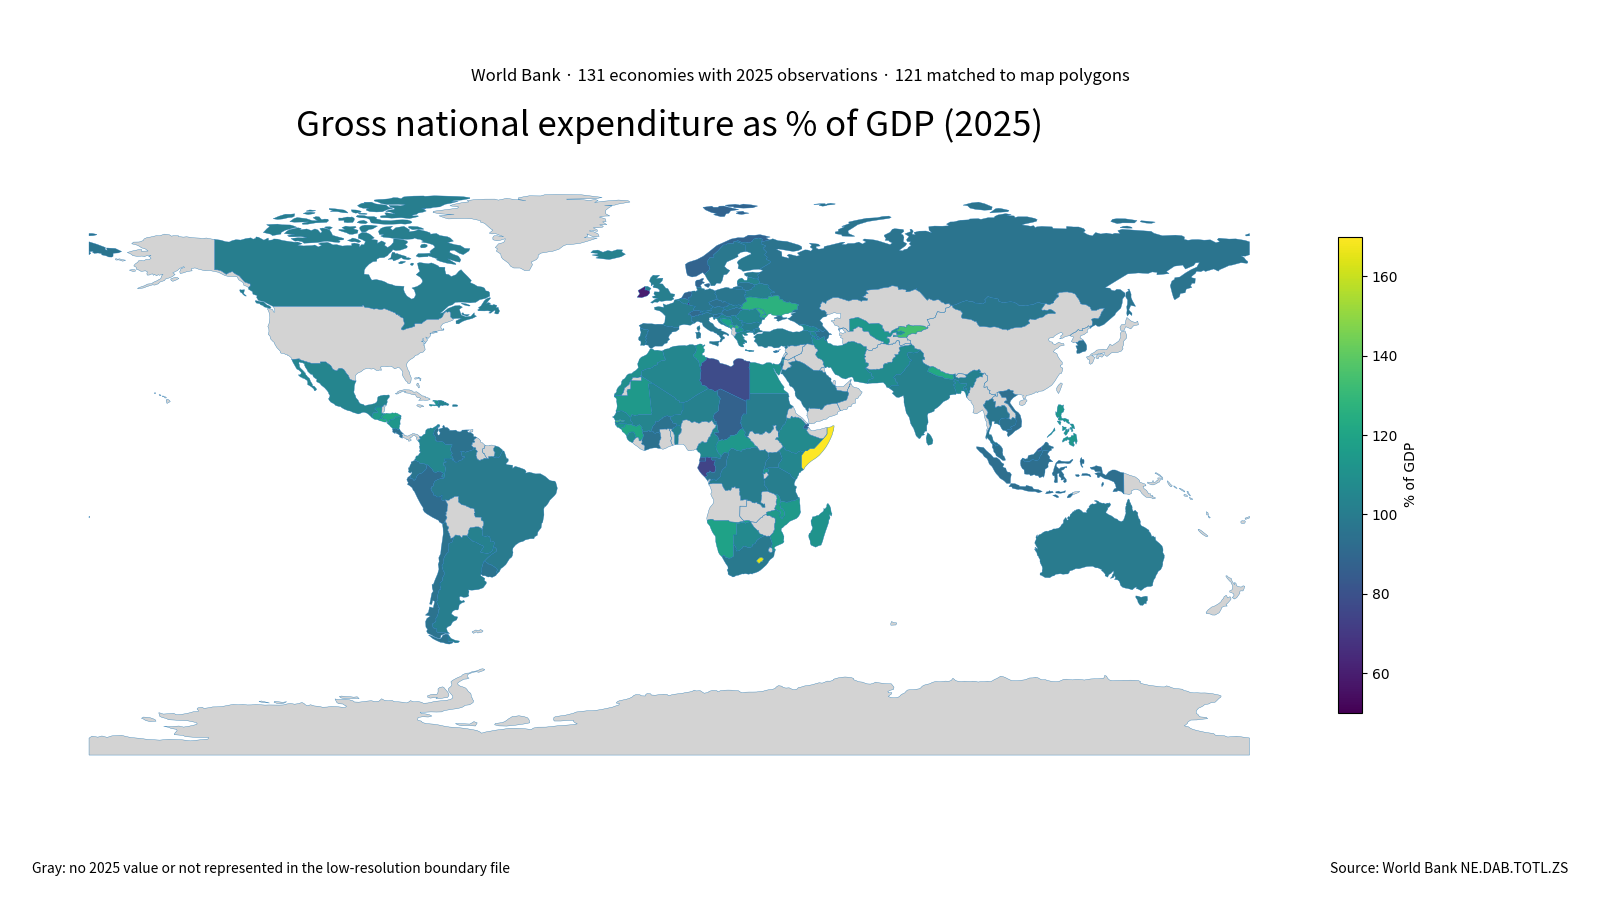
Table of Contents
The 2025 median was 101.6% of GDP
Across the 131 economies with 2025 data, the simple average was 103.49% and the median was 101.60%. The first quartile was 96.00% and the third quartile was 111.63%, so the middle half of observations fell within a band of roughly 96% to 111.6% of GDP. A total of 82 economies were between 90% and 110%. This concentration around 100% is useful context before focusing on the much larger values at the top or the low values at the bottom.
There were 77 economies above 100% and 54 below 100%. A value above 100% means the sum of household consumption, government consumption, and gross capital formation exceeded GDP in that year. Under the expenditure identity, GDP equals domestic expenditure plus exports minus imports. In the simplified accounting relationship, a ratio above 100% is therefore associated with negative net exports, while a ratio below 100% is associated with positive net exports. The indicator should not be interpreted as a score where one side of 100% is automatically better.
Somalia and Lesotho were above 160% in 2025
The highest 2025 observation was Somalia at 169.57%, followed by Lesotho at 164.43%. The Gambia recorded 136.71%, the Kyrgyz Republic 133.51%, and the West Bank and Gaza 133.25%. Kosovo, Moldova, Ukraine, and Montenegro were also above 125%. These figures do not rank countries by economic size, prosperity, or consumption alone; they compare domestic final expenditure with the value of domestic production.
The upper end is geographically dispersed. High 2025 ratios appear in parts of Sub-Saharan Africa, Central Asia, Eastern Europe and the Balkans, and Central America. That spread matters because it cautions against assuming that one regional factor explains every high ratio. Two economies can have similar gross national expenditure shares for very different combinations of household consumption, public consumption, investment, imports, and exports. The map identifies where the ratios are high; it does not establish a causal mechanism.
The lowest ratios were also spread across different regions
Macao SAR, China had the lowest 2025 value at 54.57%. Ireland was at 59.39%, Singapore at 63.83%, and Luxembourg at 68.84%. Gabon and Libya were also below 80%. The gap between the maximum and minimum 2025 observations was 115.00 percentage points, illustrating how far the ratio can move away from 100% in either direction.
A low ratio is not evidence that households are necessarily spending little or that government is pursuing austerity. It means that domestic final expenditure is small relative to GDP, which in the accounting identity is consistent with a larger positive net-export contribution. Economies with substantial cross-border trade or multinational activity can have GDP structures that make this ratio especially different from household experience. The indicator should therefore not be used as a direct proxy for living standards, disposable income, or fiscal policy.
The map does not form one simple continental pattern
Values above 110% appear in several separated areas, including parts of Africa, Eastern and Southeastern Europe, Central Asia, and Central America. Values below 90% also appear in widely separated places, including parts of Western Europe, Southeast Asia, and North Africa. Unlike a physical variable such as temperature, gross national expenditure as a share of GDP is shaped by national accounting components and cross-border flows, so neighboring countries do not have to show similar values.
For example, Denmark was at 88.99% and the Netherlands at 88.78% in 2025, while a number of nearby European economies were above 100%. Montenegro stood at 125.65%, but neighboring countries were spread across different parts of the distribution. These contrasts are useful starting points for further analysis, but explaining them requires separate data on exports, imports, household consumption, government consumption, and investment rather than inference from the ratio alone.
Selected highest and lowest 2025 observations
The table below keeps the period constant by showing only 2025 observations. It lists the 12 highest and 12 lowest values. A value above or below 100% should not be read as a positive or negative performance grade.
| Economy | Share of GDP | Year |
|---|---|---|
| Somalia, Fed. Rep. | 169.57% | 2025 |
| Lesotho | 164.43% | 2025 |
| Gambia, The | 136.71% | 2025 |
| Kyrgyz Republic | 133.51% | 2025 |
| West Bank and Gaza | 133.25% | 2025 |
| Kosovo | 130.29% | 2025 |
| Moldova | 129.16% | 2025 |
| Ukraine | 126.51% | 2025 |
| Montenegro | 125.65% | 2025 |
| El Salvador | 124.06% | 2025 |
| Nepal | 122.51% | 2025 |
| Comoros | 122.29% | 2025 |
| Macao SAR, China | 54.57% | 2025 |
| Ireland | 59.39% | 2025 |
| Singapore | 63.83% | 2025 |
| Luxembourg | 68.84% | 2025 |
| Gabon | 73.91% | 2025 |
| Libya | 77.48% | 2025 |
| Brunei Darussalam | 80.25% | 2025 |
| Malta | 80.80% | 2025 |
| Equatorial Guinea | 81.89% | 2025 |
| Djibouti | 85.31% | 2025 |
| Chad | 87.30% | 2025 |
| Norway | 88.31% | 2025 |
Why can gross national expenditure exceed 100% of GDP?
Gross national expenditure is household final consumption plus general government final consumption plus gross capital formation. In the expenditure approach, GDP adds net exports to those domestic expenditure components. If imports exceed exports, domestic expenditure can be larger than GDP, producing a ratio above 100%. If exports exceed imports, gross national expenditure can be below GDP. This is an accounting relationship, not a behavioral judgment about whether a country is “overspending” or “underspending.”
A country can, for example, import capital equipment during an investment-heavy period and record a high expenditure share without that number saying whether the investment will be productive. Another economy with a large export sector can show a low expenditure share even when household consumption is high in absolute terms. To understand the composition, the ratio needs to be paired with its underlying components or with external-balance indicators.
Why the 186 latest values should not be ranked as if they were all from 2025
The source request uses the most recent non-empty observation available for each economy. That is valuable for coverage, but it creates a mixed-year dataset. Most observations are recent, yet a small number of economies have latest values many years older than 2025. Ranking those historical values beside 2025 observations would create a precise-looking table with inconsistent time references. The problem is not the validity of the older observations; it is the comparability of the period.
This article therefore separates two questions. For the cross-country map and ranking, it asks what the ratio was in 2025 and uses 131 economies with that year. For data availability, it asks how recent the latest observation is across the full 186-economy extract. An economy shown as no data on the 2025 map does not have a value of zero. It either lacks a 2025 observation or, in a small number of cases, is not represented by a separate polygon in the low-resolution world boundary used for the static map.
Data freshness across the 186 latest observations
| Latest observation year | Economies |
|---|---|
| 2025 | 131 |
| 2024 | 38 |
| 2023 | 4 |
| 2022 or earlier | 13 |
About seven in ten of the latest observations are from 2025, and roughly one in five are from 2024. This is enough to provide broad global coverage, but it is not enough to label all 186 records as a single-year 2025 dataset. Separating the same-year comparison from the latest-available coverage preserves the meaning of the time dimension and makes later updates easier to interpret when additional countries publish 2025 values.
Map coverage and boundary matching
Of the 131 economies with a 2025 value, 121 could be matched directly to polygons in the low-resolution world boundary file, a match rate of about 92.4%. Ten small islands or territories—Comoros, Cabo Verde, Hong Kong SAR, Macao SAR, Malta, Mauritius, Singapore, São Tomé and Príncipe, Seychelles, and Samoa—are not represented as separate polygons in that boundary file. Their observations remain in all numerical statistics and tables; only the static polygon map cannot color them.
Gray areas should therefore not be interpreted as zero. They indicate either no 2025 observation or a boundary representation gap. The map uses the actual 2025 range and leaves missing values unfilled rather than substituting zeros. This distinction is important because zero would have a strong economic meaning that is not present in the source data.
Five numbers that summarize the 2025 distribution
- 131 economies had a 2025 observation; the mean was 103.49% and the median was 101.60%.
- 77 economies were above 100%, while 54 were below 100%.
- The highest 2025 value was Somalia at 169.57%; the lowest was Macao SAR, China at 54.57%.
- The middle 50% of observations ranged from about 96.00% to 111.63%.
- The 186 latest available values were not mixed into the 2025 ranking because their observation years differ.
Source and indicator definition
The analysis uses the official World Bank NE.DAB.TOTL.ZS indicator and the country codes supplied with the observations. The indicator is defined as household final consumption expenditure plus general government final consumption expenditure plus gross capital formation, expressed as a percentage of GDP. All summary statistics and the 2025 map were calculated directly from the supplied observations.
Frequently Asked Questions
Which economy had the highest gross national expenditure as a share of GDP in 2025?
Among the 131 economies with 2025 observations, Somalia was highest at 169.57%, followed by Lesotho at 164.43%.
What does a gross national expenditure ratio above 100% of GDP mean?
It means household consumption, government consumption, and gross capital formation together exceeded GDP. In the expenditure identity this is associated with negative net exports, but the indicator alone does not identify which component caused the result.
Why are only 131 economies used in the 2025 comparison when the source contains 186 records?
The 186 records are latest-available observations with mixed years. Only 131 are dated 2025, so the same-year map and ranking use those 131 and treat older observations separately as a freshness issue.
Related Articles
Green Map creates custom-edited map images using open geographic data sources such as geoBoundaries, Natural Earth, OpenStreetMap, and government open data. These maps are edited visual materials, not raw data files, and are provided for education, documents, presentations, and graphic reference.