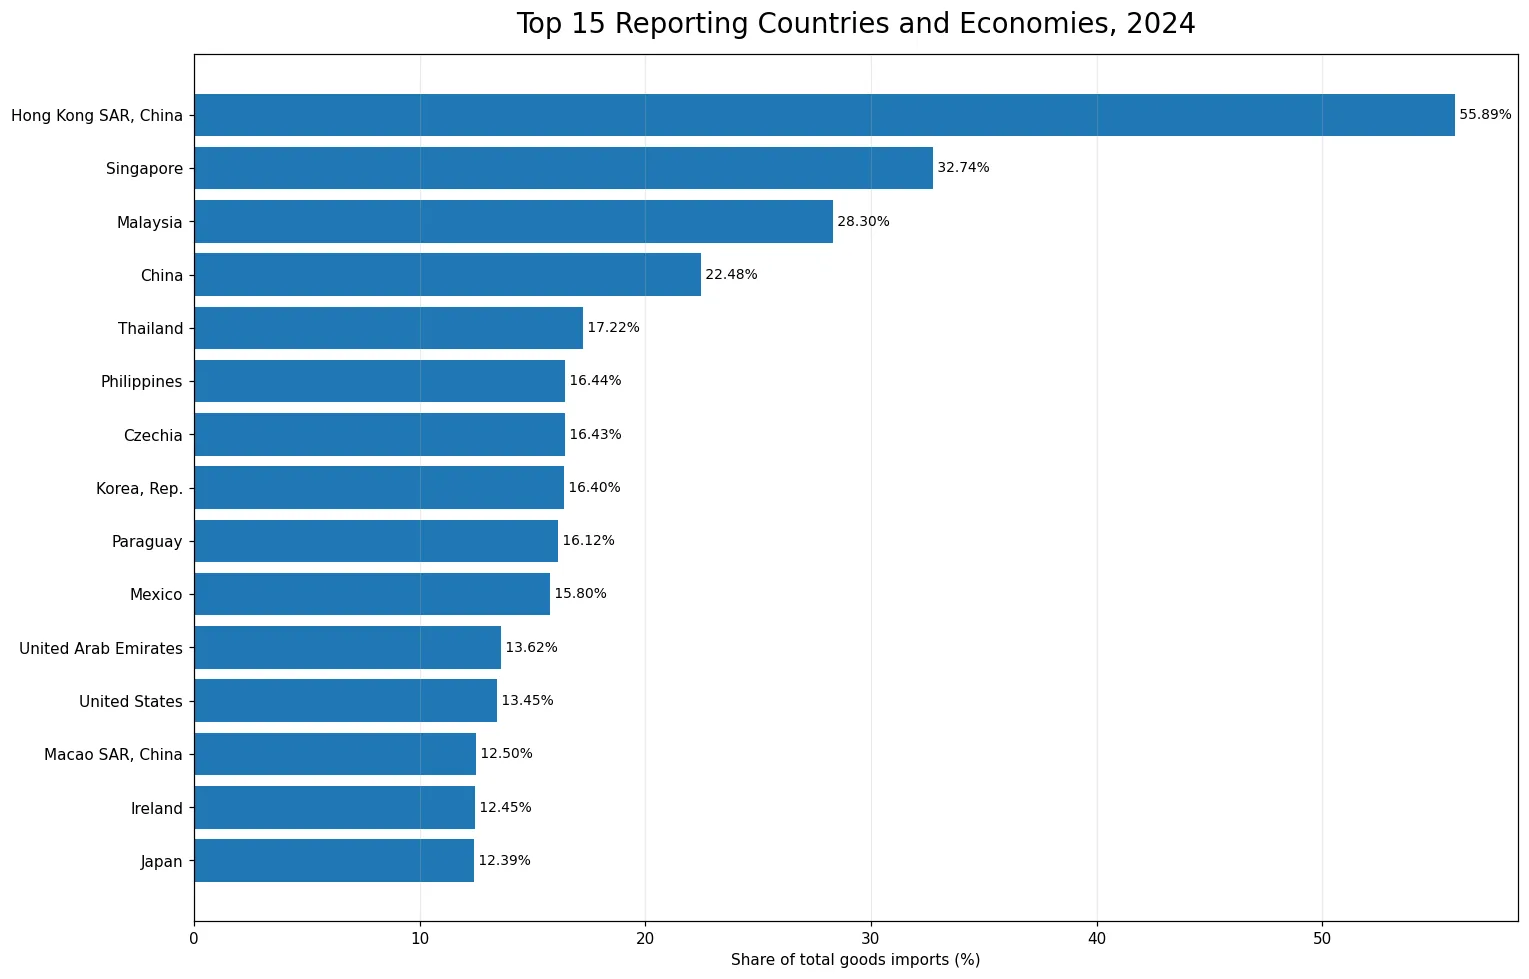
In 2024, the World Bank’s ICT goods import indicator shows a very uneven distribution across reporting countries and economies. Hong Kong SAR, China recorded 55.89% of total goods imports, followed by Singapore at 32.74%, Malaysia at 28.30%, and China at 22.48%. The metric does not measure the absolute value of ICT imports. It measures the share of all merchandise imports classified as ICT goods, so a high percentage does not automatically mean that an economy imported the largest dollar amount of ICT products. The source file contains 217 country/economy rows, but only 122 have a 2024 value. The remaining 95 rows are source-missing observations and are not converted to zero.
The World Bank indicator code is TM.VAL.ICTG.ZS.UN and the unit is percent. ICT goods include computers and peripheral equipment, communication equipment, consumer electronic equipment, electronic components, and other miscellaneous information-technology goods. Because the denominator is total goods imports, the indicator describes import composition. It does not include services imports, measure internet access, rank semiconductor production, or show the size of an economy’s digital sector. Two economies can have the same percentage while importing very different dollar amounts if the size of their overall merchandise-import bill differs.
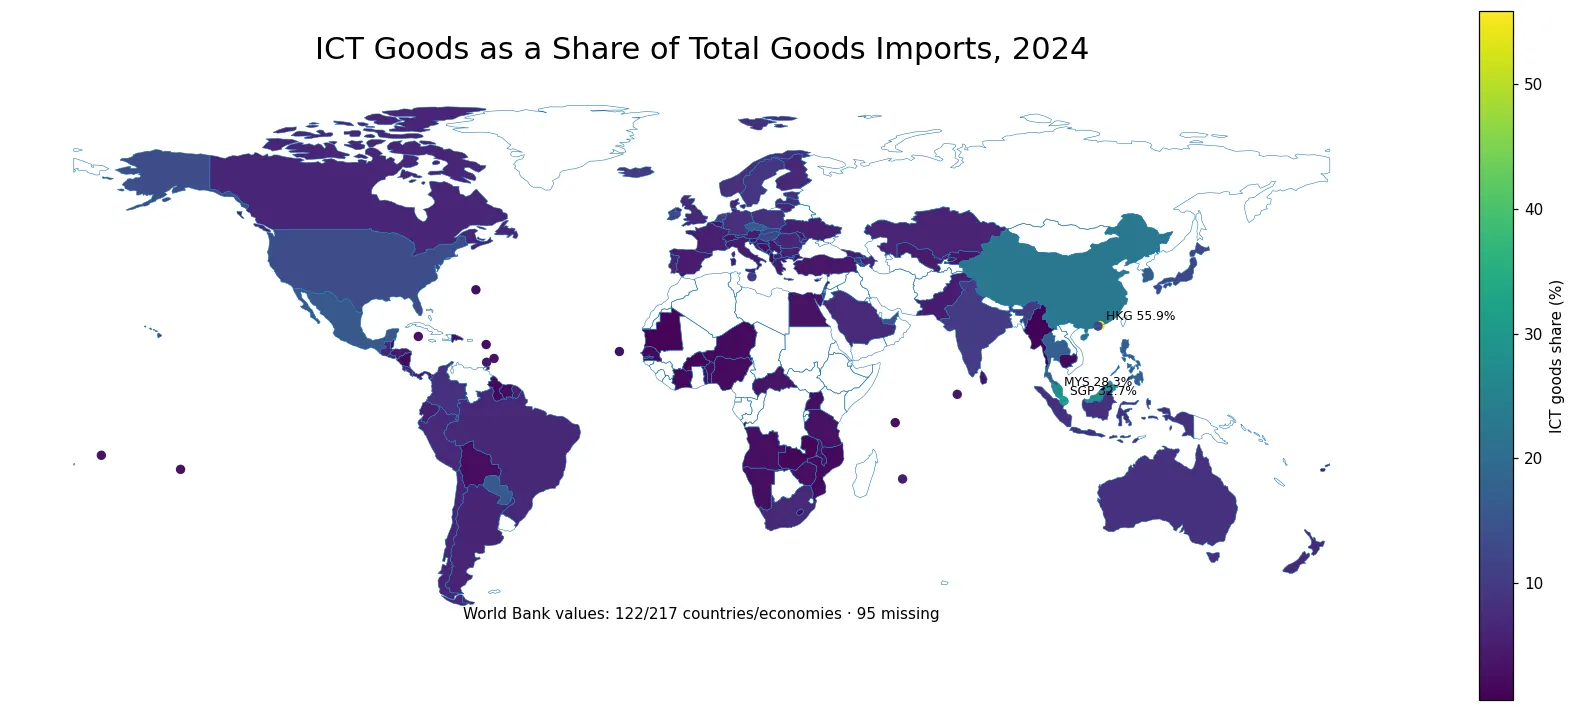
Table of Contents
East and Southeast Asia contain many of the highest reported shares
The strongest geographic pattern is the concentration of high values across parts of East and Southeast Asia. Hong Kong SAR, Singapore, Malaysia, and China occupy the first four positions. Thailand records 17.22% and the Philippines 16.44%, while Japan is also above 10% at 12.39%. The pattern is consistent with the importance of electronics and communications equipment in regional trade, but the indicator alone cannot prove why each economy has a high share. Production networks, component sourcing, re-export activity, domestic manufacturing, and the composition of non-ICT imports may all matter. The map is therefore most useful as evidence of where ICT goods are prominent in the import mix, not as a causal explanation of supply-chain structure.
Hong Kong SAR is an unusually large outlier
Hong Kong SAR’s 55.89% is 23.15 percentage points above Singapore, the second-highest value, and 27.59 points above Malaysia in third place. The gap is large relative to the full reporting distribution. Across the 122 available observations, the mean is 6.59% and the median is 4.67%. The first quartile is 2.74% and the third quartile is 7.65%, meaning half of the reporting economies fall roughly inside that interval. The mean being noticeably higher than the median indicates a right-skewed distribution in which a small number of very high shares lift the average. Values above 20% are therefore far from the middle of the 2024 distribution.
Several Central and Western European economies also exceed 10%
Europe does not form a single uniform band. Czechia records 16.43%, Ireland 12.45%, Hungary 11.94%, the Netherlands 11.14%, and the Slovak Republic 10.84%. Other European economies are much lower; Austria is 4.89% and Belgium 4.01%. This within-region spread matters because continental averages can hide trade-structure differences between neighboring economies. A higher share may reflect the role of electronics assembly, intermediate inputs, logistics, or re-exporting, while a lower share may simply mean that other merchandise categories occupy a larger part of the import bill. The indicator should therefore be read as a composition measure rather than a direct ranking of technological sophistication.
The Americas show both high and low shares
Paraguay reaches 16.12% and Mexico 15.80%, placing both among the ten highest reported values. The United States records 13.45%, also above the 10% threshold. At the other end, Guyana is 1.72%, Nicaragua 1.98%, and Suriname 2.41%. The large spread within the Americas shows why it is risky to describe an entire region with one number. It also highlights a basic limitation of percentage indicators: a 13.45% share in the United States and a 16% share in a smaller economy do not imply comparable import values in dollars. The denominator differs enormously across economies, so the percentages answer a structural question rather than a market-size question.
Low percentages do not mean that an economy barely uses ICT products
The lowest reported 2024 value is The Gambia at 0.60%, followed by Myanmar at 0.93%, Mauritania at 1.17%, Brunei Darussalam at 1.32%, and Burkina Faso at 1.38%. A small percentage does not establish low digital adoption, weak connectivity, or low household use of electronics. It only says that ICT goods make up a small part of merchandise imports as defined by this trade series. The share can be reduced when fuels, food, machinery, vehicles, raw materials, or other goods dominate imports. Domestic production and trade-routing patterns can also affect the ratio. Additional datasets would be needed to connect this measure to digital access or technology use.
| Country/economy | ICT goods share |
|---|---|
| Hong Kong SAR, China | 55.89% |
| Singapore | 32.74% |
| Malaysia | 28.30% |
| China | 22.48% |
| Thailand | 17.22% |
| Philippines | 16.44% |
| Czechia | 16.43% |
| Korea, Rep. | 16.40% |
| Paraguay | 16.12% |
| Mexico | 15.80% |
Missing observations are kept separate from genuine low values
The dataset contains 217 country/economy rows, of which 95 have no 2024 value. Those missing observations are not treated as 0%. That choice is important because a missing value can reflect non-reporting, timing, or source availability, whereas a reported 0% would be an actual measurement. Converting all missing rows to zero would artificially create a large group at the bottom of the distribution and distort the map. Among the 122 reported values, 17.2% are at or above 10%, while 27.9% are below 3%. These percentages describe only the reporting set, not every country and economy in the source master list.
The same percentage can have a very different economic meaning
An economy with a large merchandise-import base can have a lower ICT share but still import more ICT goods in absolute value than a smaller economy with a higher share. The reverse can also occur. Trade hubs introduce another complication because imported electronics and components may be re-exported rather than consumed domestically. Meanwhile, economies with significant domestic electronics production may satisfy part of demand without imports. For those reasons, the indicator is best used to compare the composition of imported goods. It should not be used by itself to infer market demand, consumer ownership, industrial capacity, or the value added generated by the technology sector.
The top and bottom groups reveal how wide the 2024 spread is
The upper tail spans from the mid-teens to more than 50%, while the lowest ten values are concentrated between 0.60% and 2.00%. The top ten include Hong Kong SAR, Singapore, Malaysia, China, Thailand, the Philippines, Czechia, Korea, Paraguay, and Mexico. This list crosses several regions, so the high-share pattern is not exclusive to one part of the world even though East and Southeast Asia are especially prominent. The lower group is also geographically mixed. The broad spread reinforces the importance of comparing individual economies rather than assuming that neighboring countries share the same import structure.
| Lowest reported country/economy | ICT goods share |
|---|---|
| Gambia, The | 0.60% |
| Myanmar | 0.93% |
| Mauritania | 1.17% |
| Brunei Darussalam | 1.32% |
| Burkina Faso | 1.38% |
| Zambia | 1.56% |
| Cote d’Ivoire | 1.70% |
| Guyana | 1.72% |
| Nicaragua | 1.98% |
| Cambodia | 2.00% |
What the map can and cannot answer
The map is useful for locating economies where ICT goods occupy a large or small share of the merchandise-import basket, spotting regional concentrations, and identifying neighboring contrasts. It can also help separate broad clusters from outliers such as Hong Kong SAR. It cannot tell us the total dollar value of ICT imports, the number of devices imported, the size of domestic electronics production, broadband penetration, digital skills, or the competitiveness of a technology industry. Those questions require other indicators. Keeping the question narrow—how much of total goods imports are ICT goods—produces a more accurate interpretation of the data.
Source and calculation method
The source is the World Bank indicator TM.VAL.ICTG.ZS.UN for 2024, expressed as a percentage of total goods imports. The source master contains 217 countries and economies and 122 have non-missing 2024 values. The mean (6.59%), median (4.67%), first quartile (2.74%), and third quartile (7.65%) are calculated directly from those 122 reported observations. No missing value is imputed or changed to zero. The map joins ISO country codes to a low-resolution world boundary file; small countries and territories that are not represented as polygons are shown with approximate point locations. If the World Bank later revises or adds 2024 observations, the coverage and rankings can change when the same indicator is refreshed.
Frequently Asked Questions
Which economy had the highest ICT goods share of total imports in 2024?
Hong Kong SAR, China had the highest reported share at 55.89%, followed by Singapore at 32.74% and Malaysia at 28.30%.
Does a higher percentage mean a larger dollar value of ICT imports?
No. The indicator is a share of total goods imports. Economies with different total import values can have very different ICT import amounts even when their percentages are similar.
Are countries with no value on the map treated as zero?
No. Ninety-five 2024 source-missing observations remain no data and are not converted to zero.
What counts as ICT goods in this indicator?
The category includes computers and peripheral equipment, communication equipment, consumer electronics, electronic components, and other information-technology goods.
Related Articles
Green Map creates custom-edited map images using open geographic data sources such as geoBoundaries, Natural Earth, OpenStreetMap, and government open data. These maps are edited visual materials, not raw data files, and are provided for education, documents, presentations, and graphic reference.