The share of merchandise imports that comes from low- and middle-income economies in the Middle East & North Africa (MENA) varies sharply across reporting economies. World Bank indicator TM.VAL.MRCH.R4.ZS measures the value of merchandise imports from that partner group as a percentage of each reporting economy’s total merchandise imports. A value of 5%, for example, means that roughly five dollars out of every one hundred dollars of merchandise imports came from economies in the indicator’s specified MENA low- and middle-income partner group.
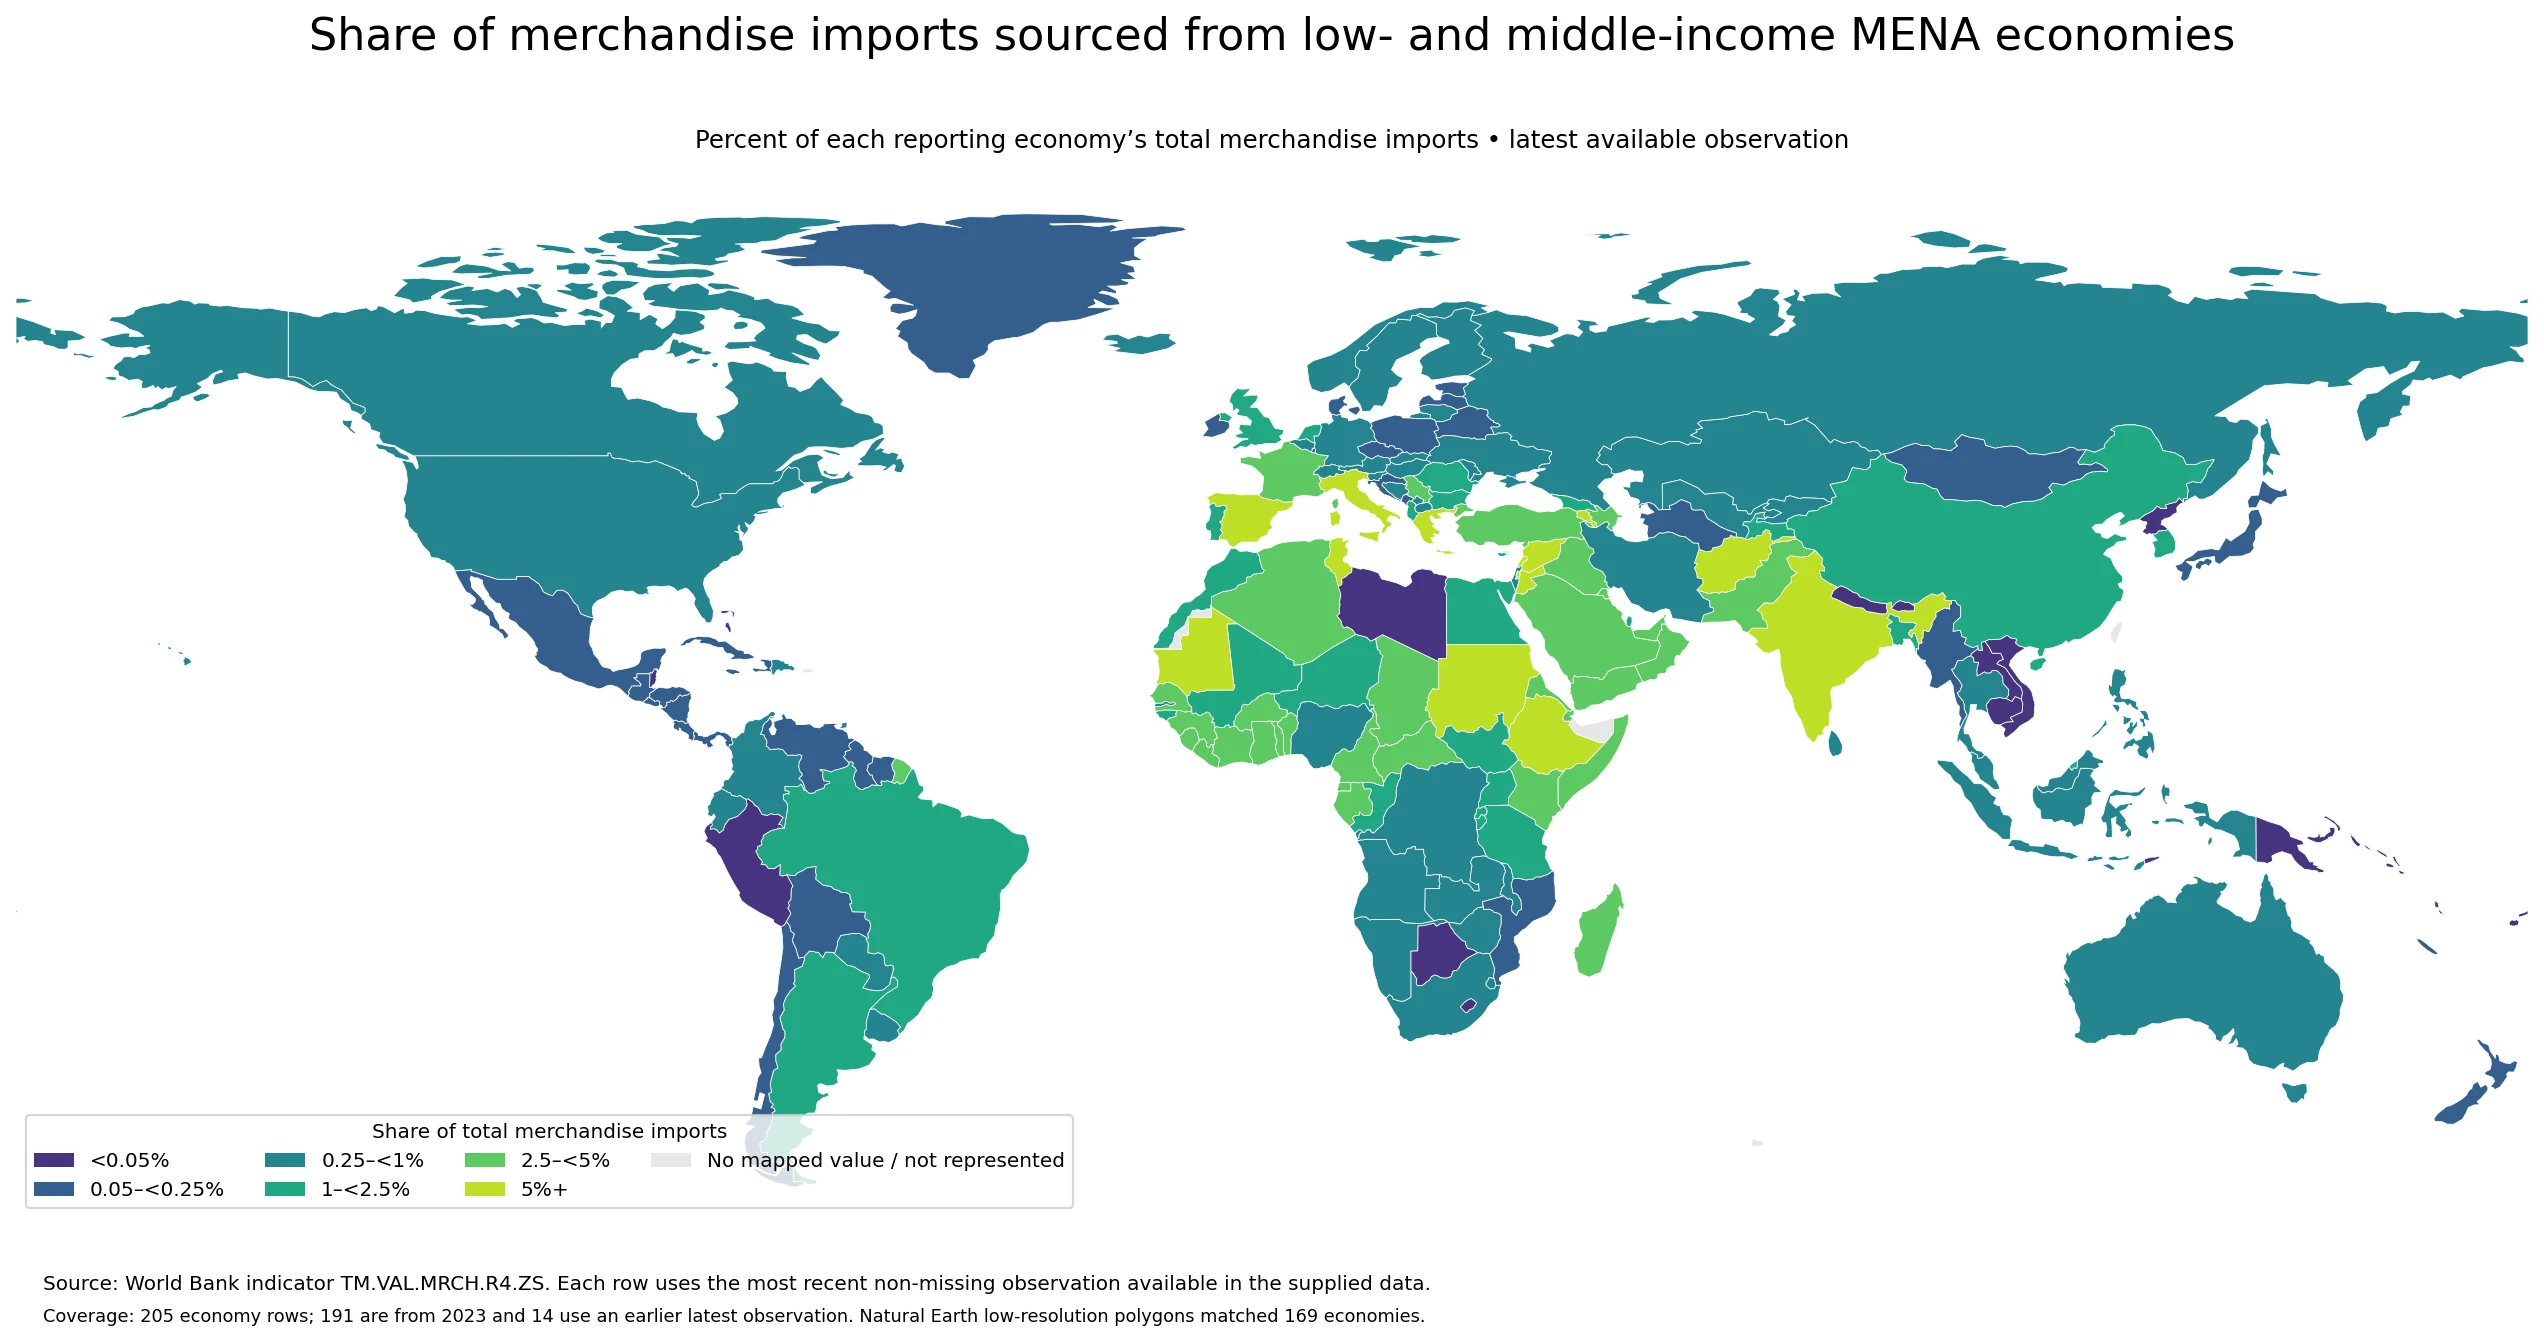
Table of Contents
What this indicator actually measures
The denominator is the reporting economy’s total merchandise imports. The numerator is merchandise imported from economies that fall within the World Bank indicator’s low- and middle-income Middle East & North Africa partner group. This is therefore not the same as the share imported from all MENA economies. A high-income economy in the broader region may not be part of the numerator defined by this series. The measure also covers goods rather than services, so it should not be read as a total trade or total external-purchases measure.
The World Bank definition states that the indicator is computed only when at least half of the economies in the partner group have non-missing data. That condition helps avoid constructing a group share from only a very small subset of partners. Even so, users comparing long periods should remember that country income classifications and data availability can change over time, so a historical series needs to be interpreted within the indicator definition used for the corresponding year.
How the latest values are distributed across 205 economies
Across the 205 verified economy rows, the median is 0.638% and the mean is 1.625%. The first quartile is 0.127% and the third quartile is 2.081%, meaning the middle half of observations falls roughly between 0.13% and 2.08%. A total of 128 economies are below 1%, including 43 below 0.1%. At the other end, only 14 economies are at or above 5%, and just 3 are at or above 10%. The mean being well above the median is consistent with a right-skewed distribution in which a small number of high observations pull up the average.
The highest value is Afghanistan at 23.68%, while the minimum is American Samoa at 0.000002%. That gap is large, but the percentage does not reveal the absolute amount of trade. A small economy can have a high share with a modest import bill, while a very large importer can record a low share but still import a substantial dollar amount from the partner group. Share and scale therefore need to be kept separate.
Economies with the highest shares
The top of the distribution is geographically mixed. Afghanistan records 23.68%, followed by the Syrian Arab Republic at 21.73%. Greece is third at 11.96%, then Tunisia at 9.82%, Sudan at 9.07%, Ethiopia at 8.04%, West Bank and Gaza at 8.03%, Mauritania at 7.99%, Lebanon at 7.40%, and Italy at 5.77%. Several high values lie in or near the MENA region, but European economies such as Greece and Italy also appear in the top ten. The indicator shows the pattern; it does not by itself establish whether distance, tariffs, product mix, logistics, policy, or another factor caused it.
| Economy | Latest share | Observation year |
|---|---|---|
| Afghanistan | 23.68% | 2023 |
| Syrian Arab Republic | 21.73% | 2023 |
| Greece | 11.96% | 2023 |
| Tunisia | 9.82% | 2023 |
| Sudan | 9.07% | 2023 |
| Ethiopia | 8.04% | 2023 |
| West Bank and Gaza | 8.03% | 2023 |
| Mauritania | 7.99% | 2023 |
| Lebanon | 7.40% | 2023 |
| Italy | 5.77% | 2023 |
Most top-ten observations are from 2023, which improves comparability within that group. Still, the percentage should not be treated as a measure of total bilateral trade. Two economies can both record 8% while importing vastly different absolute values of merchandise. To evaluate commercial scale, this share should be paired with total merchandise imports or partner-level import values.
Economies with very small shares
The bottom of the distribution includes several small Pacific economies and parts of East and Southeast Asia. American Samoa, Sint Maarten (Dutch part), Solomon Islands, Samoa and the Marshall Islands all sit near or below one-thousandth of one percent. Papua New Guinea, Bhutan, Korea, Dem. People’s Rep., Palau and Viet Nam are also among the lowest observations. A low value means only that this partner group accounts for a small slice of the reporting economy’s merchandise imports. It does not mean that total imports are low, trade openness is low, or the economy is poorly connected to global markets.
| Economy | Latest share | Observation year |
|---|---|---|
| American Samoa | 0.0000% | 2023 |
| Sint Maarten (Dutch part) | 0.0000% | 2020 |
| Solomon Islands | 0.0000% | 2021 |
| Samoa | 0.0001% | 2009 |
| Marshall Islands | 0.0001% | 2023 |
| Tonga | 0.0004% | 2011 |
| Papua New Guinea | 0.0005% | 2023 |
| Bhutan | 0.0010% | 2023 |
| Korea, Dem. People's Rep. | 0.0016% | 2021 |
| Palau | 0.0035% | 2023 |
Observation age matters particularly for some of the smallest values. Samoa’s latest available row is from 2009, Tonga’s is from 2011 and Solomon Islands’ is from 2021. Those records should not be presented as if they were current 2023 conditions. They are the latest non-missing World Bank observations available in the supplied dataset and may differ materially from the economy’s present trade structure.
Spatial clusters and neighboring differences
The map shows a concentration of higher shares around parts of MENA and the Mediterranean, but the pattern is far from uniform. Within North Africa, Tunisia records 9.82%, Algeria 3.61% and Morocco 2.17%. In the eastern Mediterranean, Lebanon is at 7.40%, Jordan at 5.39% and Israel at 0.70%. In Europe, Greece is at 11.96%, Italy 5.77%, Spain 5.05%, France 3.32% and Germany 0.93%. Neighboring or nearby economies can therefore occupy very different parts of the distribution.
South Asia and its surroundings show the same point. Afghanistan stands at 23.68%, while Pakistan is 3.93% and India 5.49%. The map is useful for identifying these contrasts, but explaining them requires more granular evidence such as product composition, partner-level values, transport routes and trade-policy data. The indicator alone should not be used to assign a single cause to the differences.
Why the 2023 rows must be separated from older latest values
This dataset is not a perfectly synchronized cross-section. It selects the most recent non-missing observation for each economy. Of 205 rows, 191 are from 2023, so 2023 dominates the overall pattern. The remaining 14 rows are older. New Caledonia’s latest value is from 2004, Samoa’s from 2009, Tonga and Vanuatu from 2011, Cambodia from 2014, Fiji from 2017, and several others from 2020–2022. Calling the full set a “2023 ranking of 205 economies” would therefore overstate the temporal consistency of the data.
At the same time, the fact that 191 rows are from 2023 is useful context: most of the map represents roughly the same period. The observation year shown in the tables is intended to make the exceptions visible. For any economy with an older row, recent national trade statistics or a later World Bank update should be checked before using the value to describe current conditions.
Companion measures that improve interpretation
First, total merchandise imports separate percentage share from absolute scale. Second, partner-level import values and product-level data show which goods account for the share. Third, an export-side measure helps distinguish a one-way sourcing relationship from broader two-way merchandise trade. These additions are especially important for economies whose share is high but whose total import market is relatively small.
The indicator also does not directly measure economic growth, supply-chain resilience, trade risk or the quality of diversification. A larger share is not inherently good or bad, and a smaller share does not prove that the import base is more diversified. Those assessments require information on partner concentration, product concentration, substitutability, inventories, transport routes and other exposure measures.
How to read the map accurately
The map is based on all 205 economy rows, while 169 low-resolution Natural Earth polygons could be matched directly for display. Some small islands and territories can have a source value without a separately visible polygon in this world layer, and a few geographies in the boundary file do not have a matched value. A tiny economy that is not visible on the map should therefore not automatically be treated as missing from the underlying World Bank data. The economy-level row remains the authoritative reference for the numeric value.
The color bands are visualization bins, not official World Bank categories or policy thresholds. Two economies just below and just above a boundary can have nearly identical values while appearing in different shades. For close comparisons, use the reported percentage and year rather than the color band alone.
Source and calculation basis
The source is World Bank indicator TM.VAL.MRCH.R4.ZS. The unit is percent of total merchandise imports, and the dataset uses the latest non-missing observation for each economy. There are no missing values in the 205-row extract used here, no missing observations were converted to zero, and no values were imputed. Under the indicator definition, the numerator is merchandise imports from low- and middle-income MENA partner economies and the denominator is total merchandise imports of the reporting economy.
Frequently Asked Questions
Does this measure imports from all MENA economies?
No. The numerator covers the low- and middle-income MENA partner group defined by the World Bank indicator, divided by the reporting economy’s total merchandise imports.
Are all 205 economy values from 2023?
No. 191 rows are from 2023, while 14 rows use an earlier latest non-missing observation from 2004–2022.
Does a higher share mean a larger absolute import value?
Not necessarily. This is a percentage of total merchandise imports. Absolute trade scale requires total merchandise imports or partner-level import values as well.
Related Articles
Green Map creates custom-edited map images using open geographic data sources such as geoBoundaries, Natural Earth, OpenStreetMap, and government open data.
These maps are edited visual materials, not raw data files, and are provided for education, documents, presentations, and graphic reference.