Do female and male children participate in privately managed early-childhood education programmes at similar rates? UNESCO Institute for Statistics (UIS) indicator ETOIP.0.PR.GPIA answers that question with an adjusted gender parity index. It does not report the private-enrolment percentage itself. It compares the private-institution share of female enrolment with the corresponding share of male enrolment.
The 2024 extract contains 78 country and area observations. Nineteen fall within the UIS parity band of 0.97–1.03, 52 are below 0.97 and 7 are above 1.03. The median is 0.956 and the unweighted mean is 0.944, so the center of the distribution lies slightly below the parity reference of 1.
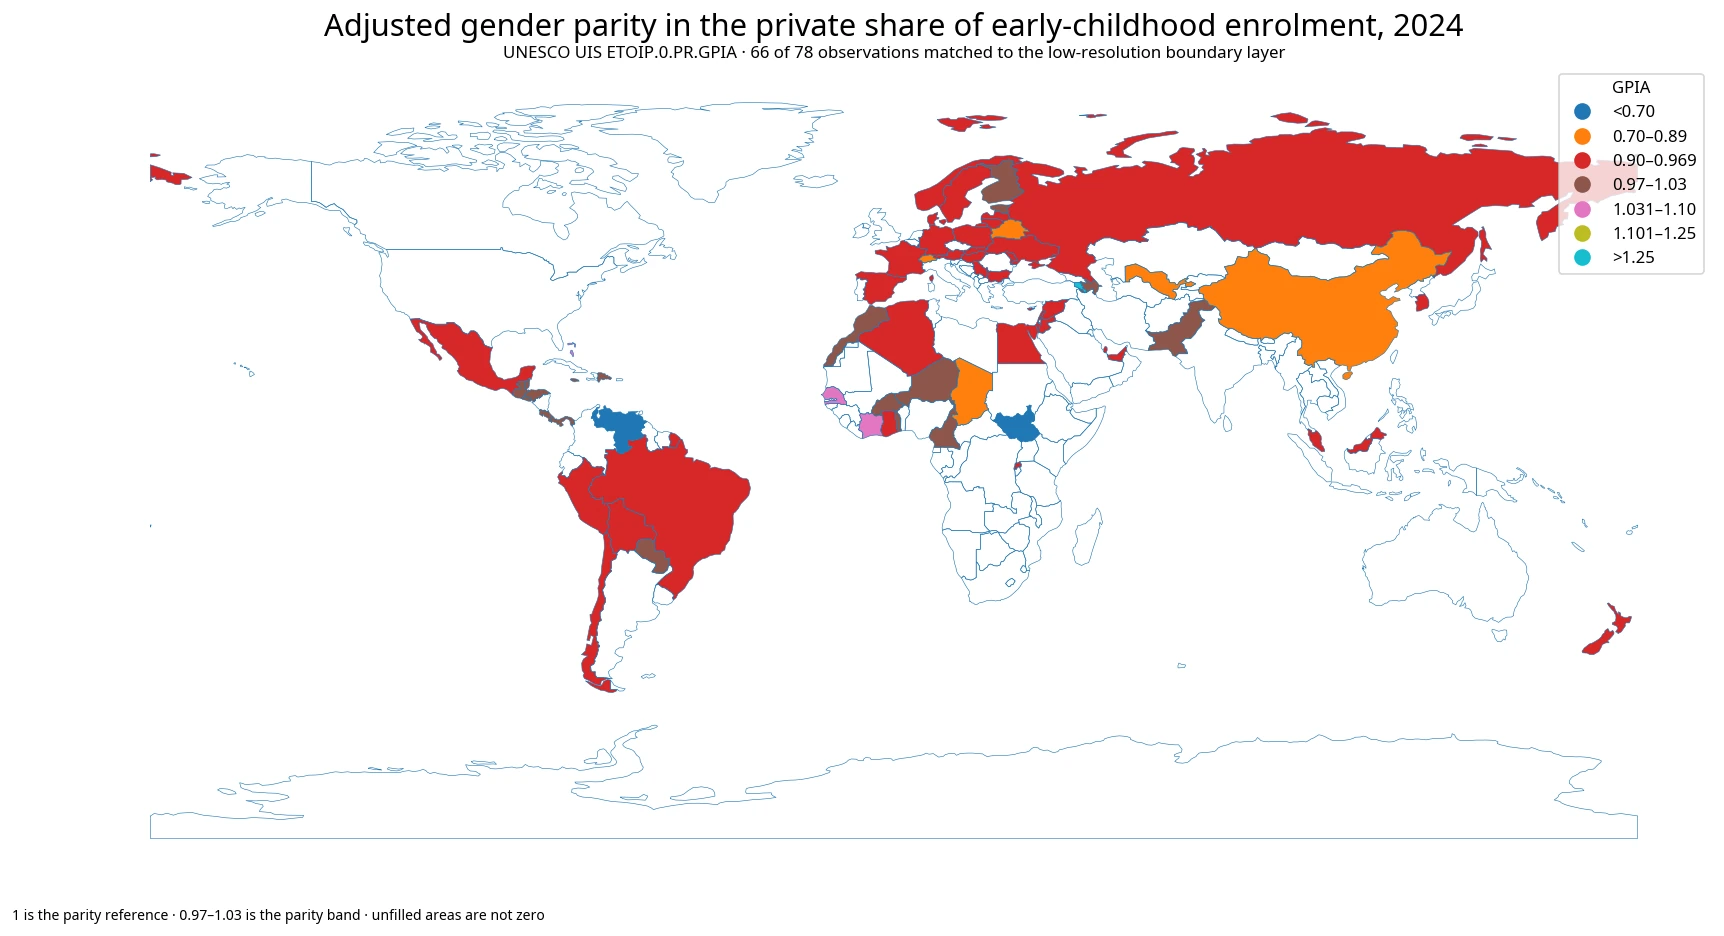
Table of Contents
This is not the female share among children in private institutions
The underlying private-enrolment indicator uses total enrolment at the education level as its denominator and calculates the percentage enrolled in privately managed institutions. For GPIA, that percentage is calculated separately for female and male enrolment and the two indicator values are compared.
A GPIA of 0.8 therefore does not mean that 80% of children in private early-childhood programmes are male. It means the female private-enrolment percentage is lower than the male private-enrolment percentage. A value above 1 points in the opposite direction.
The index also does not provide the number of female or male children enrolled in private institutions. Overall female and male enrolment can differ, so similar private shares can coexist with different headcounts. GPIA is a relative parity measure, not a count.
GPIA is centered on 1 and 0.97–1.03 is the parity band
The standard gender parity index divides the female value of an indicator by the male value. Equality produces a value of 1. UIS developed the adjusted form to represent disparities more symmetrically around 1 and to limit the theoretical range to 0–2.
UIS generally treats 0.97–1.03 as gender parity. In this extract, 19 of 78 observations fall inside that interval. There are 65 values below 1 and 13 above 1; none are exactly 1.000 in the source values.
Because an adjustment is applied when the female indicator exceeds the male indicator, a GPIA of 1.20 should not be translated into the claim that the female private-enrolment percentage is exactly 20% higher. Direction and distance from 1 are the safer way to read the index.
Most observations are below the narrow parity band
Fifty-two observations are below 0.97, indicating a lower female private-enrolment share than the male share. Only 7 are above 1.03, indicating the female share is higher. This country count is not weighted by the number of enrolled children, so it should not be treated as a global child-weighted gender balance.
The first quartile is 0.933 and the third quartile is 0.982. Four observations are more than 0.20 away from 1, and three are more than 0.30 away. The distribution therefore combines a large cluster just below parity with a small number of extreme outliers.
Every country or area contributes one observation to the mean and median. A very large education system and a small island territory have equal statistical weight in these summaries. The unweighted mean of 0.944 must not be rewritten as the gender parity of all children worldwide.
South Sudan and Armenia sit at opposite ends of the observed scale
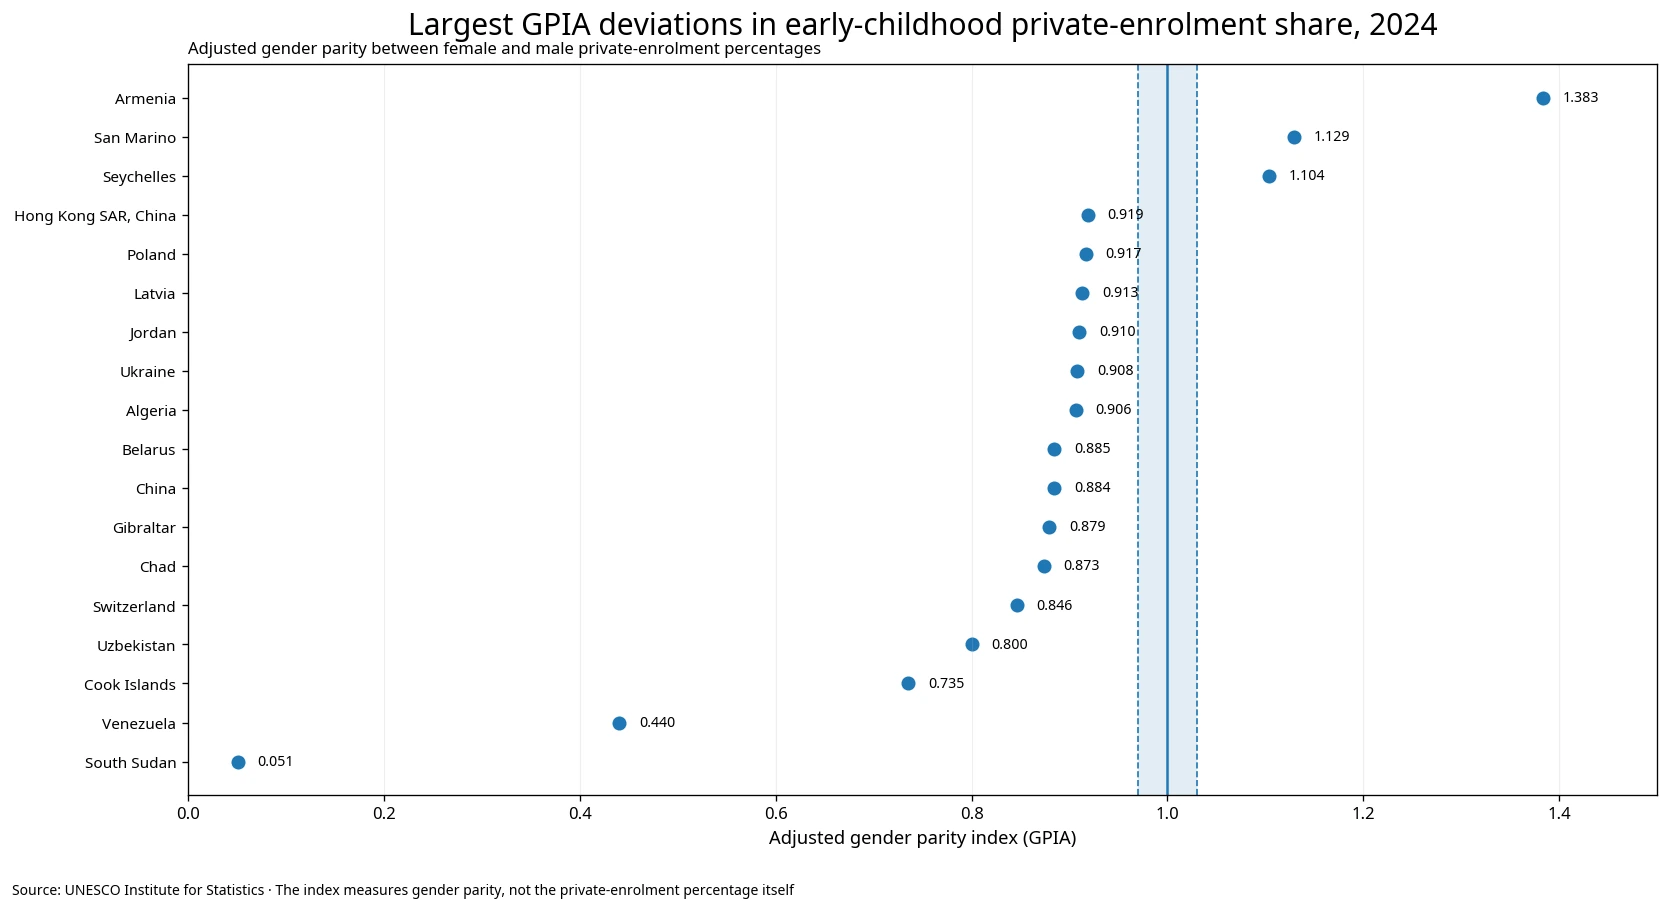
The lowest value is South Sudan at 0.05068. Venezuela is 0.440, the Cook Islands 0.735, Uzbekistan 0.800 and Switzerland 0.846. These observations point toward a lower female private-enrolment percentage, but the source extract does not contain the underlying female and male percentages, so those base values are not reconstructed.
At the other end, Armenia is 1.383, San Marino 1.129, Seychelles 1.104, Senegal 1.074 and the Bahamas 1.073. These values indicate a higher female private-enrolment share. They do not mean those countries have a larger private early-childhood sector overall.
Both sexes could have low private-enrolment percentages and still produce a large disparity if the two percentages differ sharply. Conversely, both could have high private shares and remain close to parity when the female and male percentages are similar. Sector size and gender parity are separate dimensions.
Selected countries illustrate the low, parity and high zones
The table below is not a ranking of private provision. It selects observations from the lower side, the parity band and the higher side. Values below 0.97 are labeled female-lower, 0.97–1.03 parity, and above 1.03 female-higher.
| Country / area | 2024 GPIA | Interpretation |
|---|---|---|
| South Sudan | 0.051 | Female private-enrolment share lower |
| Venezuela | 0.440 | Female private-enrolment share lower |
| Cook Islands | 0.735 | Female private-enrolment share lower |
| Uzbekistan | 0.800 | Female private-enrolment share lower |
| Switzerland | 0.846 | Female private-enrolment share lower |
| China | 0.884 | Female private-enrolment share lower |
| Belarus | 0.885 | Female private-enrolment share lower |
| Poland | 0.917 | Female private-enrolment share lower |
| Republic of Korea | 0.955 | Female private-enrolment share lower |
| Guatemala | 0.982 | Parity range |
| Costa Rica | 0.986 | Parity range |
| Azerbaijan | 0.998 | Parity range |
| Belize | 1.001 | Parity range |
| Pakistan | 1.018 | Parity range |
| Dominican Republic | 1.022 | Parity range |
| Côte d’Ivoire | 1.047 | Female private-enrolment share higher |
| Senegal | 1.074 | Female private-enrolment share higher |
| Seychelles | 1.104 | Female private-enrolment share higher |
| San Marino | 1.129 | Female private-enrolment share higher |
| Armenia | 1.383 | Female private-enrolment share higher |
The Republic of Korea records 0.955, slightly below the 0.97 threshold. This does not reveal the country’s overall private share of early-childhood enrolment. It only indicates that the female private-enrolment percentage is somewhat lower than the male percentage in this 2024 observation.
Private does not necessarily mean for-profit or unsubsidized
UIS defines a private educational institution primarily through control and management. It is controlled and managed by a non-governmental organization or has a governing body mostly not selected by a public agency. Religious organizations, nonprofits, foundations, associations and businesses can all fall within private categories.
Institutional control is not the same as funding source. Private institutions may receive public subsidies, so a high private-enrolment share cannot be converted directly into household cost, commercialization or absence of government support. GPIA is even narrower: it compares the female and male private-enrolment percentages.
Early-childhood systems also sit at the boundary of education and care. Countries differ in which programmes are included in the formal education system, how younger ages are classified and how public and private providers are organized. International definitions improve comparability, but they do not eliminate every institutional difference.
South Sudan’s extreme value requires the underlying sex-specific percentages for fuller interpretation
South Sudan’s 0.05068 is an extreme outlier relative to the other observations. Under the GPIA direction it indicates a female underlying private-enrolment percentage far below the male value, but the two underlying percentages are not included in this extract.
The index alone cannot establish whether the extreme value reflects a very small female private share, a small denominator, a programme-classification issue or another country-specific circumstance. It should not automatically be labeled an error, and a causal explanation should not be invented.
The visual therefore prints the values and includes the reference line at 1 plus the 0.97 and 1.03 boundaries. The useful signal is direction and distance from parity rather than a simple league-table rank.
Small countries and territories remain in the statistics even when the map cannot display them
Sixty-six of the 78 statistical observations match separate polygons in the low-resolution world boundary layer. The unmatched group includes Andorra, Bahrain, the Cook Islands, Cayman Islands, Gibraltar, Hong Kong, Macao, Monaco, Maldives, Mauritius, San Marino and Seychelles.
Those observations remain in the mean, median, parity-band counts and tables. A missing polygon is not a zero GPIA, and it is not the same as missing statistical data. The map is a spatial overview rather than a substitute for the country table.
This distinction is especially important for island states and separately reported territories, which are more likely to disappear in a low-resolution boundary layer even when valid education statistics exist.
A single 2024 cross-section cannot establish a trend or a cause
All 78 observations use the same 2024 reference year, which avoids mixing different observation years. That improves the consistency of the cross-country comparison.
One year cannot show whether a country is moving toward or away from parity. A trend requires comparable GPIA values across multiple years. The index also cannot identify whether cost, public provision, provider type, household income, geography or policy causes the observed gender difference.
A fuller analysis would combine the female and male private-enrolment percentages with overall participation, public-private provision, costs and teacher indicators. GPIA contributes one focused dimension: relative gender balance in the private share.
Data source and calculation method
Country values come from UNESCO Institute for Statistics indicator ETOIP.0.PR.GPIA, “Percentage of enrolment in early childhood education programmes in private institutions, adjusted gender parity index (GPIA),” using the 2024 NATIONAL observations in this comparison. The observed values are on the 0–2 GPIA scale and are interpreted as an index rather than a percentage.
- UNESCO UIS official API — ETOIP.0.PR.GPIA
- UNESCO UIS — adjusted GPI methodology and the 0.97–1.03 parity band
- UNESCO UIS — percentage of private enrolment definition
- UNESCO UIS — private educational institution definition
The mean 0.944, median 0.956, quartiles and parity-band counts are calculated directly from the 78 non-missing observations. Missing values are not zero-filled, and no sex-specific private-enrolment percentage or student count is estimated from the GPIA.
The strongest conclusion supported by the dataset is about how similarly or differently female and male early-childhood enrolment is distributed into private institutions in the 2024 observations. The overall private share, total participation, student volume, cost, education quality and causes of the gender differences require additional measures.
Frequently Asked Questions
What does a GPIA of 1 mean here?
It means the percentage of female early-childhood enrolment in private institutions equals the corresponding percentage among male enrolment. UIS generally treats 0.97–1.03 as the parity band.
Does a GPIA of 0.8 mean 80% of children in private institutions are male?
No. It indicates that the female private-enrolment percentage is lower than the male percentage. It does not describe the sex composition of private-institution enrolment.
Does this indicator show the overall private share of early-childhood enrolment?
No. It is the gender parity index for the underlying private-enrolment percentage. The overall private share is a separate indicator.
Does private mean only for-profit institutions with no public support?
No. UIS classifies institutions mainly by control and management. Private providers may be nonprofit or religious and may receive government funding.
Related Articles
- Private Pre-Primary Enrolment Share | 142 Recent Country Observations
- Pre-Primary Net Enrolment Rate in 2024 | 121 Countries and Areas
- Pre-Primary Teachers Meeting Minimum Training Requirements | 2024
Green Map creates custom-edited map images using open geographic data sources such as geoBoundaries, Natural Earth, OpenStreetMap, and government open data.
These maps are edited visual materials, not raw data files, and are provided for education, documents, presentations, and graphic reference.