Country-level tobacco-use data for 2024 show a wide spread rather than a single global pattern. Across 166 reported countries and areas in the World Bank series SH.PRV.SMOK, the median current tobacco-use rate among adults is 19.0%, while the mean is 19.8%. The range stretches from 3.1% to 48.8%, a gap of 45.7 percentage points. The map and tables below focus on that distribution: where values cluster, which observations sit at the extremes, and how much information is lost when the data are reduced to one average.
The indicator is named Prevalence of current tobacco use (% of adults). This article therefore treats it as a comparative prevalence measure and does not infer the causes of national differences from the indicator alone. Policy, product mix, demographic structure, survey methods, income, and other factors may matter, but they require separate evidence.
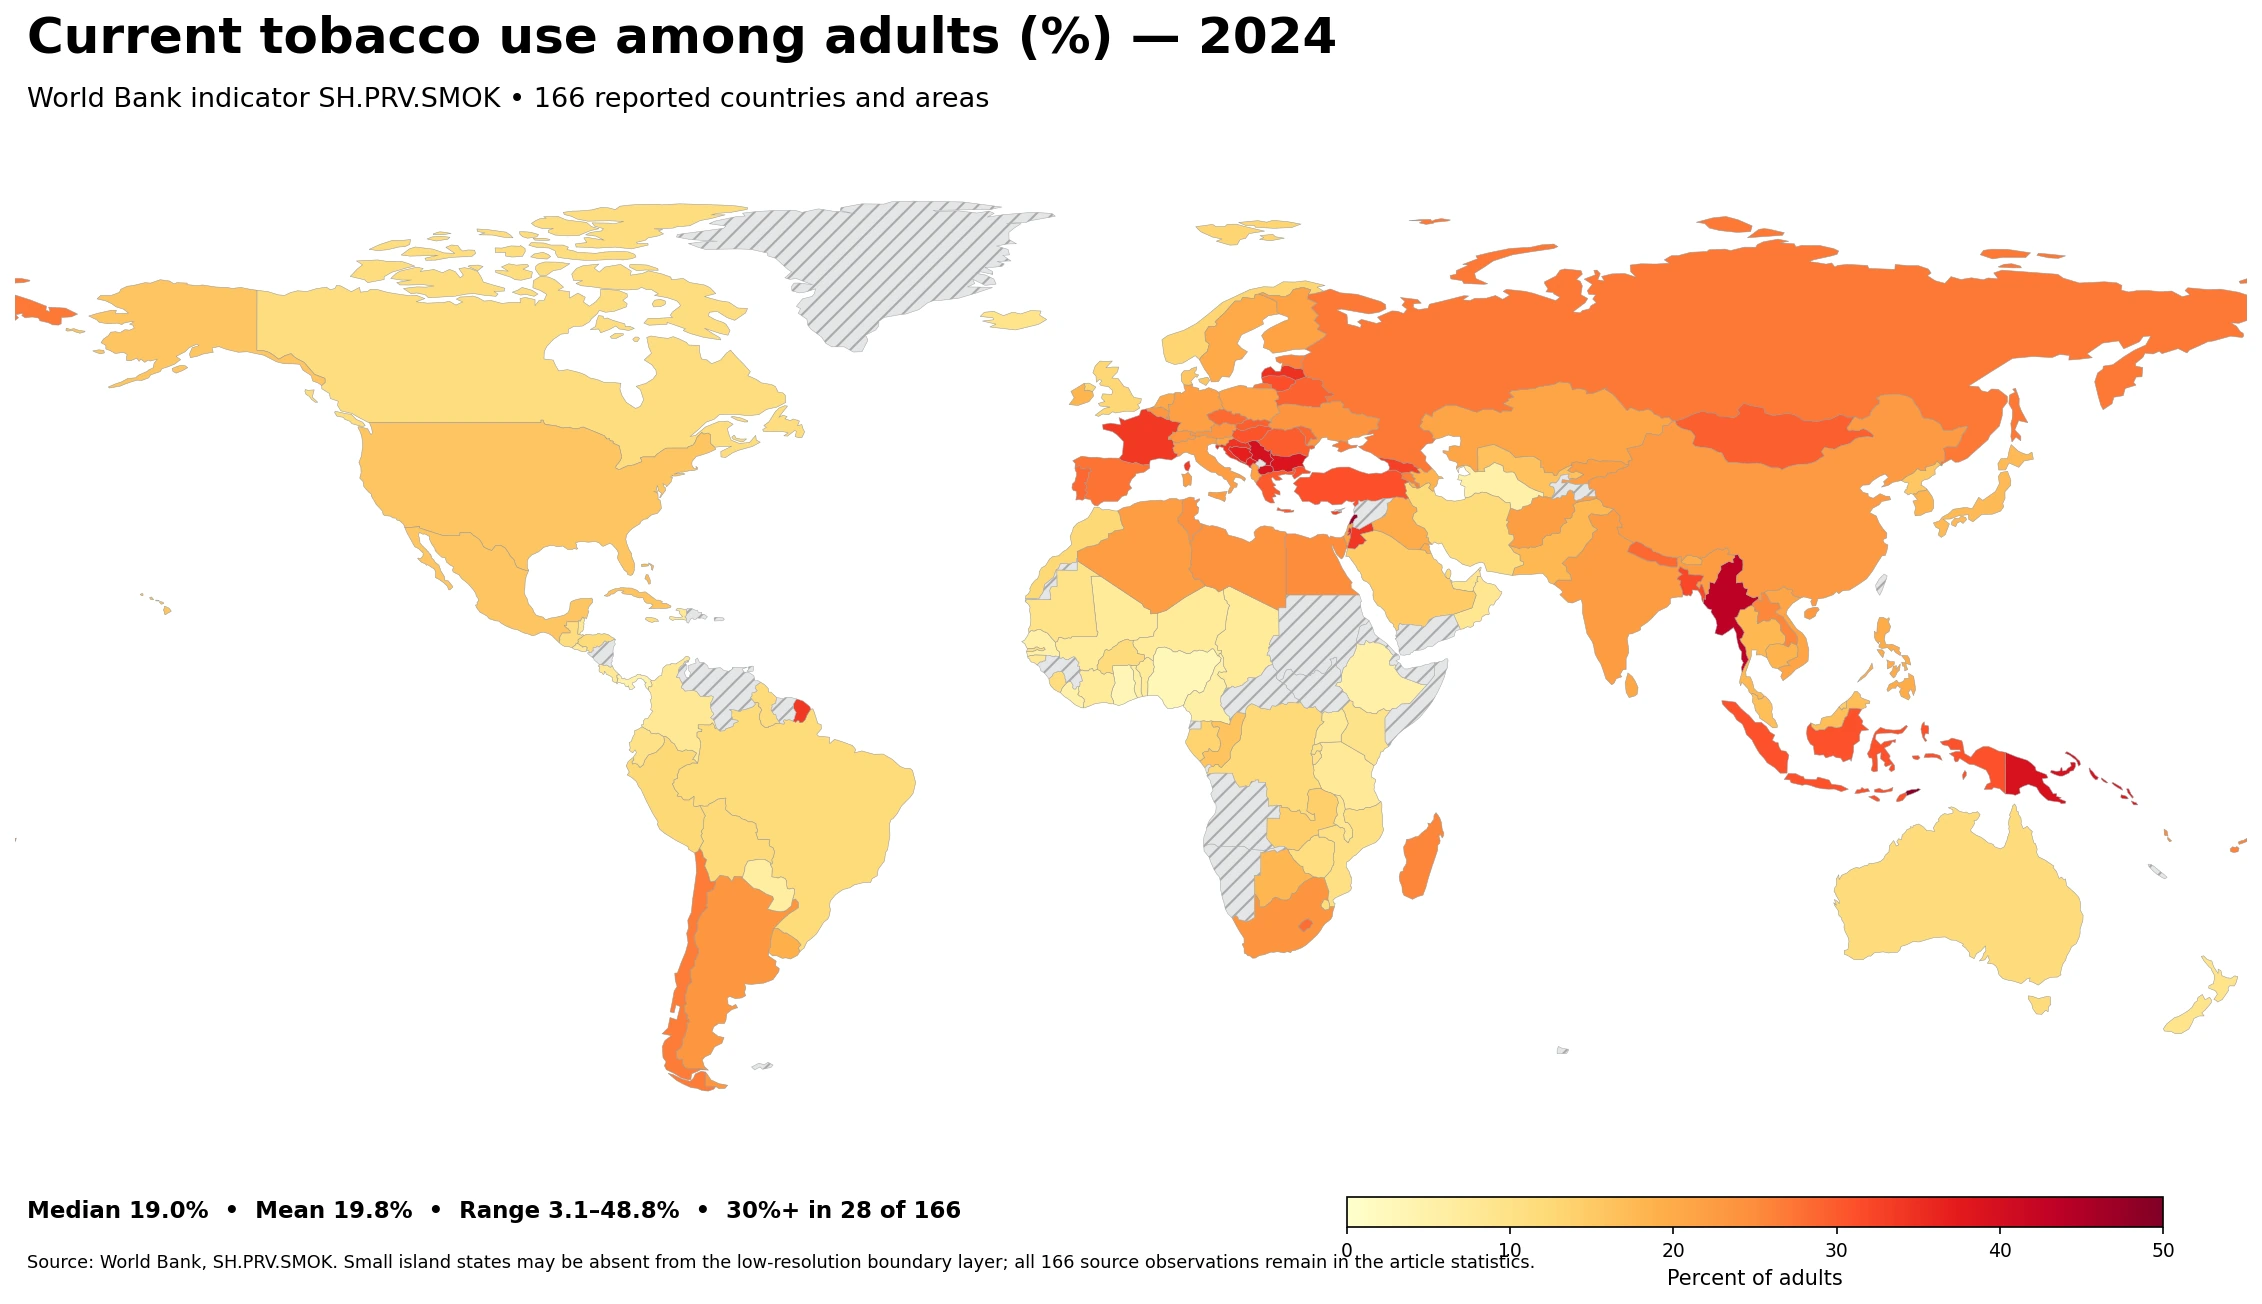
Table of Contents
A distribution centered near 19%, with long tails
The median is 19.0% and the mean is 19.8%. The middle half of observations runs from about 11.4% to 26.2%, so even the interquartile range spans nearly 15 percentage points. There are 79 countries and areas at 20% or above and 87 below 20%, making that threshold close to a half-and-half split.
The tails remain substantial. 28 observations are at or above 30%, while 32 are below 10%. Only three exceed 40%. These counts show why a single global average is not enough to describe the country distribution: the dataset contains both very low single-digit values and rates approaching one half of adults.
| Range | Countries and areas |
|---|---|
| Below 10% | 32 |
| 10–19.9% | 55 |
| 20–29.9% | 51 |
| 30% or higher | 28 |
Highest reported values in 2024
Timor-Leste has the highest value in the dataset at 48.8%, followed by Lebanon at 46.9% and Myanmar at 43.4%. Those are the only three observations above 40%. Serbia, North Macedonia, Papua New Guinea, Bulgaria, the Solomon Islands, Kiribati, and Montenegro also appear near the top, all above 37%.
| Highest countries and areas | 2024 value |
|---|---|
| Timor-Leste | 48.8% |
| Lebanon | 46.9% |
| Myanmar | 43.4% |
| Serbia | 39.7% |
| North Macedonia | 39.6% |
| Papua New Guinea | 39.3% |
| Bulgaria | 38.7% |
| Solomon Islands | 38.4% |
| Kiribati | 37.7% |
| Montenegro | 37.2% |
The upper end is geographically mixed. It includes parts of Southeast Asia and the Pacific, southeastern Europe, and the Middle East. That matters when interpreting the map: a high value is not confined to one continent or one income group, and neighboring countries can still differ sharply.
Lowest reported values in 2024
Nigeria is the lowest observation at 3.1%, with Ghana at 3.3% and Panama at 4.8%. Ethiopia and Liberia are both at 5.2%; Senegal and Turkmenistan are at 5.4%. Several West African countries appear in the lower tail, but the bottom group also includes countries from Central and South America and Central Asia.
| Lowest countries and areas | 2024 value |
|---|---|
| Nigeria | 3.1% |
| Ghana | 3.3% |
| Panama | 4.8% |
| Ethiopia | 5.2% |
| Liberia | 5.2% |
| Senegal | 5.4% |
| Turkmenistan | 5.4% |
| Cameroon | 5.7% |
| Togo | 5.8% |
| Paraguay | 6.4% |
What the map reveals that rankings do not
A ranking emphasizes extremes, while the map makes clusters and discontinuities easier to see. Several countries in southeastern Europe appear in high or upper-middle bands, yet nearby countries are not identical. Parts of West Africa form a broad low-value cluster. East and Southeast Asia show a particularly mixed pattern, with Indonesia at 31.0%, China at 22.8%, Japan at 17.5%, and India at 22.6%.
Other familiar comparisons also show why continent-wide labels can be misleading. France is at 33.6%, while the United Kingdom is at 12.8%. The United States is at 15.8%, Canada at 11.2%, and Mexico at 15.7%. Brazil is at 11.9%, while Argentina is at 23.5%. The geography is informative, but it does not replace country-level values.
Reading the median, quartiles, and thresholds together
Because the mean and median are close, the center of the distribution is relatively stable around 19–20%. Still, the upper tail pulls the average slightly above the median. The quartiles add useful context: one quarter of observations are at or below about 11.4%, and one quarter are at or above about 26.2%. A country at 25%, for example, is not merely “five points above 20%”; it is already close to the upper quartile of this 166-observation distribution.
Threshold counts are also more informative when several cutoffs are shown together. There are 32 observations below 10%, 55 from 10% to 19.9%, 51 from 20% to 29.9%, and 28 at 30% or above. That shape avoids forcing the data into a binary high-versus-low frame and better reflects the continuous spread shown on the map.
What this indicator can and cannot answer
The series is useful for comparing current tobacco-use prevalence across countries and areas at a common reference year. It supports rankings, distribution summaries, quartiles, and geographic pattern checks. It can also be paired with sex-specific tobacco-use indicators to examine whether overall prevalence masks differences between men and women.
The indicator cannot, by itself, establish why one country is higher than another or whether a particular policy caused a change. It also should not be mixed casually with values from other years. This analysis uses the 2024 observations consistently, so comparisons should keep the same year and indicator definition in view.
Data notes
- The source series is World Bank indicator SH.PRV.SMOK, with 166 country and area observations for 2024.
- The mean, median, quartiles, threshold counts, and rankings in this article are calculated directly from those 166 values.
- Missing values are not converted to zero. A small number of island states are absent from the low-resolution map geometry but remain in every numerical summary.
- The series describes prevalence of current tobacco use among adults; it does not independently identify causal drivers or policy effects.
Source and indicator
All country values come from the World Bank series SH.PRV.SMOK, Prevalence of current tobacco use (% of adults), using the 2024 observations supplied for this analysis. If the source later revises historical observations, recalculated rankings or summary statistics may also change. Keeping the year and indicator code attached to any comparison helps avoid mixing non-equivalent figures.
Frequently Asked Questions
What is the median current tobacco-use rate among adults in 2024?
The median across the 166 reported countries and areas is 19.0%. The mean is about 19.8%, and the middle half of observations lies between roughly 11.4% and 26.2%.
How many countries and areas are at 30% or higher?
Twenty-eight observations are at or above 30% in the 2024 dataset. Thirty-two are below 10%.
Which observations are highest and lowest?
Timor-Leste is highest at 48.8%, while Nigeria is lowest at 3.1%. The full range spans 45.7 percentage points.
Related Articles
Green Map creates custom-edited map images using open geographic data sources such as geoBoundaries, Natural Earth, OpenStreetMap, and government open data.
These maps are edited visual materials, not raw data files, and are provided for education, documents, presentations, and graphic reference.