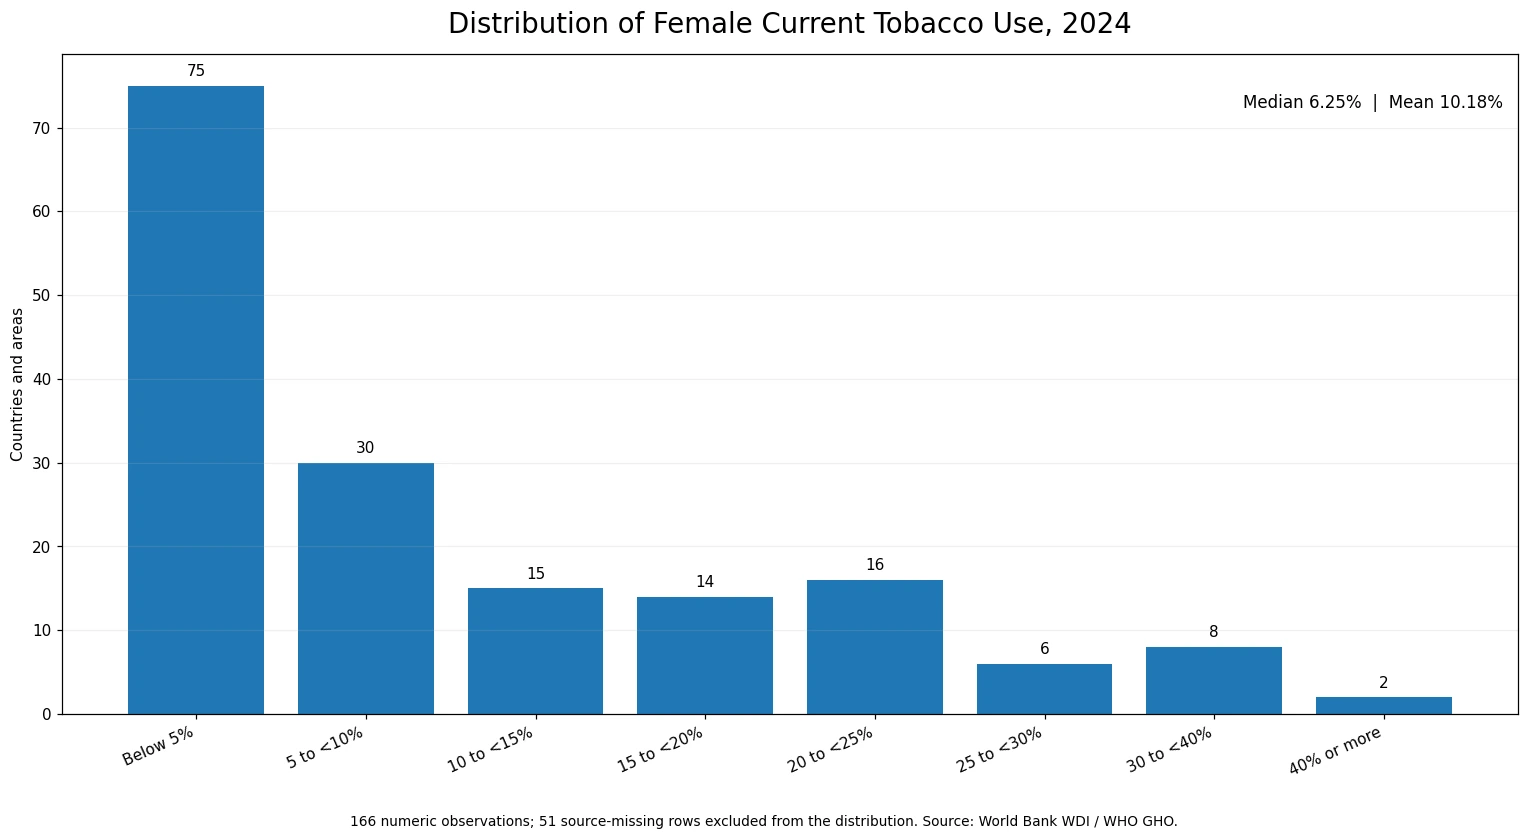
Female current tobacco use in 2024 is concentrated toward the lower end of the country distribution, but a smaller set of countries and areas report much higher values. Among the 166 numeric observations in the World Bank table, the median is 6.25% and the unweighted mean is 10.18%. Seventy-five observations are below 5%, while only two are at or above 40%. That shape makes the full distribution more informative than a short list of the highest values.
The series is World Bank indicator SH.PRV.SMOK.FE, Prevalence of current tobacco use, females (% of female adults). It covers women ages 15 and older who currently use a tobacco product either daily or non-daily. The definition includes cigarettes, cigars, pipes, waterpipes, heated tobacco products, bidis, kretek, and oral or nasal smokeless tobacco. Tobacco-free electronic products such as e-cigarettes are excluded. The percentages are age-standardized to the WHO Standard Population so that differences in national age structure have less influence on the comparison.
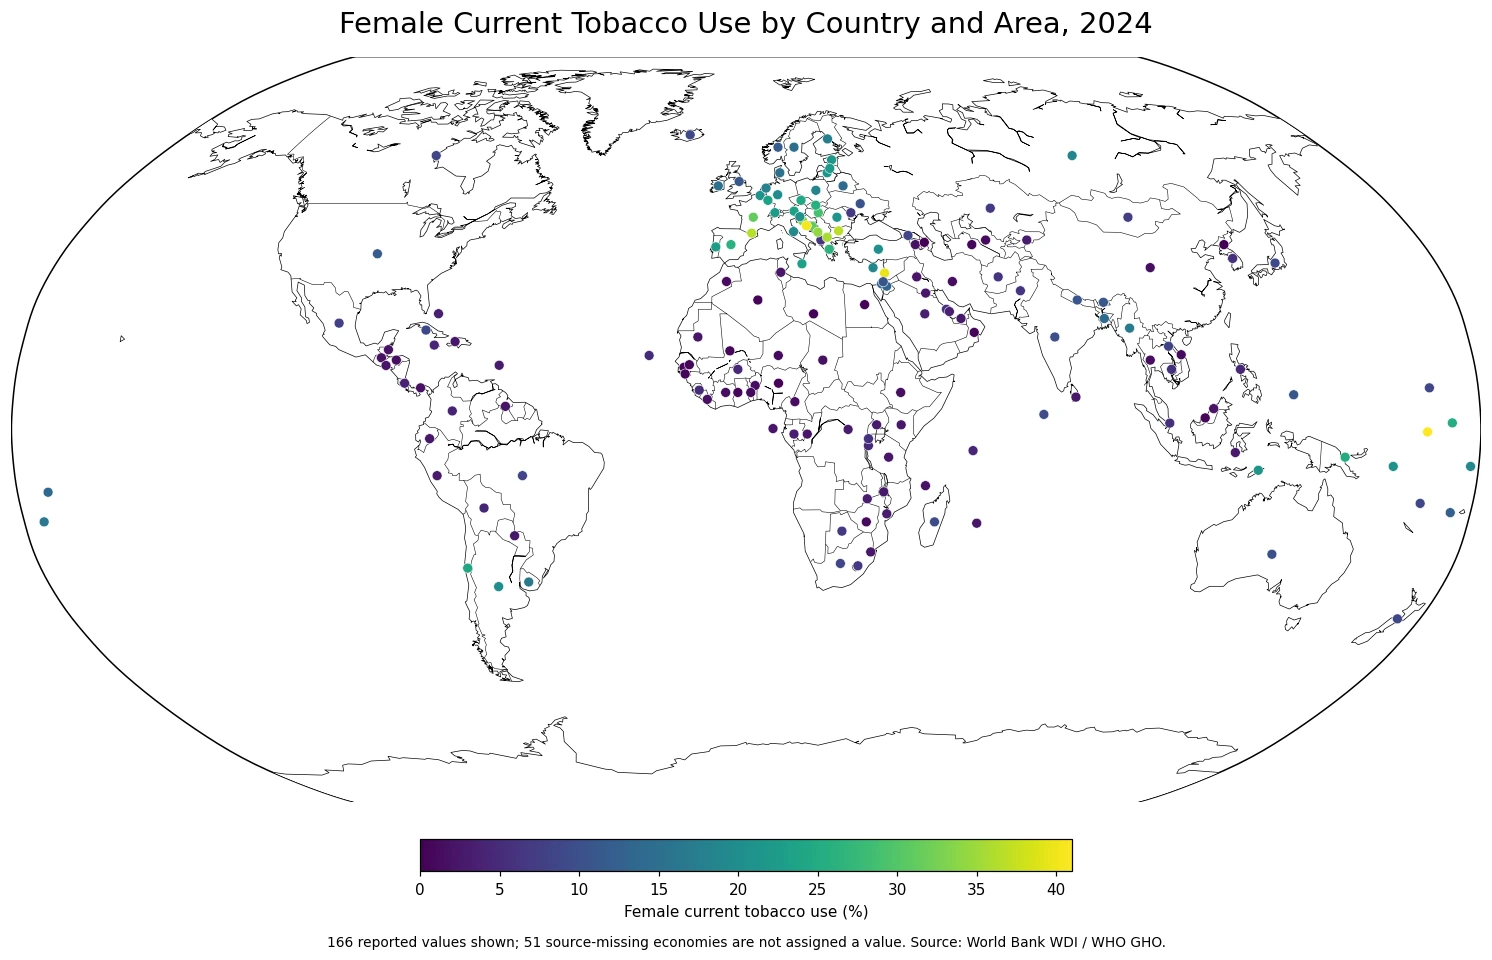
Table of Contents
Half of the reported values fall between about 2.33% and 16.68%
Treating every reporting country or area as one equally weighted observation, the first quartile is 2.33%, the median is 6.25%, and the third quartile is 16.68%. The mean is higher than the median because the upper end of the distribution contains a smaller group of values in the 20% to 40% range. This 10.18% mean is not a population-weighted global prevalence rate. A large country and a small territory each contribute one percentage to the calculation.
| 2024 female tobacco-use band | Countries and areas |
|---|---|
| Below 5% | 75 |
| 5 to <10% | 30 |
| 10 to <15% | 15 |
| 15 to <20% | 14 |
| 20 to <25% | 16 |
| 25 to <30% | 6 |
| 30 to <40% | 8 |
| 40% or more | 2 |
The largest group is below 5%, containing 75 observations. Another 30 values are between 5% and 10%, so 105 of the 166 reported observations are under 10%. At the other end, 32 observations are 20% or higher, ten are at least 30%, and only two reach 40%. The median therefore gives a much better sense of the middle of this country-level dataset than the highest values do.
Higher values stand out in the Balkans, parts of southern Europe, and several Pacific settings
The highest 2024 observation is 40.9% in the World Bank row labeled Naoero, followed by Serbia at 40.2% and Lebanon at 39.7%. Bulgaria is 36.7%, Andorra 36.4%, North Macedonia 35.7%, Montenegro 34.4%, and Croatia 33.6%. Bosnia and Herzegovina and France are both 31.2%. On the map, a group of relatively high values is visible across parts of the Balkans and southern Europe, while some Pacific island areas also sit well above the overall median.
Those geographic patterns do not identify a cause. The series contains no direct measure of tobacco taxes, retail prices, regulation, education, income, social norms, or the product mix used in each country. Because current tobacco use also includes smokeless tobacco, a high percentage cannot automatically be described as a high cigarette-smoking rate. The map answers where the standardized prevalence is higher or lower, not why the difference exists.
| Higher observation | Rate | Lower observation | Rate |
|---|---|---|---|
| Naoero | 40.9% | Azerbaijan | 0.1% |
| Serbia | 40.2% | Libya | 0.2% |
| Lebanon | 39.7% | Egypt, Arab Rep. | 0.4% |
| Bulgaria | 36.7% | Nigeria | 0.4% |
| Andorra | 36.4% | Oman | 0.4% |
A broad group of countries and areas is below 5%
At the low end, one numeric observation is reported as 0.0%. The next-lowest values include Azerbaijan at 0.1%, Libya at 0.2%, and Egypt, Nigeria, and Oman at 0.4%. Turkmenistan is 0.5%, while Algeria, Ghana, Guinea-Bissau, and Malaysia are each 0.6%. Low values appear across several parts of North and West Africa as well as sections of West and Central Asia, though the pattern is not uniform within any region.
Very small estimates should not be read as a literal count of users. A rounded 0.0% value is not the same statement as “no women use tobacco.” WHO produces comparable estimates from available survey evidence, and the published values are rounded percentages. Large differences and broad ranges are more reliable for comparison than treating tenths of a percentage point as exact league-table positions.
Current tobacco use is broader than female smoking prevalence
The indicator deliberately covers more than smoking. A woman who uses smokeless oral tobacco can be counted as a current tobacco user even if she does not smoke cigarettes, and occasional users are included alongside daily users. At the same time, tobacco-free e-cigarettes are outside the definition. Product patterns vary across countries, so two economies with similar percentages can still have very different mixtures of cigarettes, waterpipes, heated tobacco, or smokeless products.
The denominator is also specific: women ages 15 and older. This is not the prevalence for all adults combined, and it is not a measure of the number of female tobacco users. Comparing it with a total-population or male series requires checking that the year and definition match. The analysis here keeps the sex, age threshold, year, and World Bank/WHO definition fixed across the 166 reported 2024 values.
Age standardization improves comparability without eliminating every source of uncertainty
Tobacco use can differ sharply by age, and countries have very different age structures. WHO age-standardizes the estimates to a common reference population so that a country with an older or younger female population is not automatically pushed higher or lower simply because of that demographic mix. That makes the standardized series better suited to cross-country mapping than crude national percentages.
WHO also uses statistical modeling to produce comparable country and sex estimates from the available survey evidence. As a result, very small differences should not be treated as exact rankings. A gap between 6.2% and 6.5% provides context, but it does not mean every underlying national survey measured behavior with identical precision. Broad bands, regional clusters, and clearly separated values are the safer way to use the map.
The 51 source-missing rows remain missing rather than becoming zeros
The validated 2024 table contains 217 country and area rows, but only 166 have a numeric value. The other 51 are source-missing. They are excluded from the mean, median, quartiles, distribution counts, and map values. This matters because the table also contains a genuine numeric 0.0% observation. Replacing missing entries with zero would erase the difference between “no value reported” and an actual published estimate.
The same distinction matters for the mean. The 10.18% figure is the arithmetic mean of the 166 reported percentages, not the share of all women worldwide who currently use tobacco. A person-level global prevalence estimate needs population weighting or an official WHO global aggregate. The unweighted mean here is useful only for describing the distribution of country and area observations.
Tobacco prices can add context, but they answer a different question
Country cigarette-price data can be useful alongside prevalence because they describe part of the market environment. They are still not interchangeable with this series. A retail-price measure usually refers to a particular cigarette product and unit, while current tobacco use includes a broader set of smoked and smokeless products. A cross-sectional relationship between price and prevalence cannot establish that price caused the observed difference without additional evidence on taxes, regulation, income, product choice, and changes over time.
Source and calculation method
Country and area values come from World Bank World Development Indicators series SH.PRV.SMOK.FE for 2024. World Bank identifies the WHO Global Health Observatory as the original source. The measure is the age-standardized percentage of women ages 15 and older who currently use tobacco products on a daily or non-daily basis. All summary statistics on this page use the 166 numeric 2024 observations with equal country-area weight; the 51 source-missing rows are excluded from every calculation.
Frequently Asked Questions
Is female current tobacco use the same as female cigarette-smoking prevalence?
No. The indicator includes smoked and smokeless tobacco products and counts daily and non-daily users. Tobacco-free electronic products such as e-cigarettes are excluded.
What is the median across the 166 reported 2024 female tobacco-use observations?
The median is 6.25%. This is the median of country and area percentages, not a population-weighted global prevalence rate for women.
Why are the country rates age-standardized?
Countries have different age structures and tobacco use varies by age. Standardizing to the WHO reference population reduces the effect of those age-structure differences on cross-country comparison.
Were the 51 missing rows treated as 0%?
No. Missing values are different from a genuine 0.0% observation, so they remain missing and are excluded from the map statistics and distribution calculations.
Related Maps
Green Map creates custom-edited map images using open geographic data sources such as geoBoundaries, Natural Earth, OpenStreetMap, and government open data.
These maps are edited visual materials, not raw data files, and are provided for education, documents, presentations, and graphic reference.