Renewable fuel consumption associated with useful thermal output was highly uneven across U.S. states in 2024. In the EIA series used here, the 50 states and Washington, D.C. summed to about 795.1 million MMBtu. Georgia ranked first at 115.7 million MMBtu, followed by Alabama at 103.5. Together, those two states represented 27.6% of the 51-jurisdiction total. The metric is a fuel-consumption measure tied to useful thermal output, not a measure of renewable electricity generation or installed renewable capacity.
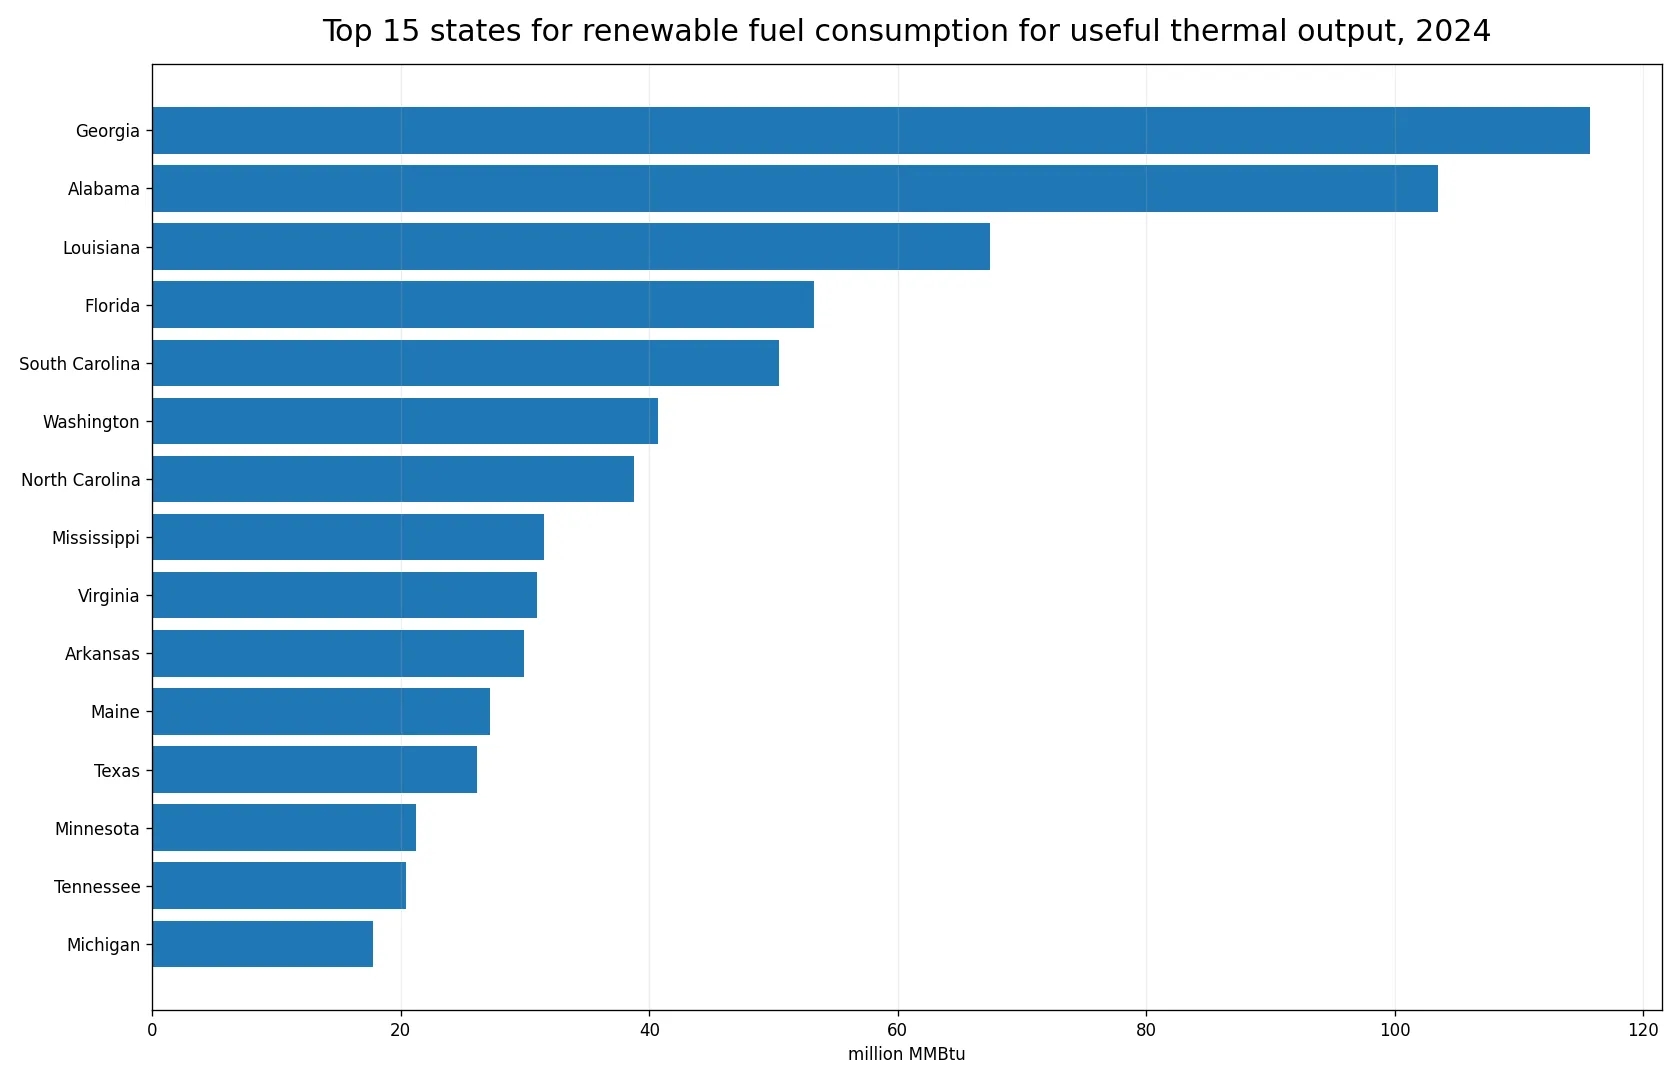
Table of Contents
What the EIA measure captures
The source series is labeled “Consumption of Fuels for Useful Thermal Output (BTUs) · all renewables.” That wording matters. It describes the energy content of fuels consumed for a specific useful-thermal-output measure in the EIA operational dataset. It should not be read as the amount of useful heat delivered, the renewable share of a state’s energy mix, or the amount of renewable electricity generated. Those questions require different variables and, in some cases, a different denominator.
All 51 observations refer to 2024 and use the same unit, million MMBtu. No conversion to a different energy unit is needed for the state ranking, so the published unit is retained throughout the table and charts. This also avoids creating a false sense of precision through unnecessary conversion. The analysis compares the values on a like-for-like basis, then calculates shares, the mean, the median, and concentration among the largest states.
Georgia and Alabama together represented more than one quarter
Georgia accounted for 14.6% of the total and Alabama for 13.0%. Their combined 219.2 million MMBtu was larger than the sum of many lower-ranked states. Louisiana placed third at 67.4, Florida fourth at 53.3, and South Carolina fifth at 50.5 million MMBtu. The top five together reached 390.3 million MMBtu, equal to 49.1% of the nationwide state total represented in this slice.
The gap between the largest states and the middle of the distribution is striking. Georgia’s value was about 53.7 times the median jurisdiction, while Alabama was about 48.0 times the median. Even the fifteenth-ranked state, Michigan, was far below the two leaders at 17.8 million MMBtu. This is a classic right-skewed distribution: a relatively small group of large observations has a disproportionate effect on the total and on the arithmetic mean.
The top 15 states in 2024
| Rank | State | Consumption (million MMBtu) | Share of total |
|---|---|---|---|
| 1 | Georgia | 115.71 | 14.6% |
| 2 | Alabama | 103.46 | 13.0% |
| 3 | Louisiana | 67.43 | 8.5% |
| 4 | Florida | 53.26 | 6.7% |
| 5 | South Carolina | 50.47 | 6.3% |
| 6 | Washington | 40.72 | 5.1% |
| 7 | North Carolina | 38.74 | 4.9% |
| 8 | Mississippi | 31.54 | 4.0% |
| 9 | Virginia | 30.95 | 3.9% |
| 10 | Arkansas | 29.90 | 3.8% |
| 11 | Maine | 27.14 | 3.4% |
| 12 | Texas | 26.10 | 3.3% |
| 13 | Minnesota | 21.23 | 2.7% |
| 14 | Tennessee | 20.46 | 2.6% |
| 15 | Michigan | 17.76 | 2.2% |
The cumulative pattern is as important as the individual ranking. The top 10 jurisdictions accounted for 70.7% of the total, and the top 15 reached 84.9%. That leaves only 15.1% for the other 36 jurisdictions. A national average therefore hides a great deal of geographic variation. For readers comparing states, it is more informative to pair the ranking with concentration measures than to focus on a single typical value.
The median was only 2.15 million MMBtu
The arithmetic mean across all 51 jurisdictions was 15.59 million MMBtu, but the median was just 2.15. In other words, the mean was roughly 7.2 times the median. The reason is not that the middle states are close to 15.6 and a few are slightly lower. Instead, many observations are clustered near the bottom while several very large states stretch the upper tail. For describing a state near the center of the distribution, the median is much more representative.
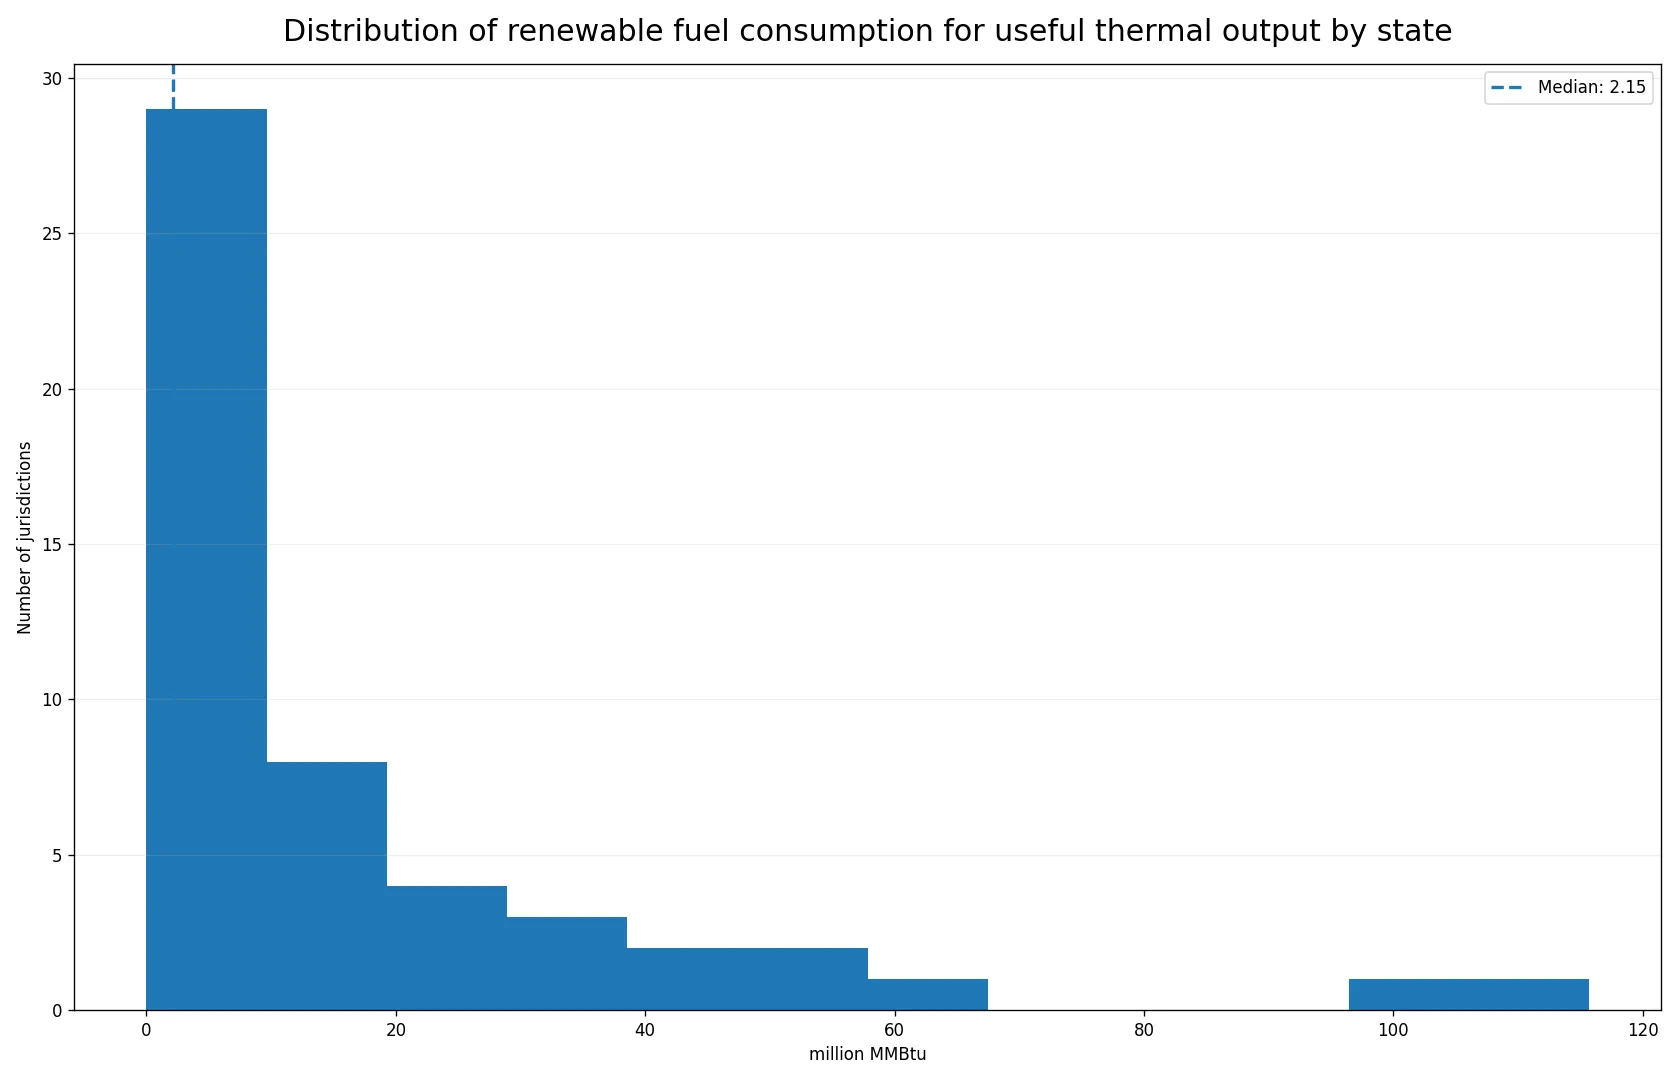
There were 28 jurisdictions at or above 1 million MMBtu and 22 at or above 10 million MMBtu. Only five reached 50 million MMBtu. At the positive-value low end, North Dakota recorded 0.018 million MMBtu, Nebraska 0.027, Illinois 0.053, Delaware 0.076, and Vermont 0.176. These small numbers should be interpreted narrowly: they describe this particular EIA measure, not the total scale of renewable activity in those states.
Eleven jurisdictions were reported at zero
Alaska, Arizona, Connecticut, Hawaii, Kansas, New Mexico, Nevada, Rhode Island, Utah, West Virginia, and Wyoming have a recorded value of zero in the 2024 dataset. Those zeros are preserved as published rather than replaced or imputed. A zero in this series should also not be generalized into “no renewable energy.” States can have renewable generation or other renewable energy use that is outside the definition of this particular fuel-consumption variable.
Zero is also different from missing. Each of the 51 jurisdictions has a row in the data used here, and the zero-valued rows contain numeric zeros rather than blank observations. That distinction matters for summary statistics. Removing those states would raise both the average and the median among positive observations and would answer a different question. Keeping them preserves the cross-sectional picture supplied for all states and the District of Columbia.
What the geographic concentration can and cannot tell us
The concentration itself is well supported by the data: about half of the measured total came from five jurisdictions and more than 70% came from the top 10. The dataset does not, however, contain the explanatory variables needed to assign a cause. It does not show the detailed renewable fuel mix, industrial structure, useful-heat demand, equipment efficiency, state policy, prices, or facility-level capacity. Any causal account would require additional evidence.
A productive next step would be to compare the same states with fuel-specific thermal-use data, combined heat and power indicators, renewable electricity generation, and industrial energy consumption. A multi-year version of the same series would also reveal whether the 2024 leaders are persistent or whether the ranking moves substantially over time. The present dataset is strongest as a precise answer to a narrower question: where was renewable fuel consumption for this useful-thermal-output measure largest in 2024?
Why absolute consumption is not an efficiency ranking
A large fuel-consumption value does not by itself indicate high or low efficiency. Efficiency requires a relationship between energy input and useful output, while this cross-section supplies one consumption value per jurisdiction. Nor does the ranking show renewable intensity, because there is no denominator such as total fuel consumption, total energy use, population, or economic output. A state could rank high in absolute consumption while ranking differently after normalization.
For the same reason, comparisons with population or state GDP should be calculated only after adding compatible data for the same year. This article does not estimate those normalized values. Keeping the absolute measure separate avoids mixing observed data with assumptions. Readers who need a per-capita or share-based view can use the state values here as the numerator and then add the relevant official denominator in a separate analysis.
Source and calculation method
The source is the U.S. Energy Information Administration Electricity / Electric Power Operational Data API. The 2024 extraction uses the `consumption-uto-btu` field with the all-renewables fuel group and contains 51 observations for the 50 states and Washington, D.C. State shares are each published value divided by the 51-jurisdiction total. Rankings, the mean, median, and cumulative top-group shares are calculated directly from those observations. Recorded zeros are retained, and no state values are estimated or filled from another source.
Frequently Asked Questions
Which state had the highest renewable fuel consumption for useful thermal output in 2024?
Georgia ranked first at about 115.7 million MMBtu, or 14.6% of the 51-jurisdiction total. Alabama ranked second at 103.5 million MMBtu.
Is this the same as renewable electricity generation?
No. The EIA series measures fuel consumption associated with useful thermal output. It is not a measure of renewable electricity generation, installed capacity, or renewable share.
Why is the mean so much higher than the median?
A small number of very large state values pull the mean upward. The mean was 15.59 million MMBtu, compared with a median of 2.15.
Related Articles
Green Map creates custom-edited map images using open geographic data sources such as geoBoundaries, Natural Earth, OpenStreetMap, and government open data. These maps are edited visual materials, not raw data files, and are provided for education, documents, presentations, and graphic reference.