How large is government support for one secondary student when it is compared with the economic resources available per person? The 2021 UNESCO Institute for Statistics (UIS) series answers that question by expressing initial government funding per secondary student as a percentage of GDP per capita. The same-year extract contains 71 countries and areas, with reported values ranging from 5.53% to 35.74%.
A value of 20% means that initial government funding per enrolled secondary student is equivalent to about one fifth of that country’s GDP per capita. It does not mean that 20% of national GDP is spent on each student, and it is not the share of the government budget assigned to secondary education. The numerator is a per-student funding amount; the denominator is GDP per capita.
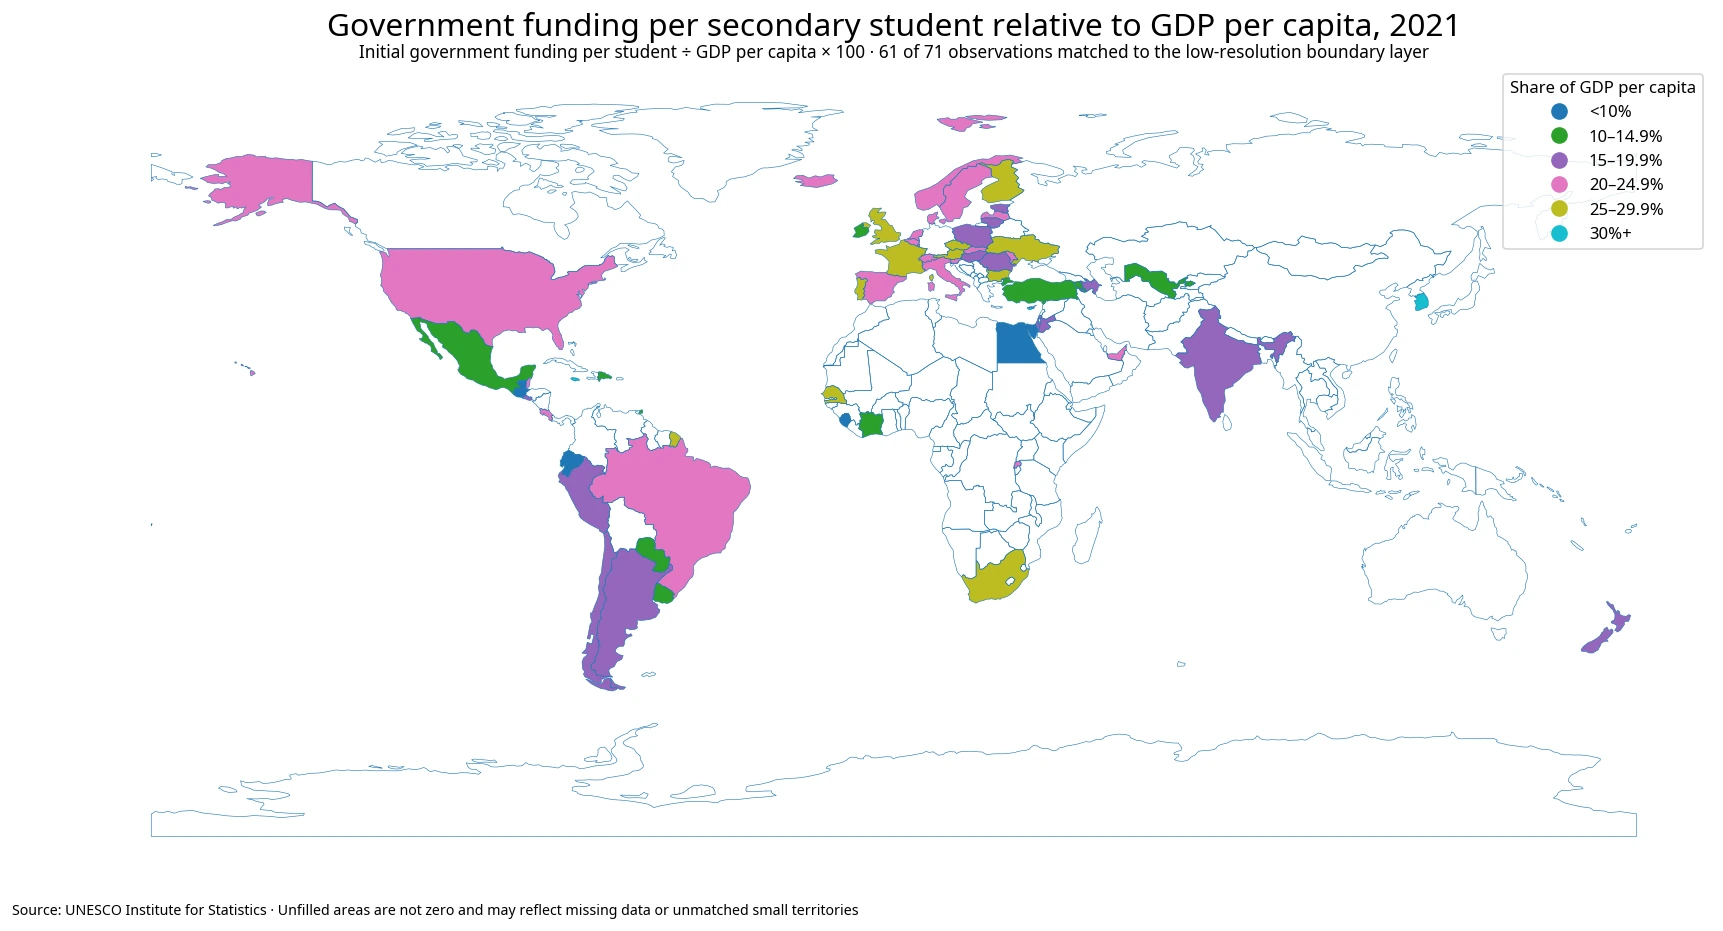
Table of Contents
The median across 71 observations is 20.67%
The country-equal mean is 20.02% and the median is 20.67%. The first quartile is 15.13% and the third quartile is 24.41%, placing the middle half of observations roughly between 15.1% and 24.4%. The center of the distribution is therefore around one fifth of GDP per capita, although the full range is much wider.
Five observations are below 10%, 12 are between 10% and 14.9%, 15 are between 15% and 19.9%, and 23 fall between 20% and 24.9%. Another 11 are between 25% and 29.9%, while five reach 30% or more. The 20–24.9% band is the single largest group.
The ratio improves comparability across economies because it scales student funding to an economic denominator, but it should not be confused with an absolute spending measure. A lower-income economy can record a high ratio with a smaller currency amount per student, while a high-income economy can spend much more in absolute terms and still record a moderate ratio.
The highest observations are in the 30% range, while the lowest are below 10%
The maximum observation is 35.74%. Cyprus reports 33.33%, Jamaica 32.70%, Mauritius 31.78% and Malta 30.51%. Portugal is at 29.22% and Senegal at 28.38%, followed by Ukraine and Austria at just above 26%. The upper end includes countries from several regions rather than one single geographic block.
| Rank | Country / area | Funding per secondary student / GDP per capita |
|---|---|---|
| 1 | Republic of Korea | 35.74% |
| 2 | Cyprus | 33.33% |
| 3 | Jamaica | 32.70% |
| 4 | Mauritius | 31.78% |
| 5 | Malta | 30.51% |
| 6 | Portugal | 29.22% |
| 7 | Senegal | 28.38% |
| 8 | Ukraine | 26.13% |
| 9 | Austria | 26.09% |
| 10 | Hong Kong SAR, China | 26.01% |
The Republic of Korea records 35.74% and ranks 1st in the 71-observation table. Because the denominator is GDP per capita, this result should not be converted into a claim that the country has the world’s highest secondary-school spending in currency terms or the best education outcomes.
At the lower end, Guatemala is at 5.53%, Ecuador 5.95% and Sierra Leone 7.29%. Egypt records 9.60% and the Cayman Islands 9.91%. Ireland and Türkiye are just above 10%, followed by Côte d’Ivoire and Monaco in the 11% range.
| Country / area | 2021 value |
|---|---|
| Guatemala | 5.53% |
| Ecuador | 5.95% |
| Sierra Leone | 7.29% |
| Egypt | 9.60% |
| Cayman Islands | 9.91% |
| Ireland | 10.42% |
| Türkiye | 10.54% |
| Côte d’Ivoire | 11.19% |
| Monaco | 11.40% |
| Uzbekistan | 12.17% |
Europe contains a broad 20% cluster, but neighboring countries can differ sharply
A large part of the mapped European coverage sits in the 20–29% range. France is at 25.18%, Belgium 24.42%, the Netherlands 23.15% and Switzerland 23.00%. Finland, Norway, Sweden and Denmark are also clustered in the low-to-mid 20s.
That regional pattern is not uniform. Portugal is 29.22% while neighboring Spain is 21.44%, a gap of almost 7.8 percentage points. Bulgaria is 25.73% compared with Romania at 18.42%. Latvia is 22.58% and Lithuania 17.70%. Czechia and Slovakia are closer, at 25.85% and 23.19%.
Ireland is a particularly strong local contrast. Its 10.42% value is far below the United Kingdom’s 25.15%. The ratio alone cannot identify why. Per-student government funding, GDP per capita, enrollment size, institutional structure and the division of financing responsibilities can all contribute to the observed difference.
African and Caribbean observations also show wide internal variation
The available African observations range from high values such as Mauritius at 31.78%, Senegal at 28.38%, South Africa at 25.80% and Rwanda at 24.63% to Côte d’Ivoire at 11.19%, Egypt at 9.60% and Sierra Leone at 7.29%. The sparse coverage does not support a single continental characterization.
The Caribbean and nearby small states are similarly mixed. Jamaica is one of the highest observations at 32.70%, Barbados is 20.64%, Belize 22.01%, the Cayman Islands 9.91% and Guatemala 5.53%. Small territories may have valid statistical observations without a separately visible polygon in the low-resolution world boundary layer.
Sixty-one of the 71 observations are mapped as country polygons. The other ten remain in the tables and summary statistics. They include small islands, territories and separately reported places such as Hong Kong that are not represented as independent polygons in this boundary layer. An unfilled area therefore must not be interpreted as a zero value.
A 20% value is not 20% of national GDP
The denominator is GDP per capita, not total GDP. A 20% observation means that government funding per secondary student is equivalent to 20% of average economic output per person. That is a fundamentally different calculation from government secondary-education expenditure as a percentage of GDP.
It is also different from education as a share of total government expenditure, total secondary-education spending, or spending per student in PPP dollars. Those indicators use different denominators and answer different fiscal questions. A country can rank differently across each measure without any contradiction.
The denominator can move over time even when education funding changes little. If GDP per capita rises faster than funding per student, the ratio can fall while the currency amount of student funding still increases. During a recession, the ratio could move upward partly because GDP per capita falls. One cross-section should not be interpreted as a permanent fiscal priority.
Enrollment size and the structure of secondary education matter
A per-student measure is linked to both the funding envelope and the number of enrolled students. Rapid enrollment growth can push the amount per student down if government funding does not rise at the same pace. A smaller or shrinking secondary cohort can have the opposite mechanical effect.
Secondary education systems also differ in duration, the balance of general and vocational programmes, teacher compensation, facility costs, local-government responsibilities and the public-private mix. The UIS ratio summarizes the resulting government funding per student but does not decompose these underlying drivers.
For policy analysis, this measure is most useful alongside enrollment, total public education expenditure, GDP per capita and spending-composition indicators. It supplies one important perspective: the size of government-origin funding available per secondary student relative to the country’s average economic resources per person.
A higher ratio is not an education-quality or efficiency score
Public resources are important for education, but this ratio does not measure learning outcomes, graduation rates, teacher quality, access, equity or spending efficiency. Two countries can report the same ratio while allocating their education budgets very differently across salaries, facilities, administration and student services.
A low ratio does not automatically demonstrate underfunding either. In a very high-income economy, a substantial absolute amount per student can still appear modest relative to GDP per capita. Absolute resource comparisons require a currency or purchasing-power measure rather than this economic-intensity ratio.
The map and tables should therefore be read as a 2021 comparison of funding intensity relative to GDP per capita, not a league table of the quality of national secondary-education systems.
Data source and calculation notes
Country values come from UNESCO Institute for Statistics indicator XUNIT.GDPCAP.2T3.FSGOV.FFNTR, “Initial government funding per secondary student as a percentage of GDP per capita,” using the 2021 NATIONAL observations in this comparison. The government source covers central, regional and local government funding, and the result is expressed as a percentage of GDP per capita.
- UNESCO UIS official API — XUNIT.GDPCAP.2T3.FSGOV.FFNTR
- UNESCO UIS education-finance material — funding per student relative to GDP per capita
The mean, median, quartiles and band counts are calculated directly from the 71 non-missing 2021 observations. Missing countries are not assigned zero. The low-resolution Natural Earth boundary layer matches 61 observations for the map, while all 71 remain in the statistical tables and calculations.
The strongest conclusion supported by this dataset concerns how government funding per secondary student compares with GDP per capita across reporting countries in the same year. Absolute spending amounts, education quality, long-term trends and the causes of cross-country differences require additional indicators.
Frequently Asked Questions
Does a value of 20% mean 20% of GDP is spent on one student?
No. It means initial government funding per secondary student is equivalent to about 20% of GDP per capita. The denominator is GDP per person, not total national GDP.
Does a higher value mean a better secondary-education system?
No. The ratio measures government funding intensity relative to GDP per capita. It does not measure learning outcomes, quality, equity or spending efficiency.
Do unfilled countries on the map have zero government funding?
No. A country may lack a 2021 observation or a small territory may not have a separate polygon in the low-resolution boundary layer. Missing values are never filled with zero.
Can this ratio be converted directly into actual spending per student?
Not by itself. A monetary amount requires a compatible GDP-per-capita value and the same measurement basis. PPP spending per student is a separate indicator.
Related Articles
- Government Education Spending as % of GDP | World Map
- Tertiary Education Government Spending 2022 | PPP$
- Public Primary Capital Expenditure Share 2021 | 4 at 20%+
Green Map creates custom-edited map images using open geographic data sources such as geoBoundaries, Natural Earth, OpenStreetMap, and government open data.
These maps are edited visual materials, not raw data files, and are provided for education, documents, presentations, and graphic reference.