Government spending on tertiary education varies enormously in absolute size. The UNESCO Institute for Statistics (UIS) indicator X.PPP.5T8.FSGOV expresses this spending in millions of purchasing-power-parity dollars. Across the 76 countries and areas with a 2022 observation, Germany reported the largest amount at PPP$73,602.1 million, or about PPP$73.6 billion. France followed at PPP$46.0 billion, Brazil at PPP$41.0 billion, and Türkiye at PPP$35.1 billion.
The median across the 76 observations is PPP$1,860.7 million, while the mean is PPP$7,497.6 million. That fourfold gap between the mean and median is an immediate sign that a relatively small number of very large systems pull the average upward. The first quartile is about PPP$395.0 million and the third quartile is PPP$9,874.5 million, so even the middle half of the reported values spans a very wide range.
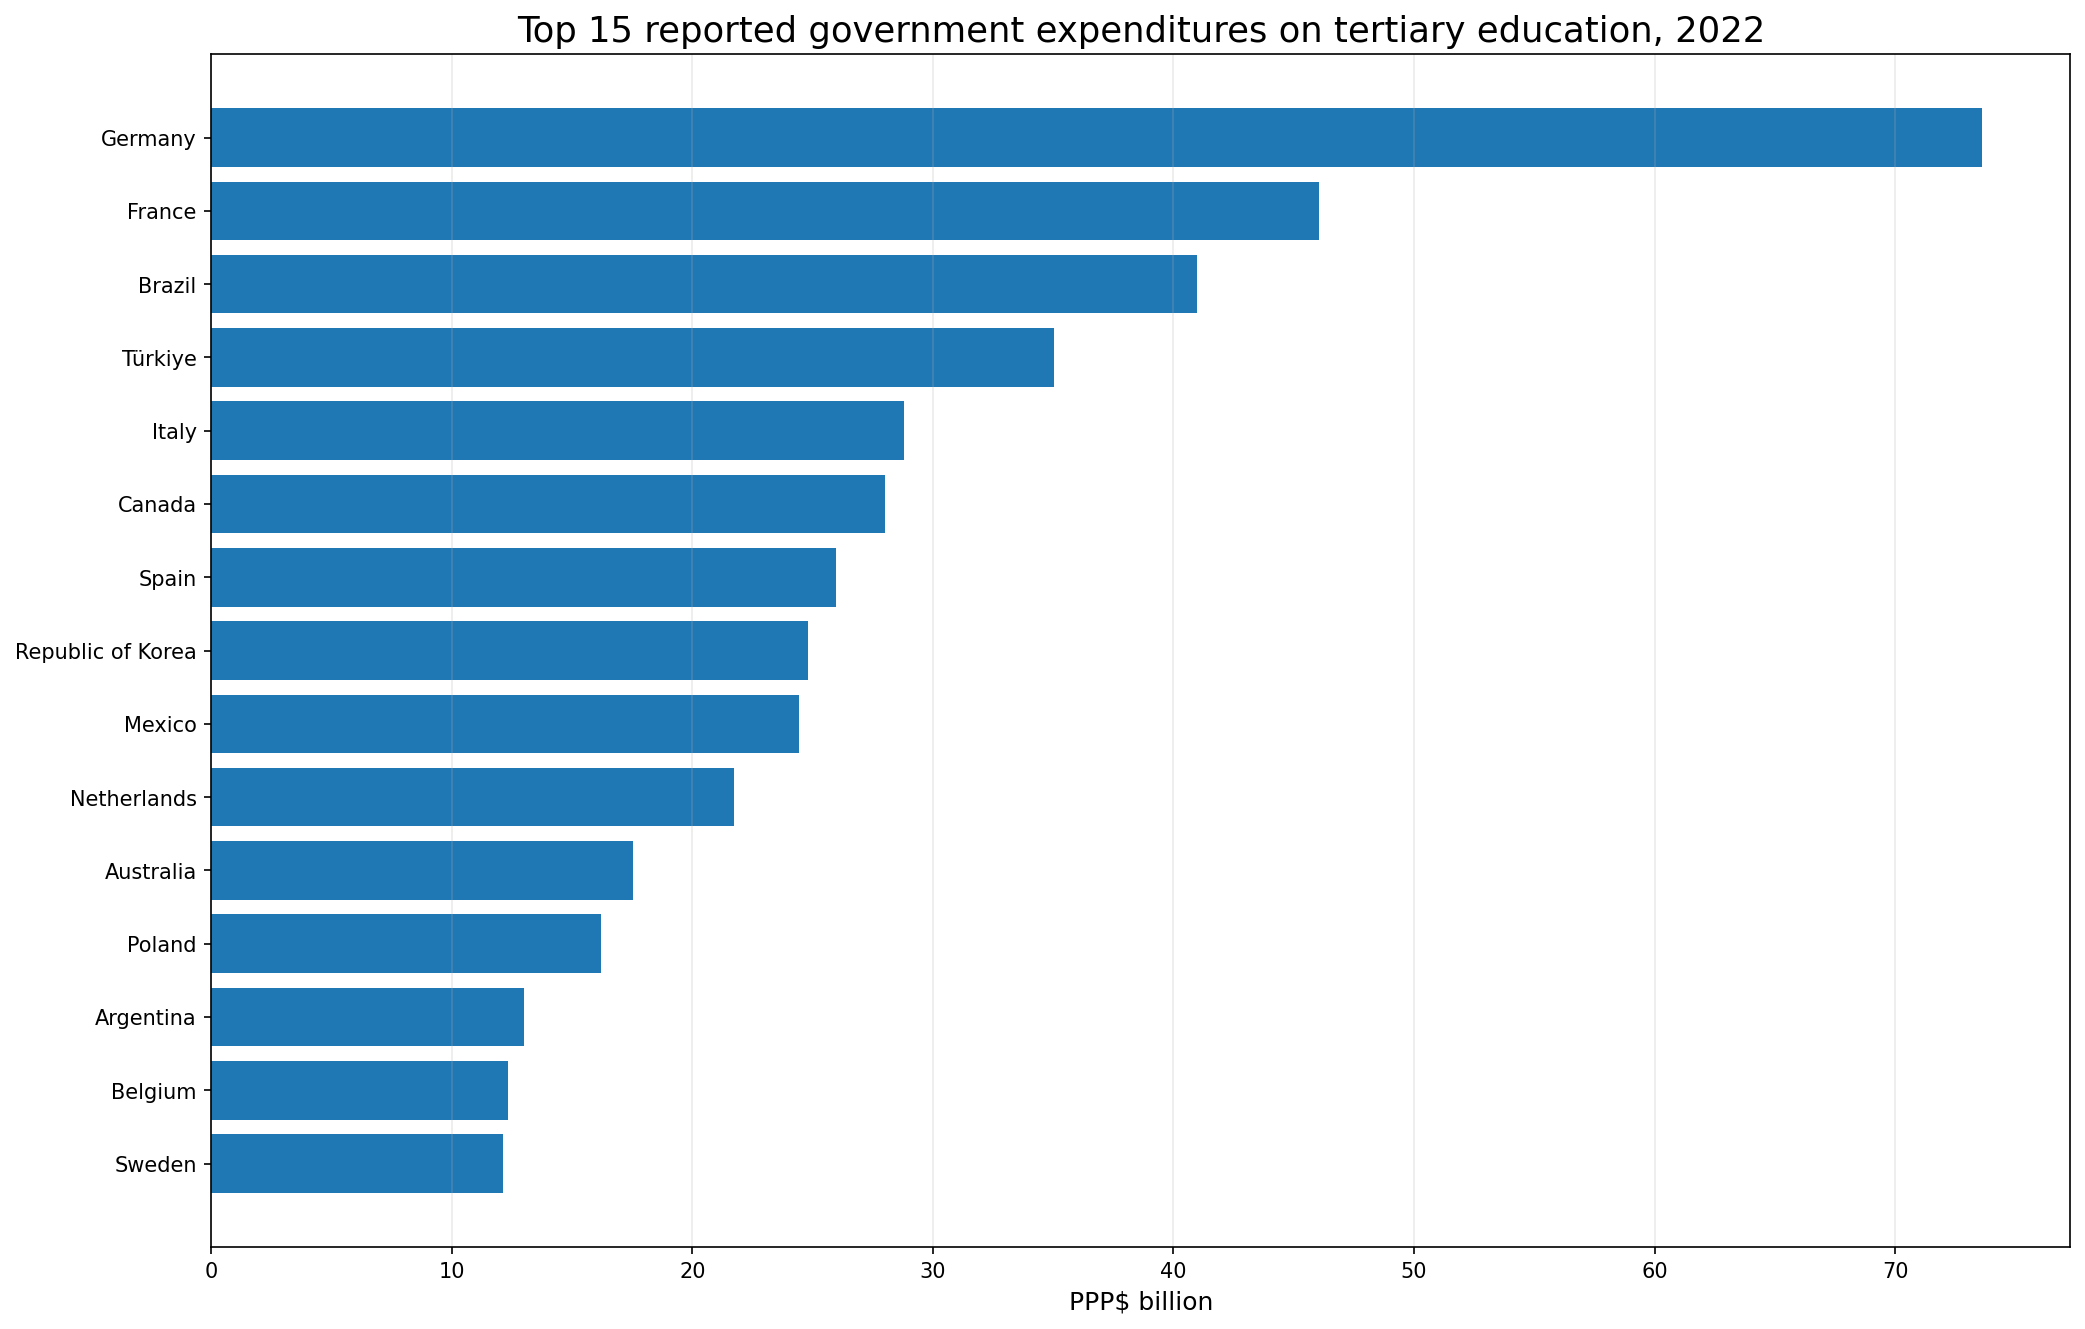
Table of Contents
What this PPP spending indicator measures
The measure is an absolute government-expenditure total, not an amount per student. It is also expressed in purchasing-power-parity dollars rather than converted at a simple market exchange rate. PPP units are intended to make monetary amounts more comparable across economies with different price levels. They help with cross-country scale comparisons, but they do not remove differences in population, enrollment, the size of the tertiary system, or the public sector’s role in financing higher education.
That distinction changes how the ranking should be read. A large country can record a high total even if its spending per student is moderate, simply because it serves many students and operates a large tertiary sector. A small country can have a low total while still spending heavily relative to its economy or per learner. This indicator is therefore best understood as the size of the public tertiary-education spending envelope, not as a direct score of generosity, quality, efficiency, or educational outcomes.
The median was PPP$1.86 billion, far below the mean
The 2022 median of PPP$1.86 billion describes the midpoint of the 76 reported observations. The average, at roughly PPP$7.50 billion, is much higher because the distribution has a long upper tail. If the mean alone were used as the idea of a ‘typical’ country, it would overstate the scale faced by most observations. The median is less sensitive to the handful of systems with tens of billions of PPP dollars in government spending.
The band counts make the shape clearer. Seven observations are below PPP$100 million; 21 are between PPP$100 million and PPP$999 million; 24 are between PPP$1.0 billion and PPP$4.999 billion; 14 are between PPP$5.0 billion and PPP$19.999 billion; and 10 are at PPP$20 billion or more. The largest single group lies between PPP$1 billion and PPP$5 billion, yet the full range stretches from about PPP$1.6 million to PPP$73.6 billion.
Germany led the reported totals, followed by France and Brazil
Germany’s reported PPP$73.6 billion was the largest 2022 observation. France was second at PPP$46.0 billion and Brazil third at PPP$41.0 billion. Türkiye reported PPP$35.1 billion, followed by Italy at PPP$28.8 billion, Canada at PPP$28.0 billion, and Spain at PPP$26.0 billion. The difference between Germany and France alone is about PPP$27.6 billion, which is larger than the entire reported total of many countries in the dataset.
| Rank | Country or area | Government expenditure (PPP$ millions) |
|---|---|---|
| 1 | Germany | 73,602.1 |
| 2 | France | 46,031.4 |
| 3 | Brazil | 40,969.3 |
| 4 | Türkiye | 35,053.6 |
| 5 | Italy | 28,801.0 |
| 6 | Canada | 27,992.4 |
| 7 | Spain | 25,976.9 |
| 8 | Republic of Korea | 24,800.0 |
| 9 | Mexico | 24,431.0 |
| 10 | Netherlands | 21,710.5 |
The top 10 reported values account for about 61.3% of the sum of all 76 reported observations, while the top five account for about 39.4%. Those percentages are concentration measures within the observed dataset, not shares of a complete world total. Countries without a 2022 observation are left missing rather than assigned zero, so the denominator is the sum of the 76 available values only.
A high total does not imply high spending per student
Absolute spending and spending intensity answer different questions. A country with a large university system can have a high national total even if its per-student expenditure is not especially high. Conversely, a small tertiary system can appear near the bottom of an absolute ranking while devoting substantial resources to each student. To judge spending intensity, the absolute PPP total should be paired with a denominator such as tertiary enrollment, population, GDP, or total government expenditure.
The Republic of Korea reported about PPP$24.8 billion in 2022, placing it among the larger totals in this 76-observation set. That figure does not tell us whether public funding per tertiary student is higher or lower than in Germany, Canada, or any other country. Answering that question would require enrollment or a dedicated per-student spending indicator for the same year and definition.
PPP improves monetary comparability but is not a performance score
Market exchange rates can move sharply and can make domestically purchased education services look unusually cheap or expensive when converted into ordinary dollars. PPP conversion is designed to compare purchasing power across economies, which is useful for expenditures dominated by local wages, services, facilities, and operating costs. It gives a more economically comparable unit than a simple currency conversion for many cross-country spending questions.
Still, PPP conversion does not make education systems identical. The composition of tertiary education, the mix of public and private institutions, staffing models, program structures, and student populations can differ substantially. The indicator also does not measure what was achieved with the money. It should not be used on its own to rank teaching quality, research quality, access, completion rates, or the efficiency of public spending.
Very small totals often belong to very small systems
At the lower end, the Marshall Islands reported about PPP$1.6 million, the Turks and Caicos Islands PPP$4.2 million, San Marino PPP$5.7 million, Andorra PPP$6.7 million, and the Cayman Islands PPP$7.6 million. These totals are thousands of times smaller than Germany’s, but that gap should not be turned into a judgment about commitment to education. Population size and the scale of the local tertiary system can heavily influence an absolute expenditure figure.
For that reason, the bottom of the ranking is best described as the set of places with the smallest reported totals, not the places that ‘care least’ about tertiary education. A policy comparison requires a denominator. GDP shares can show the burden relative to the economy, government-budget shares can show fiscal priority, and per-student measures can show the resources associated with each learner. The absolute total remains useful, but it answers a narrower question.
Why the median and quartiles matter more than a single average
Germany’s value is roughly 39.6 times the median observation. When a distribution contains values that large relative to its center, the arithmetic mean is pulled upward and becomes less representative of the majority. Reporting the median, quartiles, and broad spending bands makes the comparison more resistant to the influence of a few very large systems.
The middle 50% of observations lies between about PPP$395 million and PPP$9.87 billion. Even within that central band, the upper end is roughly 25 times the lower end. This spread shows why a simple league table can hide more than it reveals: the dataset contains very different scales of tertiary systems, and adjacent rank positions do not necessarily represent similar fiscal contexts.
Useful companion measures for interpreting the totals
If the question is how much priority a government gives tertiary education, three companion measures are especially useful. Spending as a share of GDP relates tertiary expenditure to the size of the economy. Spending as a share of total government expenditure relates it to the public budget. Spending per tertiary student adjusts for the number of learners. Each denominator changes the question, so none of these measures should be treated as a substitute for the absolute PPP total.
The absolute total is most useful for understanding the overall public-finance scale of tertiary education and for building later comparisons with enrollment or economic size. It can help distinguish very large national systems from small ones and show how concentrated the reported spending amounts are. It cannot, by itself, answer whether a system is efficient, adequately funded, equitable, or producing stronger outcomes.
Coverage is 76 countries and areas, not a complete world total
The 2022 extract contains 76 country and area observations. Countries without a reported value are not assigned zero, and the dataset should not be read as though every country in the world were represented. As a result, the sum of the reported values is not a global total and the top-10 concentration figure is not a global market share. Both calculations describe only the set of observations available for the same year.
The absence of a value also should not be given a guessed explanation. A missing observation may reflect reporting schedules, statistical availability, or other factors that require separate evidence. This comparison keeps missing countries outside the numeric ranking and limits interpretation to the values supplied for 2022.
Data source and calculations
The country and area values come from the UNESCO Institute for Statistics X.PPP.5T8.FSGOV indicator for 2022. The published values are used directly in millions of PPP dollars. The median (1,860.7), mean (7,497.6), quartiles, spending-band counts, and concentration shares are calculated from the 76 reported observations.
No conversion to per-student spending, GDP share, or budget share is applied. Missing countries remain missing rather than being filled with zero. Ranks are used only to describe the size of the reported totals; small differences in rank are not interpreted as differences in policy quality or educational performance.
Frequently Asked Questions
Is this government spending per tertiary student?
No. It is the total government expenditure on tertiary education expressed in millions of PPP dollars. A separate per-student measure or enrollment denominator is needed for spending per learner.
Which country had the largest reported total in 2022?
Germany had the largest value among the 76 reported observations at about PPP$73.6 billion, followed by France and Brazil.
Why are the values expressed in PPP dollars?
Purchasing-power-parity units are designed to improve cross-country monetary comparisons by accounting for differences in price levels. They do not remove differences in country size or enrollment.
Does a missing country mean government spending was zero?
No. Countries without a 2022 observation are treated as missing, not zero. The 76 reported values therefore do not constitute a complete world total.
Related Articles
- Government Education Spending as a Share of GDP
- Post-Secondary Attainment for Adults 25+
- Bachelor’s-or-Higher Educational Attainment by Country
Green Map creates custom-edited map images using open geographic data sources such as geoBoundaries, Natural Earth, OpenStreetMap, and government open data.
These maps are edited visual materials, not raw data files, and are provided for education, documents, presentations, and graphic reference.