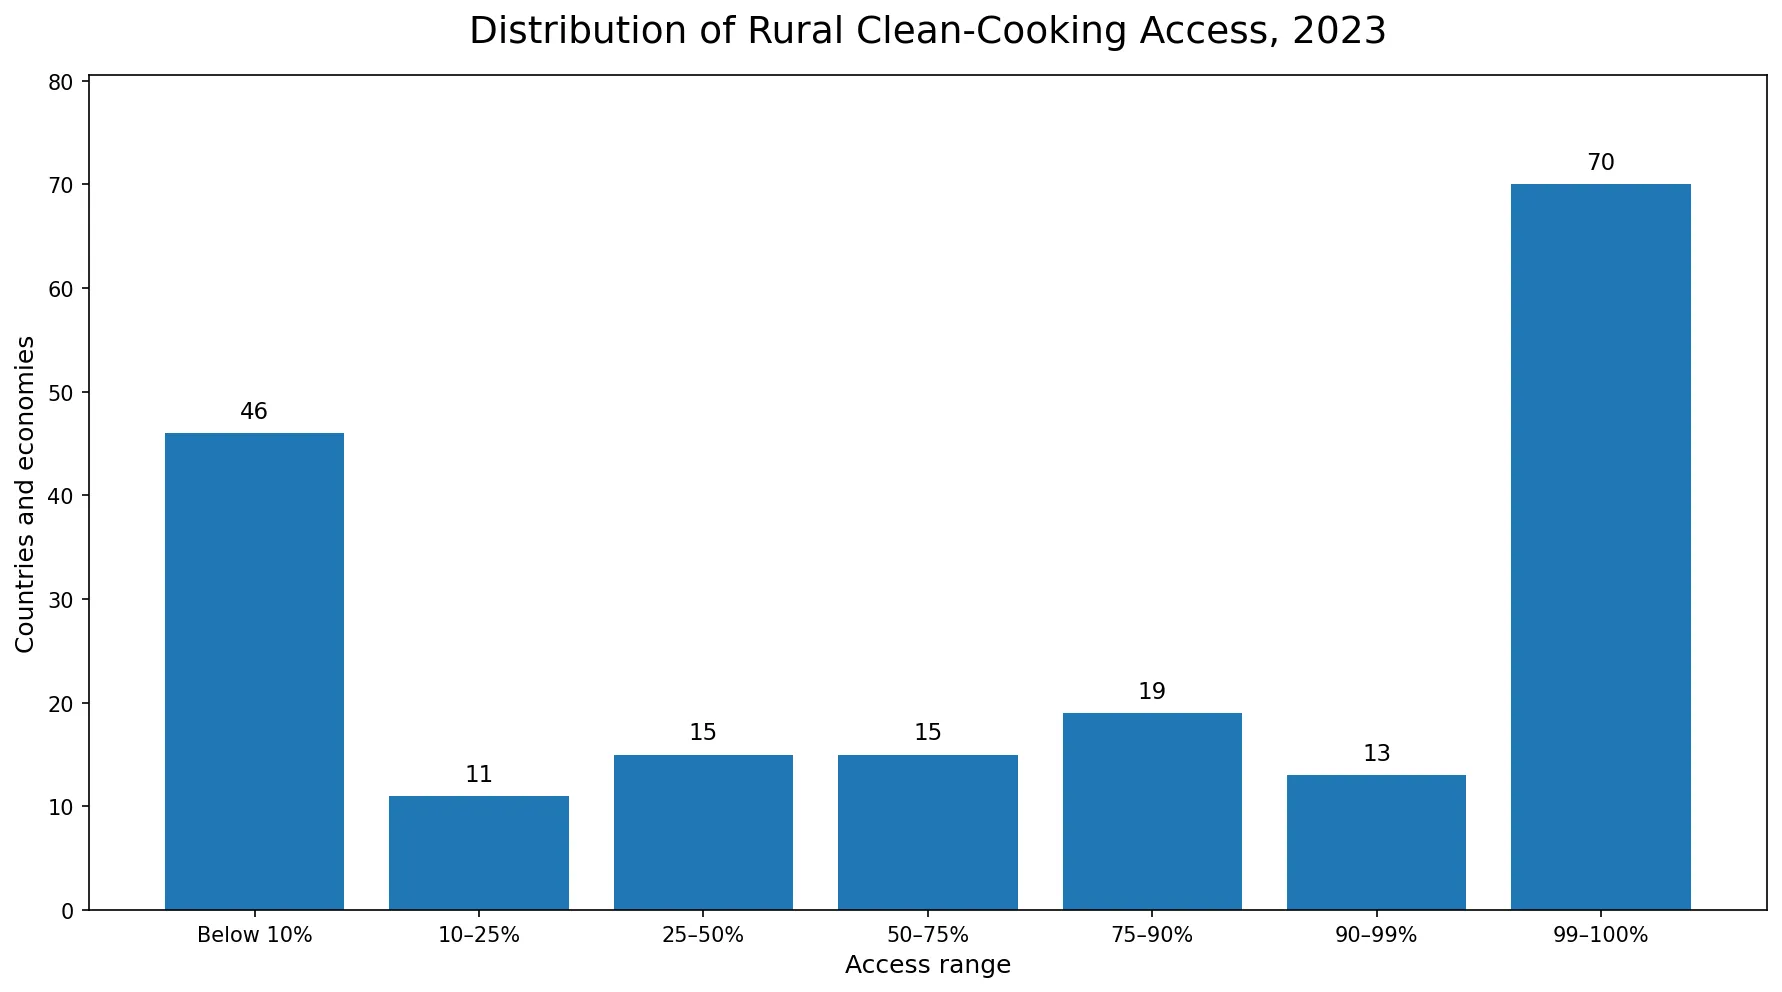
Rural access tells a different story from a national clean-cooking average. In the verified 2023 World Bank file, 46 of 189 countries and economies, or 24.3%, report rural access below 10%. At the opposite end, 70 observations are at 99% or higher. The distribution therefore contains both near-universal rural access and extremely low access at the same time.
This article uses World Bank WDI series EG.CFT.ACCS.RU.ZS, whose denominator is the rural population. It is not a duplicate of the total-population clean-cooking indicator EG.CFT.ACCS.ZS. Rather than repeating a country ranking, the analysis focuses on how the rural-only observations are distributed, why the median and mean diverge, and how to read the low and high ends without inventing causes that are not present in the dataset.
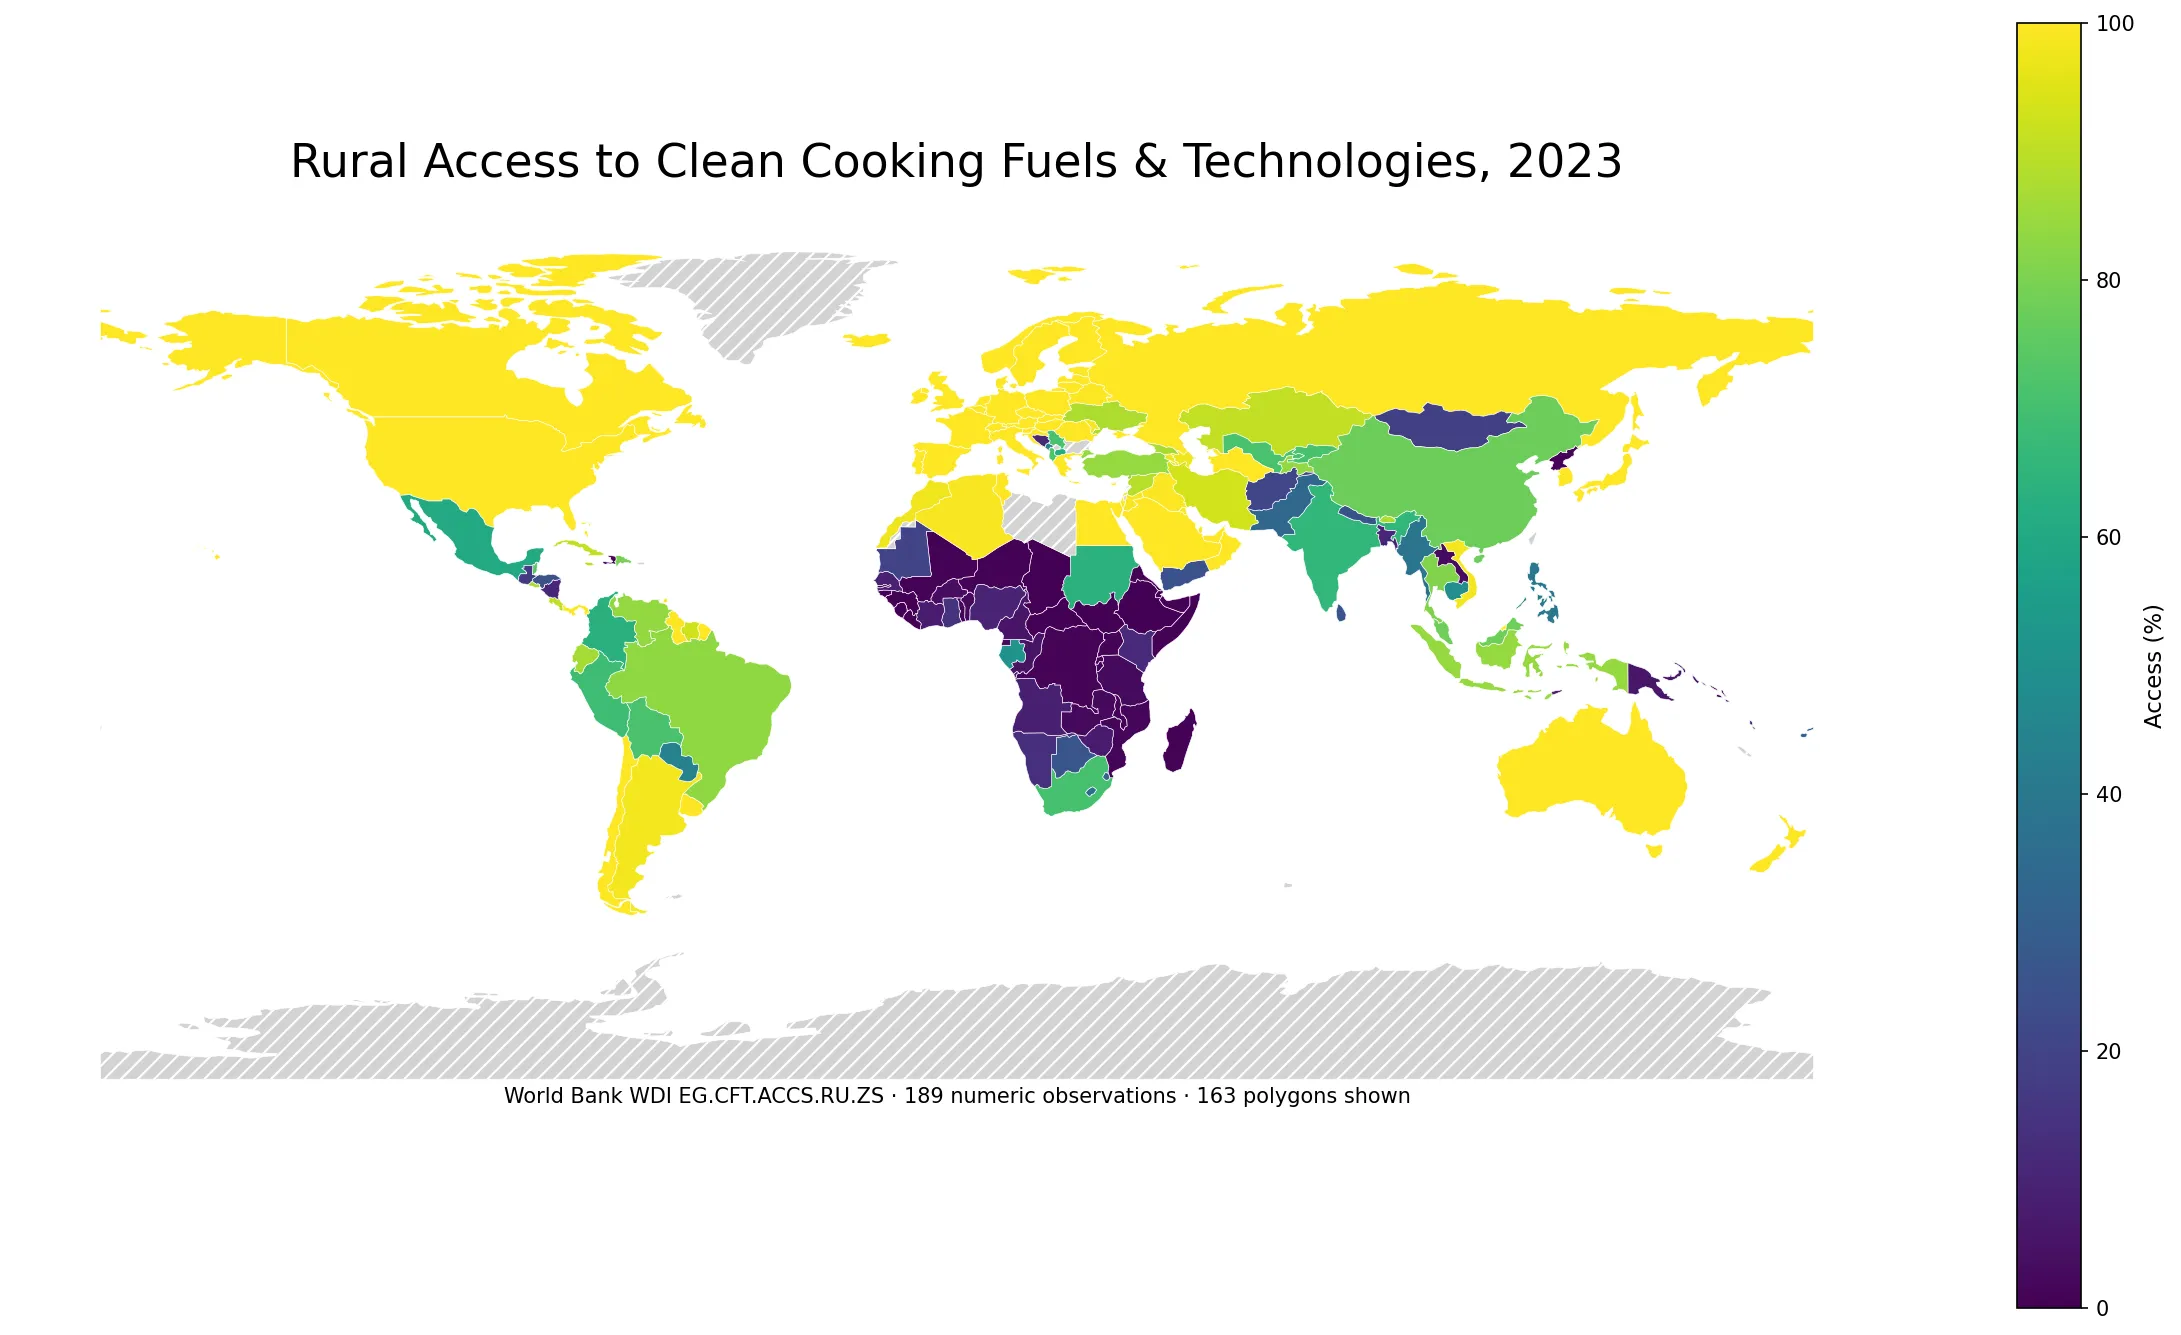
Table of Contents
One quarter of the observations are below 10%
Grouping the 189 observations into fixed access bands makes the shape of the dataset easier to see. Forty-six are below 10%, another 11 are between 10% and 25%, and 15 are between 25% and 50%. Altogether, 72 countries and economies are below 50%. The upper end is just as notable: 70 observations fall between 99% and 100%.
| Rural access range | Countries/economies | Share of 189 |
|---|---|---|
| Below 10% | 46 | 24.3% |
| 10–25% | 11 | 5.8% |
| 25–50% | 15 | 7.9% |
| 50–75% | 15 | 7.9% |
| 75–90% | 19 | 10.1% |
| 90–99% | 13 | 6.9% |
| 99–100% | 70 | 37.0% |
Why a rural denominator changes the question
A national percentage combines urban and rural residents. Because countries have very different urban-rural population structures, the national percentage does not directly tell us what conditions look like outside cities. EG.CFT.ACCS.RU.ZS addresses that limitation by using only the rural population as the denominator. The question is therefore not “what share of the whole country has clean cooking access?” but “what share of the rural population primarily uses qualifying clean fuels and technologies for cooking?”
The word “clean” also has a technical meaning. The WHO Clean Household Energy Solutions Toolkit evaluates fuel-and-technology combinations against health-based emission criteria, including fine particulate matter and carbon monoxide. Electricity, natural gas, LPG, biogas, alcohol fuels and solar cooking can qualify; kerosene is not classified as a clean cooking fuel under this framework.
Why the median is 83.8% while the mean is only 61.6%
When every country or economy is counted once, without weighting by rural population size, the 2023 median is 83.8% and the arithmetic mean is 61.6%. The 22.2 percentage-point difference does not mean that 83.8% of the world’s rural population has access. These are unweighted descriptive statistics for the 189 country/economy observations.
The gap between the mean and median comes from the unusually wide distribution. The 25th percentile is 10.8%, while the 75th percentile is 100.0%. Many observations are clustered at the ceiling, yet a substantial lower tail sits near zero. For this dataset, the full distribution says more than a single “global average” calculated across countries of very different population sizes.
The middle bands contain very different economies
The 50–90% range includes countries from several regions and income levels. Indonesia is at 84.1%, Brazil 83.4%, China 77.4%, South Africa 70.4%, India 65.7% and Mexico 60.3%. These figures should not be interpreted as a ranking of development or energy-system quality. The indicator directly measures the rural share primarily using clean cooking fuels and technologies; it does not identify the causal mechanism behind each country’s value.
| Country/economy | 2023 rural access | Band |
|---|---|---|
| Indonesia | 84.1% | 75–90% |
| Brazil | 83.4% | 75–90% |
| China | 77.4% | 75–90% |
| South Africa | 70.4% | 50–75% |
| India | 65.7% | 50–75% |
| Mexico | 60.3% | 50–75% |
| Philippines | 39.9% | 25–50% |
| Bangladesh | 10.8% | 10–25% |
Fuel prices, LPG distribution, electricity reliability, appliance costs, household income, road access, policy design and cooking practices can all matter in country-specific research. None of those variables is contained in the cleaned file used here. The analysis therefore stops at the verified access percentages instead of attributing low or high values to an unmeasured cause.
Below 10% is a data range, not a complete description of household life
At the low end, Central African Republic, Guinea-Bissau, Liberia, South Sudan and Sierra Leone are reported at 0.0%. Ethiopia is at 0.3%, Uganda 0.8%, Angola 8.4% and Nigeria 9.7%. A value near zero does not mean every rural household uses the same fuel. It means only that a very small share of the rural population is estimated to primarily use fuels and technologies that meet the clean-cooking definition.
A reported 0.0% must also be distinguished from a missing value. The statistical analysis contains 189 numeric observations for 2023. Economies without a 2023 value are not backfilled from older years. Some small islands and territories can have a numeric observation but still be absent as a visible polygon in the low-resolution map layer, so “not visible on the map” is not equivalent to zero.
At 99–100%, ranking becomes less useful than grouping
Sixty-one observations are exactly 100.0%, and 70 are at least 99%. In a dataset with such a large ceiling cluster, separating 99.8% from 100.0% into fine rank positions can imply more precision than the comparison needs. A more useful interpretation is that these countries and economies are in a near-universal rural-access group for this indicator.
The upper cluster also explains why a simple ranking would make this article look too similar to the national clean-cooking article. The more distinctive finding is the two-ended distribution: 37.0% of the observations are at 99–100%, while 24.3% are below 10%. That contrast is the main reason this rural-only series deserves its own visualization.
How to use this with the total-population indicator
The related total-population clean-cooking access map uses World Bank series EG.CFT.ACCS.ZS. This article uses EG.CFT.ACCS.RU.ZS. The different denominator and official indicator code are the key distinction. Reading the two pages together can show whether a country’s rural-only value appears materially different from its national value, but the percentages should not automatically be subtracted and labelled an urban-rural gap.
A formal urban-rural gap calculation would require a compatible urban-only series or matching urban and rural population weights for the same year and methodology. Those additional inputs are not part of this completed package. This page therefore treats the rural series as its own verified dataset rather than constructing an unsupported derived statistic.
Data source, map coverage and calculation method
The underlying values come from the World Bank indicator Access to clean fuels and technologies for cooking, rural (% of rural population), code EG.CFT.ACCS.RU.ZS. Only 2023 observations are used. Regional and income-group aggregates are excluded, and missing values are not replaced with observations from earlier years.
The mean, median, quartiles and access-band counts are calculated directly from the packaged cleaned CSV. ISO-3 identifiers are joined to a low-resolution world boundary layer for the map. Of the 189 numeric observations used in the statistics, 163 are directly represented as polygons. The table and distribution chart still include all 189 numeric observations, including small economies that may not appear as separate shapes on the map.
Frequently Asked Questions
How is this different from the total-population clean-cooking indicator?
This page uses EG.CFT.ACCS.RU.ZS, which measures the rural population only. The total-population article uses EG.CFT.ACCS.ZS, so the denominator and official World Bank indicator code are different.
How many 2023 observations are below 10% rural access?
Among the 189 numeric country and economy observations, 46 are below 10%. At the other end, 70 are at 99% or higher.
Does the 83.8% median mean 83.8% of the world rural population has access?
No. It is the unweighted median across 189 country and economy observations. It is not a rural-population-weighted global access rate.
Does a country missing from the visible map have a zero value?
Not necessarily. The statistics use 189 numeric observations, while 163 are represented by polygons in the low-resolution map layer. Small islands and territories can have data without a separately visible polygon.
Related Articles
Use these pages to place the rural-only series beside national clean-cooking access and other energy-access indicators.
- Global Clean Cooking Access Map – 2023 Country Comparison
- Global Electricity Access Map – Country Comparison
- Global Renewable Energy Share Map – Final Energy Consumption
Green Map creates custom-edited map images using open geographic data sources such as geoBoundaries, Natural Earth, OpenStreetMap, and government open data.
These maps are edited visual materials, not raw data files, and are provided for education, documents, presentations, and graphic reference.