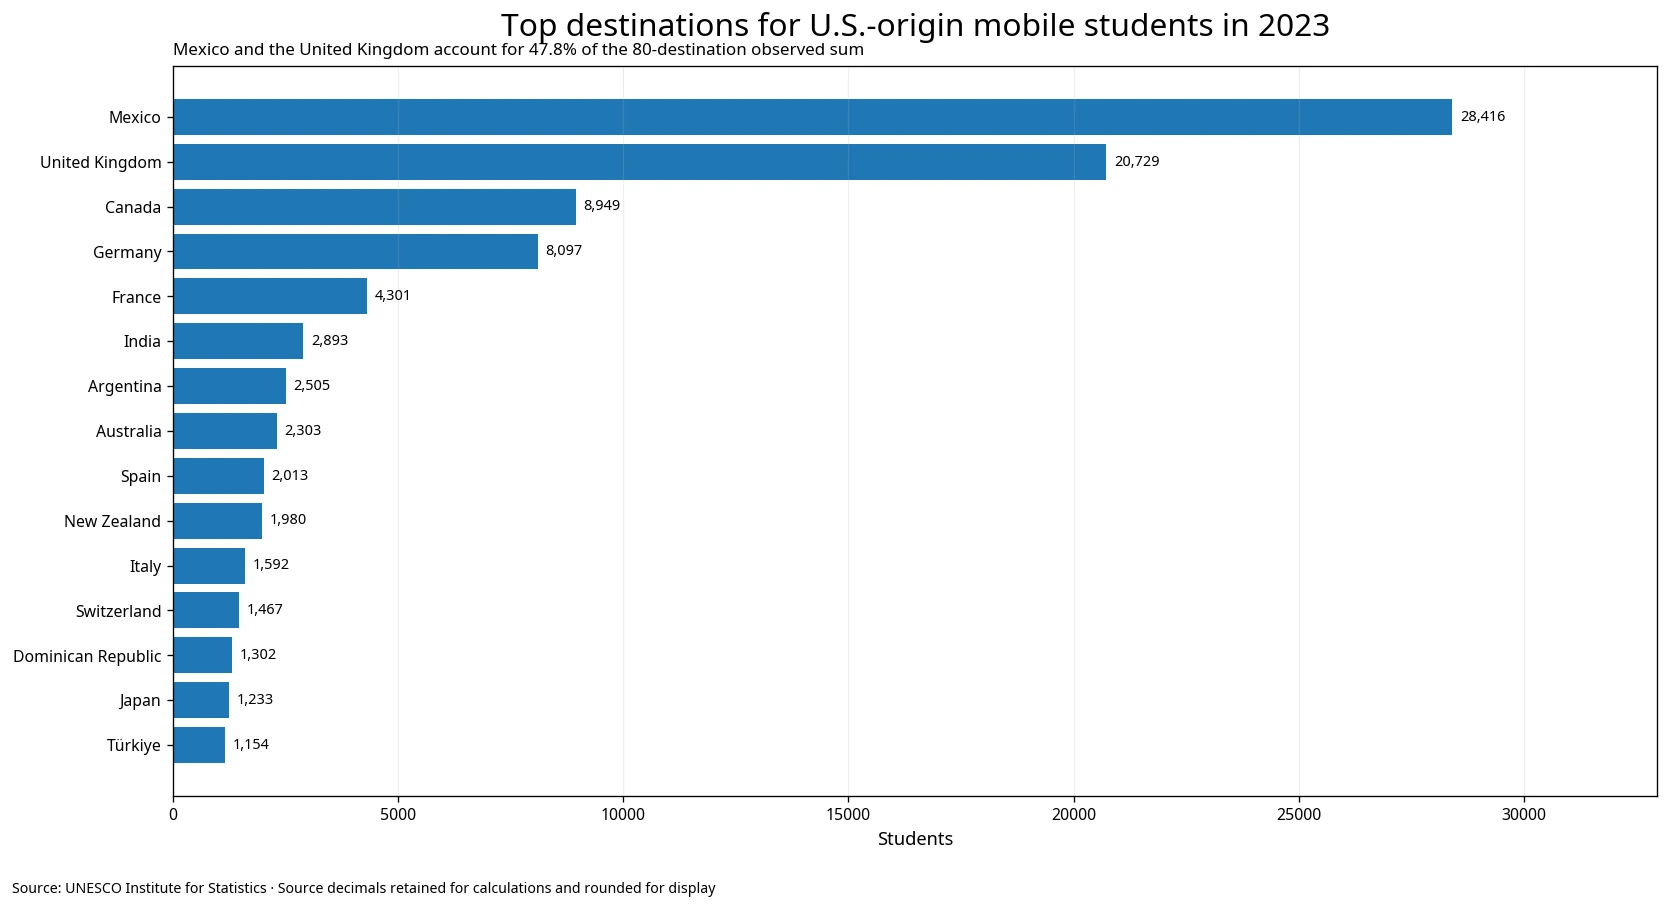
UNESCO Institute for Statistics (UIS) data for 2023 show a highly concentrated destination pattern for internationally mobile tertiary students whose origin country is the United States. Mexico is the largest observed destination with 28,416 students, followed by the United Kingdom with 20,729. Those two destinations alone account for about 47.8% of the sum across the 80 reported destinations.
Canada ranks third with 8,949 students. Adding it raises the top-three share to about 56.4%. The 80 observed destination values sum to approximately 102,921, but that sum is not treated as an exhaustive worldwide total for every U.S.-origin student abroad. Destinations absent from the extract are not filled with zero.
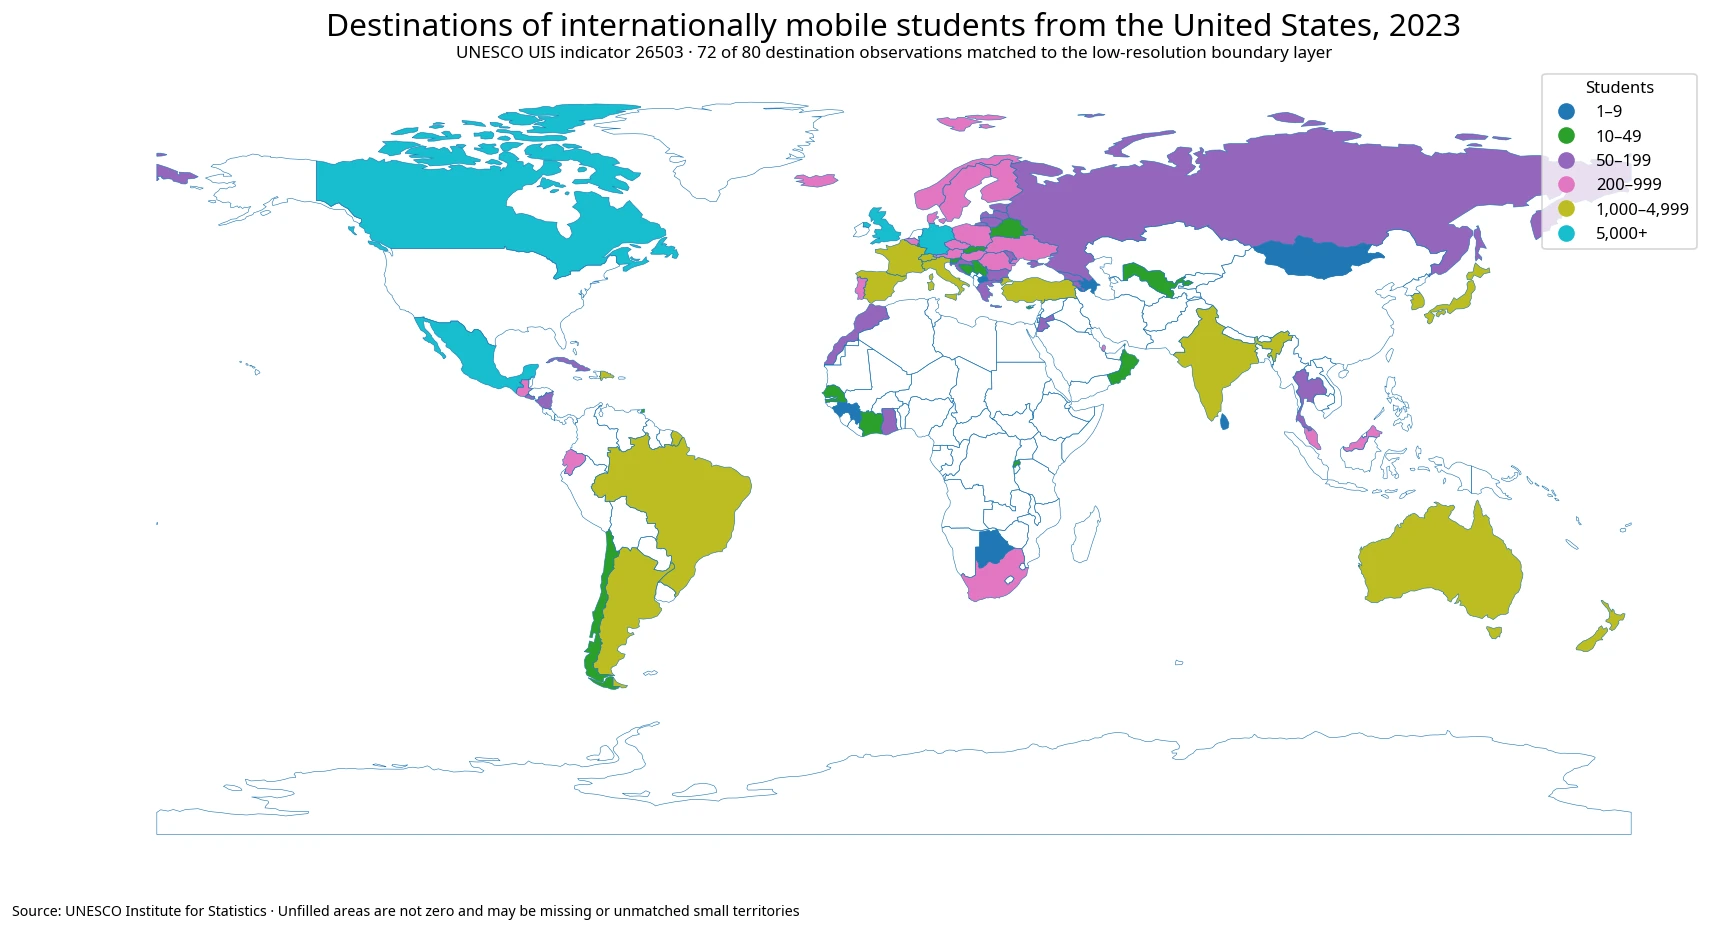
Table of Contents
Mexico and the United Kingdom hold nearly half of the observed total
Mexico represents 27.6% of the 80-destination observed sum. Mexico and the United Kingdom together reach 47.8%, and Canada brings the top three to 56.4%. The distribution is therefore dominated by a relatively small number of destinations rather than being spread evenly across all reported countries.
The top five destinations account for 68.5% of the observed sum, the top ten for 79.9%, and the top 15 for 86.4%. The median destination has only 156 students, which shows how different the largest destinations are from a typical row in the dataset.
Mexico’s position is geographically notable because it borders the United States, but the indicator does not explain student decisions. Tuition, language, family links, previous residence, institutional partnerships, programme availability and travel convenience may matter, yet none of those explanatory variables is contained in indicator 26503. The safe conclusion is about the observed destination count, not a single cause.
The top 15 span North America, Europe, Oceania and Latin America
The leading destinations are geographically broad. Mexico and Canada are in North America; the United Kingdom, Germany, France, Spain, Italy and Switzerland are in Europe; Australia and New Zealand are in Oceania; and Argentina, the Dominican Republic and Brazil appear among the larger Latin American observations.
| Rank | Destination | Students in 2023 | Share of 80-row sum |
|---|---|---|---|
| 1 | Mexico | 28,416 | 27.6% |
| 2 | United Kingdom | 20,729 | 20.1% |
| 3 | Canada | 8,949 | 8.7% |
| 4 | Germany | 8,097 | 7.9% |
| 5 | France | 4,301 | 4.2% |
| 6 | India | 2,893 | 2.8% |
| 7 | Argentina | 2,505 | 2.4% |
| 8 | Australia | 2,303 | 2.2% |
| 9 | Spain | 2,013 | 2.0% |
| 10 | New Zealand | 1,980 | 1.9% |
| 11 | Italy | 1,592 | 1.5% |
| 12 | Switzerland | 1,467 | 1.4% |
| 13 | Dominican Republic | 1,302 | 1.3% |
| 14 | Japan | 1,233 | 1.2% |
| 15 | Türkiye | 1,154 | 1.1% |
The United Kingdom is the largest European destination at 20,729, followed by Germany at 8,097 and France at about 4,301. The gap between these European observations is large, so it would be misleading to describe U.S.-origin mobile students as evenly distributed across Europe.
Australia reports 2,303 and New Zealand about 1,980. Argentina is slightly larger than Australia at 2,505, while the Dominican Republic reports 1,302 and Brazil 1,129. The upper group therefore includes both traditional English-speaking destinations and substantial flows to countries where English is not the dominant national language.
A mean of 1,287 contrasts with a median of only 156
The simple mean across 80 destinations is about 1,286.5 students, but the median is 156. The mean is roughly 8.2 times the median because the largest observations pull the arithmetic average sharply upward. Calling 1,287 a typical destination size would overstate the scale of most rows.
The first quartile is about 28.8 students and the third quartile is 801. Seventeen destinations have at least 1,000 students, while 36 are below 100 and 9 are below 10. The distribution combines a handful of major destinations with a long tail of very small reported flows.
Tiny rank differences at the bottom of the distribution should not receive the same interpretive weight as the gaps at the top. A destination with one student and another with two can swap positions with minimal change in the overall pattern. By contrast, Mexico and the United Kingdom together representing nearly half of the observed total is a large descriptive feature of this cross-section.
The country rows are destinations, not origins sending students to the United States
The official indicator name contains the word inbound because each destination education system reports students coming into that system. The origin condition, however, is fixed as the United States. Mexico’s 28,416 therefore means U.S.-origin internationally mobile students reported in Mexico, and the United Kingdom’s 20,729 means U.S.-origin students reported in the United Kingdom.
The table does not count Mexican students entering the United States. Reading the direction correctly is essential: from the host-country perspective each observation is inbound, while from the fixed U.S. origin perspective the full dataset describes an outbound destination distribution.
International student mobility datasets can reverse meaning if origin and destination are confused. The first interpretive step should therefore be to identify which geography is fixed and which geography varies across the rows.
Internationally mobile students are not simply all U.S. citizens abroad
UIS defines internationally mobile students as people who physically cross an international border to participate in education in a destination country that differs from their country of origin. For tertiary students, the preferred origin definition is the country where the student obtained upper-secondary qualifications.
If that criterion cannot be operationalised, usual or permanent residence may be used, with citizenship recommended only as a last-resort proxy. U.S.-origin in this series should therefore not automatically be treated as identical to every U.S. passport holder studying outside the United States.
Physical movement also matters. A student who remains in the United States while taking distance-learning courses from a foreign institution is not internationally mobile under this definition. This is one reason the UIS count can differ from visa statistics, citizenship-based foreign-student counts or broader estimates of Americans participating in education abroad.
The 80-destination sum is not automatically a complete worldwide total
The extract contains 80 destination observations for 2023. Absence from the file does not prove that a destination had zero U.S.-origin students. Reporting availability and the statistical coverage of host systems can differ.
For that reason, the approximately 102,921-student sum is used only as the denominator for this observed set. It supports internally consistent statements such as Mexico at 27.6%, the top two at 47.8% and the top ten at 79.9% of the 80-row sum.
It should not be relabeled as the official total population of all U.S.-origin tertiary students abroad without a separate total indicator establishing complete destination coverage. Missing destinations are not converted into zeros for ranking or aggregation.
Blank map areas do not mean zero students
Seventy-two of the 80 statistical observations match separate polygons in the low-resolution world boundary layer used for the map. The unmatched observations include small countries, islands and separately reported areas such as Malta, Hong Kong, Bahrain, Monaco, Macao, Bermuda, Andorra and Saint Lucia.
Those observations remain in the table and all statistical calculations even when the boundary layer cannot display them as independent polygons. A display limitation is different from missing statistical data, and both are different from a measured value of zero.
The map uses count bands of 1–9, 10–49, 50–199, 200–999, 1,000–4,999 and 5,000+. A single linear color scale would be dominated by Mexico and the United Kingdom and would make middle-sized destinations difficult to distinguish.
A mid-sized destination can be noted without changing the global focus
The Republic of Korea reports 1,029 students, ranking 17th among the 80 observations and representing about 1.0% of the observed sum. It is one peer destination in the broader distribution rather than an organizing focus of the article, and the count does not by itself explain why students chose it.
A single 2023 cross-section cannot show a trend
All rows use the same 2023 reference year, which is useful for comparing destination sizes without mixing different observation years. Mexico, the United Kingdom, Canada, Germany and France are therefore placed on a common time basis.
The cross-section cannot show whether Mexico’s share increased from 2022, whether the United Kingdom has been gaining U.S.-origin students over time, or whether a policy change altered Canada’s position. Those questions require comparable observations across several years.
A large destination count also does not directly measure university quality, student satisfaction or destination attractiveness. System size, programme availability, cost, language, geography and many other conditions may affect mobility, but this indicator reports only the resulting destination counts.
Data source and calculation method
The country values come from UNESCO Institute for Statistics indicator 26503, “Inbound internationally mobile students from North America: Students from the United States, both sexes (number),” using the 2023 NATIONAL observations in this comparison. Both sexes means the reported count combines male and female students.
- UNESCO UIS official API — indicator 26503
- UNESCO UIS Data Browser Glossary — internationally mobile students
The observed sum, mean, median, quartiles and concentration shares are calculated directly from the 80 non-missing observations. Fractional source values are retained for calculations and rounded only for chart and table labels. Missing destinations are not zero-filled, and no causal explanation is inferred from the destination counts.
The strongest conclusion supported by the dataset is that the 2023 observed destination distribution for U.S.-origin internationally mobile students is highly concentrated, with Mexico and the United Kingdom alone accounting for nearly half of the 80-destination sum. A complete global total, student motivations, long-term trends and education-quality comparisons require additional evidence.
Frequently Asked Questions
Are the country rows origins sending students to the United States?
No. The United States is fixed as the origin. Each row is a destination where U.S.-origin internationally mobile tertiary students are reported.
Is the 80-destination sum the complete worldwide total of U.S. students abroad?
Not necessarily. It is the sum of the 80 destination observations in this extract. Destinations without an observation are not treated as zero.
Are U.S.-origin mobile students the same as all U.S. citizens studying abroad?
Not always. UIS preferably defines tertiary student origin by the country of prior upper-secondary education, with residence and then citizenship used when necessary.
Can this dataset explain why Mexico is the largest destination?
No. It reports destination counts but does not contain explanatory variables such as tuition, language, geography, family links, visa policy or institutional partnerships.
Related Articles
- Canada-Origin Mobile Tertiary Students 2023 | Top 3 Destinations 80.1%
- Russian Student Destinations in 2023 | 70 Reported Destinations
- Nigerian International Student Destinations 2023 | UK 52%
Green Map creates custom-edited map images using open geographic data sources such as geoBoundaries, Natural Earth, OpenStreetMap, and government open data.
These maps are edited visual materials, not raw data files, and are provided for education, documents, presentations, and graphic reference.