Where do Canada-origin students go when they cross an international border to study in tertiary education? UNESCO Institute for Statistics indicator 26483 reports inbound internationally mobile tertiary students from Canada by destination country, both sexes.
The 75 destination observations dated 2023 sum to approximately 47,937 in the UIS values. The United States alone represents 59.2% of that observed-destination sum, and the United States, United Kingdom and Australia together account for 80.1%.
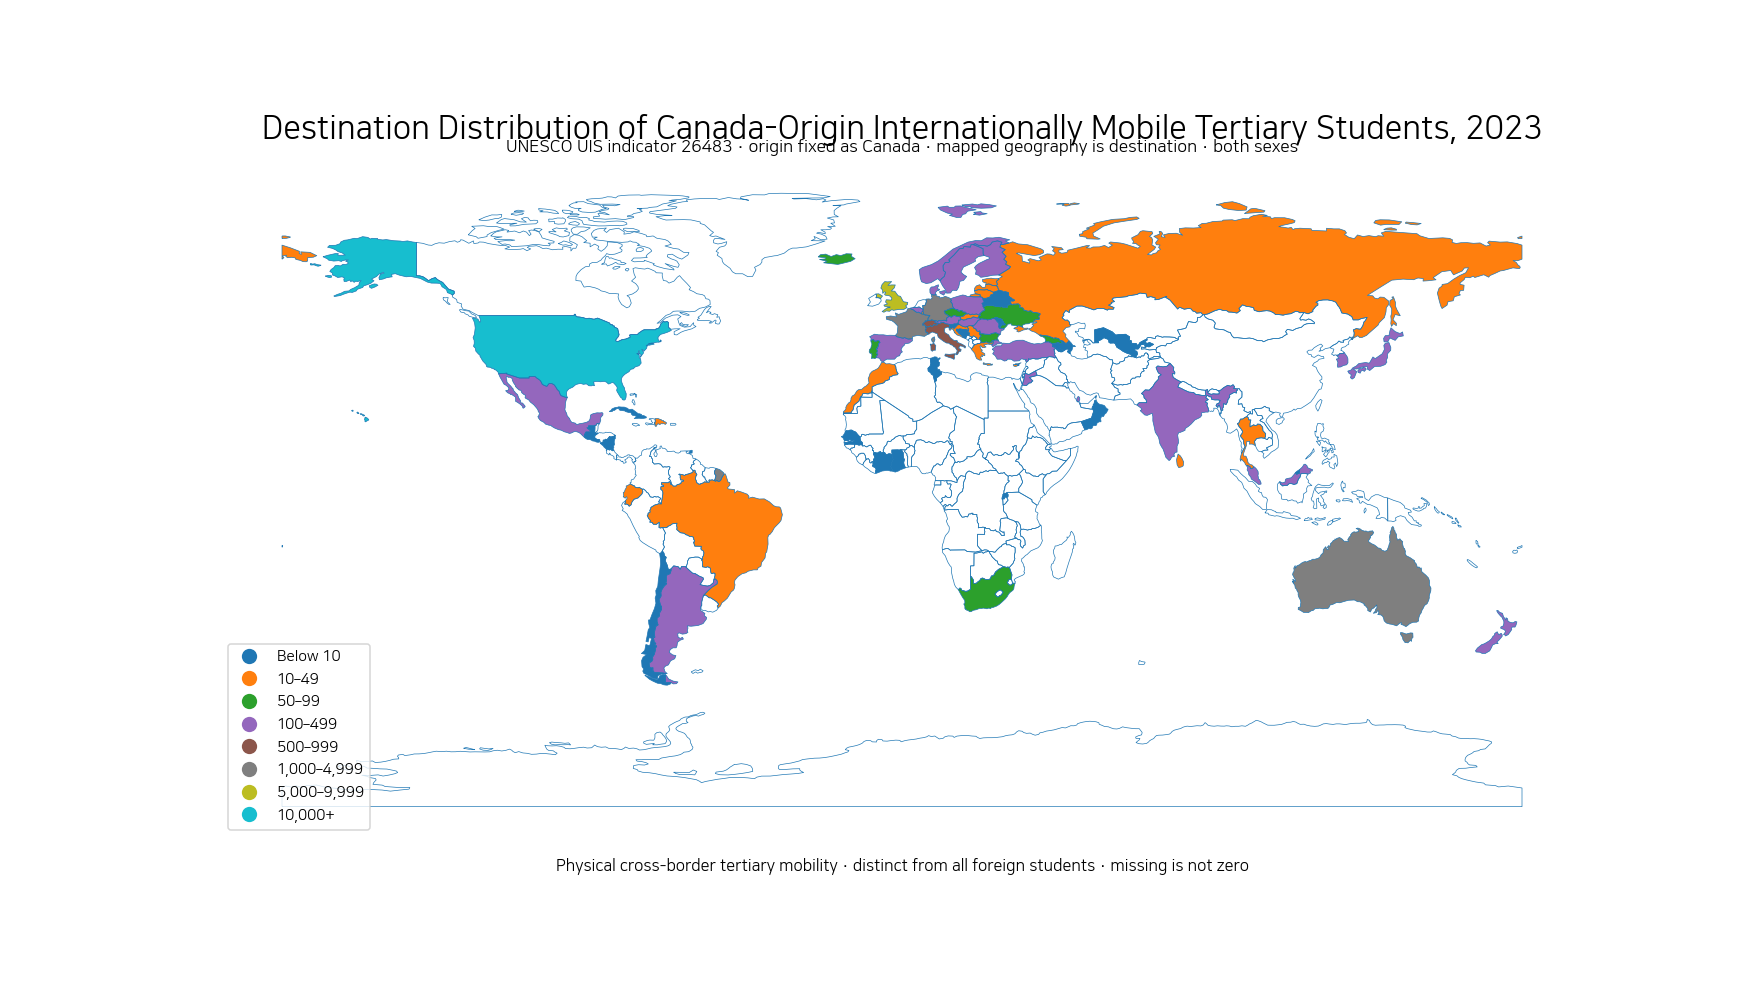
Table of Contents
The mapped countries are destinations for students from Canada
Canada is fixed as the origin in this indicator. The United States, United Kingdom, Australia, Germany, France and the other mapped countries are destinations where Canada-origin internationally mobile students are enrolled.
The data do not measure students from those destinations moving to Canada. The term inbound refers to the destination-country perspective: each host country reports students coming into its tertiary system.
Internationally mobile students are not simply all foreign citizens
UIS defines internationally mobile students as people who physically cross an international border for educational activities in a destination country different from their country of origin.
For tertiary students, the preferred origin definition is the country where upper-secondary qualifications were obtained. Usual or permanent residence may be used when that cannot be operationalised, and citizenship is recommended only as a last resort.
The statistics do not simply count every short-term exchange participant
UIS mobility statistics focus on tertiary students whose education participation involves actual cross-border mobility. Students in exchange arrangements who remain credited at their home institution can be excluded from the host-country enrolment statistics.
The indicator should therefore not be treated as a total of every Canadian citizen temporarily studying, taking language courses or spending a short exchange period abroad.
The United States accounts for about 59% of the observed total
The United States reports roughly 28,385, representing 59.2% of the sum across the 75 destination observations. The United Kingdom is second at 7,357 and Australia third at 2,643.
Geographic proximity, language, system size and travel costs could plausibly matter, but this indicator contains destination counts rather than evidence about students’ reasons for choosing a country. The article therefore avoids assigning a single cause.
The top three destinations account for 80.1%
The United States, United Kingdom and Australia sum to about 38,385, or 80.1% of the 75-destination total. Adding Germany and France brings the top-five share to 85.5%.
Canada-origin mobility therefore reaches many destinations but is highly concentrated when weighted by student numbers. Destination diversity and student-volume concentration tell different stories.
| Destination | ISO3 | UIS student-count value | Share of 75-destination sum |
|---|---|---|---|
| United States | USA | 28,384.5 | 59.2% |
| United Kingdom | GBR | 7,357 | 15.3% |
| Australia | AUS | 2,643 | 5.5% |
| Germany | DEU | 1,423 | 3.0% |
| France | FRA | 1,191.4 | 2.5% |
| Switzerland | CHE | 639 | 1.3% |
| Italy | ITA | 503 | 1.0% |
| New Zealand | NZL | 472 | 1.0% |
| Türkiye | TUR | 340 | 0.7% |
| Republic of Korea | KOR | 327 | 0.7% |
| Spain | ESP | 327 | 0.7% |
| Poland | POL | 317 | 0.7% |
| Mexico | MEX | 313 | 0.7% |
| Japan | JPN | 283 | 0.6% |
| Belgium | BEL | 235 | 0.5% |
| Hungary | HUN | 207 | 0.4% |
| India | IND | 203 | 0.4% |
| Denmark | DNK | 190 | 0.4% |
| Qatar | QAT | 177 | 0.4% |
| Sweden | SWE | 174.4 | 0.4% |
The United Kingdom, Germany and France are major European destinations
The United Kingdom records 7,357, Germany 1,423, and France about 1,191.4. Switzerland has 639, Italy 503, and Spain 327.
The European distribution is uneven. The data provide a starting point for understanding where Canada-origin students are enrolled, but they do not directly measure tuition, scholarships, subject choice or visa policy.
Australia and New Zealand are also important destinations
Australia ranks third overall with 2,643, while New Zealand has 472. Both are geographically distant from Canada yet host substantial numbers of Canada-origin mobile tertiary students.
Language may be relevant, but it should not be presented as a proven causal explanation from this dataset alone.
The destination distribution also extends across Asia
Japan records 283 and India 203. The Republic of Korea records 327, the same source value as Spain.
These Asian destinations should be read within the full distribution, which remains far more concentrated in the United States, United Kingdom and Australia.
| Selected destination | UIS student-count value | Share of 75-destination sum |
|---|---|---|
| United States | 28,384.5 | 59.21% |
| United Kingdom | 7,357 | 15.35% |
| Australia | 2,643 | 5.51% |
| Germany | 1,423 | 2.97% |
| France | 1,191.4 | 2.49% |
| Switzerland | 639 | 1.33% |
| Italy | 503 | 1.05% |
| New Zealand | 472 | 0.98% |
| Türkiye | 340 | 0.71% |
| Spain | 327 | 0.68% |
| Republic of Korea | 327 | 0.68% |
| Poland | 317 | 0.66% |
| Mexico | 313 | 0.65% |
| Japan | 283 | 0.59% |
| Belgium | 235 | 0.49% |
| India | 203 | 0.42% |
| Denmark | 190 | 0.40% |
| Sweden | 174.4 | 0.36% |
| Austria | 171.5 | 0.36% |
| Brazil | 42 | 0.09% |
The top ten destinations account for most of the total
The top ten destinations sum to about 43,280, representing 90.3% of the total across the 75 observations. Only 5 destinations have values at or above 1,000 and 7 are at or above 500.
By contrast, 47 destinations are below 100 and 21 are below 10. The map therefore uses threshold bands that span orders of magnitude rather than equal-width linear intervals.
The 75-destination sum is not necessarily the complete worldwide total
Adding the 75 source rows produces approximately 47,937. The article deliberately calls this the 75-destination observed sum rather than the definitive worldwide total of Canada-origin mobile students.
Not every destination is guaranteed to have a 2023 observation in the extract. Missing reporting countries or areas would not contribute to the sum.
Some source values are non-integer
4 of the 75 destination values are supplied by UIS with decimal components, including the United States, France, Sweden and Austria.
The calculations retain the source values rather than forcing every record to a whole number. Tables round for readability, while totals and shares are calculated from the original values.
This is not the total international-student population of each destination
The United States value counts only Canada-origin internationally mobile tertiary students in this indicator. It does not represent all international students studying in the United States.
A destination can host many more students from China, India, Europe or other origins. A full host-country international-student comparison requires an all-origins inbound measure.
A high count is not a ranking of education quality
A destination receiving many Canada-origin students is not automatically a higher-quality education system. System size, proximity, language, tuition, programme availability, visa pathways and many other factors may shape mobility.
Indicator 26483 records the distribution of students, not the causes of that distribution or a quality score.
Blank map areas do not mean zero students
Of the 75 source observations, 71 match separate polygons in the low-resolution world boundary layer used here. Small islands or areas can have valid statistics without a visible polygon.
A blank country is not treated as zero. It means no 2023 observation from this indicator is mapped in the current extract.
Data source and interpretation
Destination values come from the UNESCO UIS Data Browser for indicator 26483, using 2023 values. The mobility concept follows the UIS definition of internationally mobile students.
Canada is the fixed origin country, both sexes are included, and the mapped geography is the destination. The source package already identifies UNESCO UIS as the provider; the generic unit ‘value’ is clarified as a student-count indicator.
Frequently Asked Questions
Are internationally mobile students the same as all foreign students?
No. UIS defines mobile students by physical cross-border movement for education, with origin preferably based on prior education rather than citizenship alone.
Are the mapped countries origins of students going to Canada?
No. Canada is the fixed origin country; the mapped countries are destinations where Canada-origin students study.
Is the 75-destination sum the complete worldwide total?
Not necessarily. It is the sum of the 75 destination observations available in this 2023 extract and excludes destinations without an observation.
Does a high destination count prove higher education quality?
No. The indicator reports student numbers by destination and does not directly measure education quality or why students chose that destination.
Related Articles
- Gender Composition of East Asia-Pacific-Origin Mobile Tertiary Students in 2023
- Government Education Spending as a Share of GDP
- Compulsory Education Duration by Country | 2025
Green Map creates custom-edited map images using open geographic data sources such as geoBoundaries, Natural Earth, OpenStreetMap, and government open data.
These maps are edited visual materials, not raw data files, and are provided for education, documents, presentations, and graphic reference.