How many adults have completed education beyond upper secondary but at least at the post-secondary non-tertiary level? UNESCO Institute for Statistics indicator EA.4T8.AG25T99 measures the percentage of the population age 25 and older, both sexes, who have completed post-secondary non-tertiary education (ISCED 4) or a higher level. It is an accumulated attainment measure, not a current college-enrolment rate or an annual graduation rate.
The 2023 extract contains 72 country and area observations for the same reference year. The unweighted median is 31.1% and the mean is 31.9%. Only 9 observations reach 50% or more. Canada is highest at 68.0%, while the Republic of Korea is 48.7% in 13th place. The United States is 49.1% in 12th, making the two values very close.
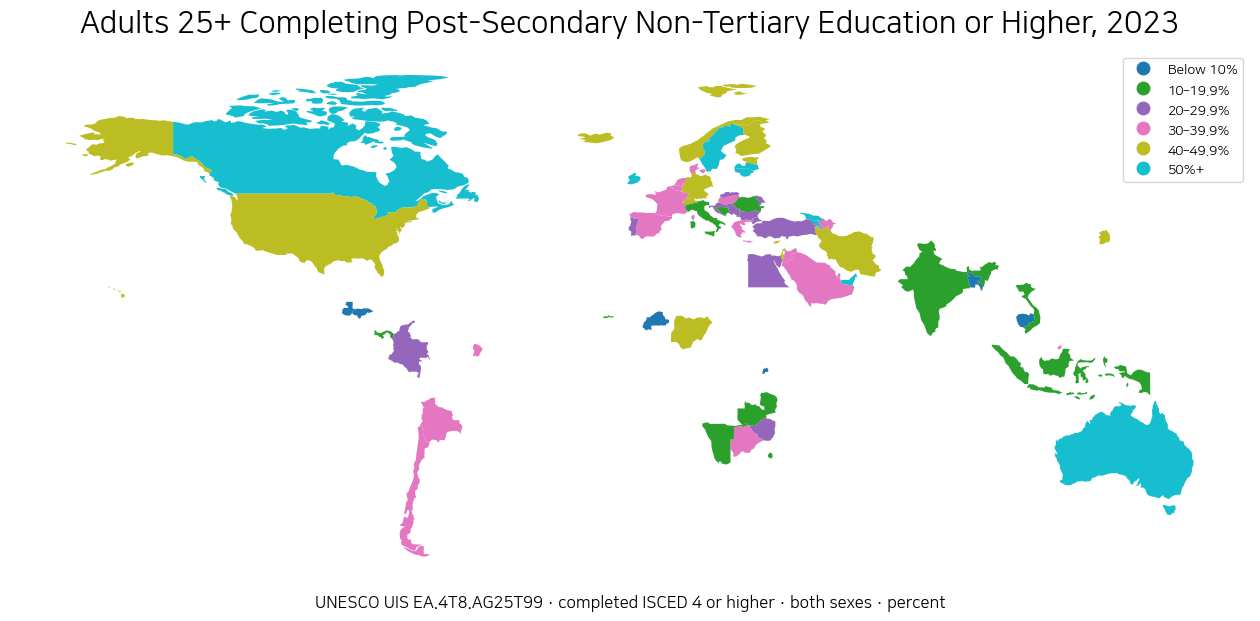
Table of Contents
Post-secondary non-tertiary is above upper secondary but below tertiary education
ISCED level 4 can be difficult to translate into one familiar qualification because national education systems use different programme names and credentials. UIS defines it as education that builds on upper-secondary education and can prepare learners for labour-market entry or progression to tertiary education, while remaining below the complexity of tertiary education.
The indicator code 4T8 is crucial. It does not count only people whose highest attainment is ISCED 4. It includes everyone who has crossed that threshold: ISCED 4, short-cycle tertiary at level 5, bachelor’s at level 6, master’s at level 7 and doctoral or equivalent education at level 8. A 50% value therefore means half of adults reached at least this threshold, not that half completed one particular post-secondary certificate.
Because level-4 programmes differ across countries, the indicator should be read as an internationally harmonized education threshold rather than an exact synonym for a single vocational diploma or college credential in every national system.
A same-year 2023 comparison avoids the mixed-year problem in the existing latest-value article
Green Map already has an article on the same education threshold using each country’s latest available observation. That broader article is useful for coverage, but its reference years vary widely, which makes a precise same-year league table inappropriate. The present dataset is different because all 72 observations are dated 2023.
Using one reference year reduces a major comparability problem: one country is not being compared with another country’s much older observation. Coverage is narrower, however, so this should still be described as a comparison among the 72 countries and areas with a 2023 observation, not a complete ranking of every country in the world.
Nine countries exceed the 50% threshold
9 observations are at or above 50%: Canada 68.0%, Ireland 63.3%, Lithuania 63.2%, the United Arab Emirates 59.0%, Georgia 53.8%, Sweden 52.5%, Armenia 52.5%, Australia 51.7% and Latvia 50.7%.
23 observations are at least 40%, and 39 are at least 30%. At the lower end, 20 observations are below 20% and 7 are below 10%. The spread is broad enough that the median and range bands are more informative than a single average.
| Rank | Country or area | ISO3 | 2023 attainment |
|---|---|---|---|
| 1 | Canada | CAN | 68.0% |
| 2 | Ireland | IRL | 63.3% |
| 3 | Lithuania | LTU | 63.2% |
| 4 | United Arab Emirates | ARE | 59.0% |
| 5 | Georgia | GEO | 53.8% |
| 6 | Sweden | SWE | 52.5% |
| 7 | Armenia | ARM | 52.5% |
| 8 | Australia | AUS | 51.7% |
| 9 | Latvia | LVA | 50.7% |
| 10 | Estonia | EST | 49.5% |
| 11 | Israel | ISR | 49.5% |
| 12 | United States | USA | 49.1% |
| 13 | Republic of Korea | KOR | 48.7% |
| 14 | Luxembourg | LUX | 48.5% |
| 15 | Iceland | ISL | 46.9% |
Korea is 48.7%, almost the same as the United States
The Republic of Korea is 48.7%, ranking 13th among the 72 observations. The United States is 49.1% in 12th place, a gap of only about 0.5 percentage points. Canada and Australia are higher, while Germany, the Netherlands and France are lower in this 2023 comparison.
Korea’s 48.7% should not be relabelled as the share of adults with university degrees. The threshold starts one level below tertiary education, at ISCED 4, and then includes all higher levels. That makes this percentage naturally broader than a bachelor’s-or-higher attainment rate.
| Country | 2023 rank | ISCED 4+ attainment |
|---|---|---|
| Canada | 1 | 68.0% |
| Australia | 8 | 51.7% |
| United States | 12 | 49.1% |
| Republic of Korea | 13 | 48.7% |
| Germany | 19 | 42.4% |
| Netherlands | 27 | 39.1% |
| France | 31 | 37.4% |
| India | 60 | 16.1% |
| Indonesia | 63 | 11.7% |
Canada is highest at 68.0%, while Guatemala is lowest at 4.2%
Canada has the highest value at 68.0%, while Guatemala is lowest at 4.2%. Burkina Faso is 4.9%, Rwanda 5.8%, Cambodia 6.8%, Honduras 7.3%, Bangladesh 8.1% and Kiribati 9.0%, all below 10%.
The indicator does not identify why one country is high and another is low. Upper-secondary completion, vocational education structures, access to tertiary education, cohort history, labour-market requirements, conflict and household resources can all matter. Causal explanations require additional evidence beyond this attainment percentage.
The threshold is one step below short-cycle tertiary education
In the ISCED ladder, post-secondary non-tertiary education is level 4. Short-cycle tertiary education is level 5. A short-cycle-tertiary-or-higher indicator therefore sets a higher threshold and will generally include fewer adults. An upper-secondary-or-higher indicator sets a lower threshold and will generally include more.
These related attainment indicators can be used together to understand the education ladder. They should not be subtracted mechanically to create a progression, dropout or transition rate unless reference years, population coverage and statistical definitions are aligned. The same-year nature of this 2023 dataset improves comparability, but it does not turn separate indicators into flow statistics.
This is not current college participation or this year’s graduation rate
Educational attainment describes the highest level of education people have successfully completed. The age-25-plus population includes many generations, so the measure changes more slowly than current enrolment or graduation flows. A recent expansion of post-secondary access among young adults can take years to substantially change the full adult attainment distribution.
That makes EA.4T8.AG25T99 useful for comparing accumulated adult education levels. Current participation, annual graduates and transitions between education levels require different indicators.
The 31.9% mean is not a population-weighted world rate
The simple mean across the 72 observations is 31.9% and the median is 31.1%. The first quartile is 19.3% and the third quartile is 43.0%. Each country or area receives the same weight in these summary statistics.
A population-weighted global share would require the age-25-plus population of each country or an official UIS aggregate designed for that purpose. The mean reported here describes the distribution of the 72 reporting observations, not the percentage of all adults in the world who reached this threshold.
Blank map areas do not mean zero attainment
Of the 72 statistical rows, 65 match separate polygons in the low-resolution world boundary layer used for the map. Small states and separately reported areas may not have independent polygons or direct ISO matches at this resolution even when their statistical observations are present.
Countries without a 2023 value in this extract are also left unclassified. Missing data and a measured value of zero are different statistical states. The map uses six bands from below 10% to 50% or more to keep both low and high observations visible.
Data source and comparison method
Country values come from the UNESCO UIS Data Browser for indicator EA.4T8.AG25T99, using the 2023 national observations. The meaning of ISCED level 4 follows the UNESCO UIS definition of post-secondary non-tertiary education.
The mean, median, quartiles and ranks treat the 72 country and area observations equally, and every row uses 2023 as the reference year. The official unit is percent and the published values are used directly. The source package’s internal provider tag named the World Bank, but the official indicator and dataset are UNESCO UIS, so the completed metadata uses UNESCO UIS consistently.
Frequently Asked Questions
Is post-secondary non-tertiary attainment the same as a university graduation rate?
No. The threshold begins at ISCED 4, which is above upper secondary but below tertiary education, and it also includes everyone who completed higher levels such as short-cycle tertiary, bachelor’s, master’s and doctoral education.
How many countries exceeded 50% in 2023?
Nine of the 72 observations were at or above 50%: Canada, Ireland, Lithuania, the United Arab Emirates, Georgia, Sweden, Armenia, Australia and Latvia.
What does Korea’s 48.7% mean?
It means 48.7% of the population age 25+ had completed at least ISCED level 4 or a higher education level in the 2023 UIS observation. It is not current college enrolment or an annual graduation rate.
How is this different from the existing post-secondary attainment article?
The existing article uses each country's latest available observation, so reference years differ. This article uses 72 observations all dated 2023, allowing a cleaner same-year comparison within that narrower set.
Related Articles
- Post-Secondary Attainment for Adults 25+ | 2020–2024 Latest Observations
- Global Short-Cycle Tertiary Attainment Map | Adults 25+ by Country
- Bachelor’s-or-Higher Attainment Map | Adults 25+ by Country
Green Map creates custom-edited map images using open geographic data sources such as geoBoundaries, Natural Earth, OpenStreetMap, and government open data.
These maps are edited visual materials, not raw data files, and are provided for education, documents, presentations, and graphic reference.