The bank cost-to-income ratio is a widely used measure of operating efficiency in banking. It compares operating expenses with the sum of net-interest revenue and other operating income. For a cleaner cross-country comparison, this article uses only the 132 countries and separately reported economies with an actual 2021 observation in World Bank series GFDD.EI.07. The 2021 median is 54.3%, the unweighted mean is 54.8%, and the middle half of observations falls between roughly 47.2% and 61.0%.
A ratio of 50% means that operating expenses are equal to about half of the operating-income denominator used by this indicator. All else equal, a lower ratio is commonly interpreted as greater cost efficiency because less operating expense is required relative to income. However, it is not a complete score for profitability, solvency, service quality, or financial stability. The ratio can change because costs move, because income moves, or because the mix of banks and activities changes.
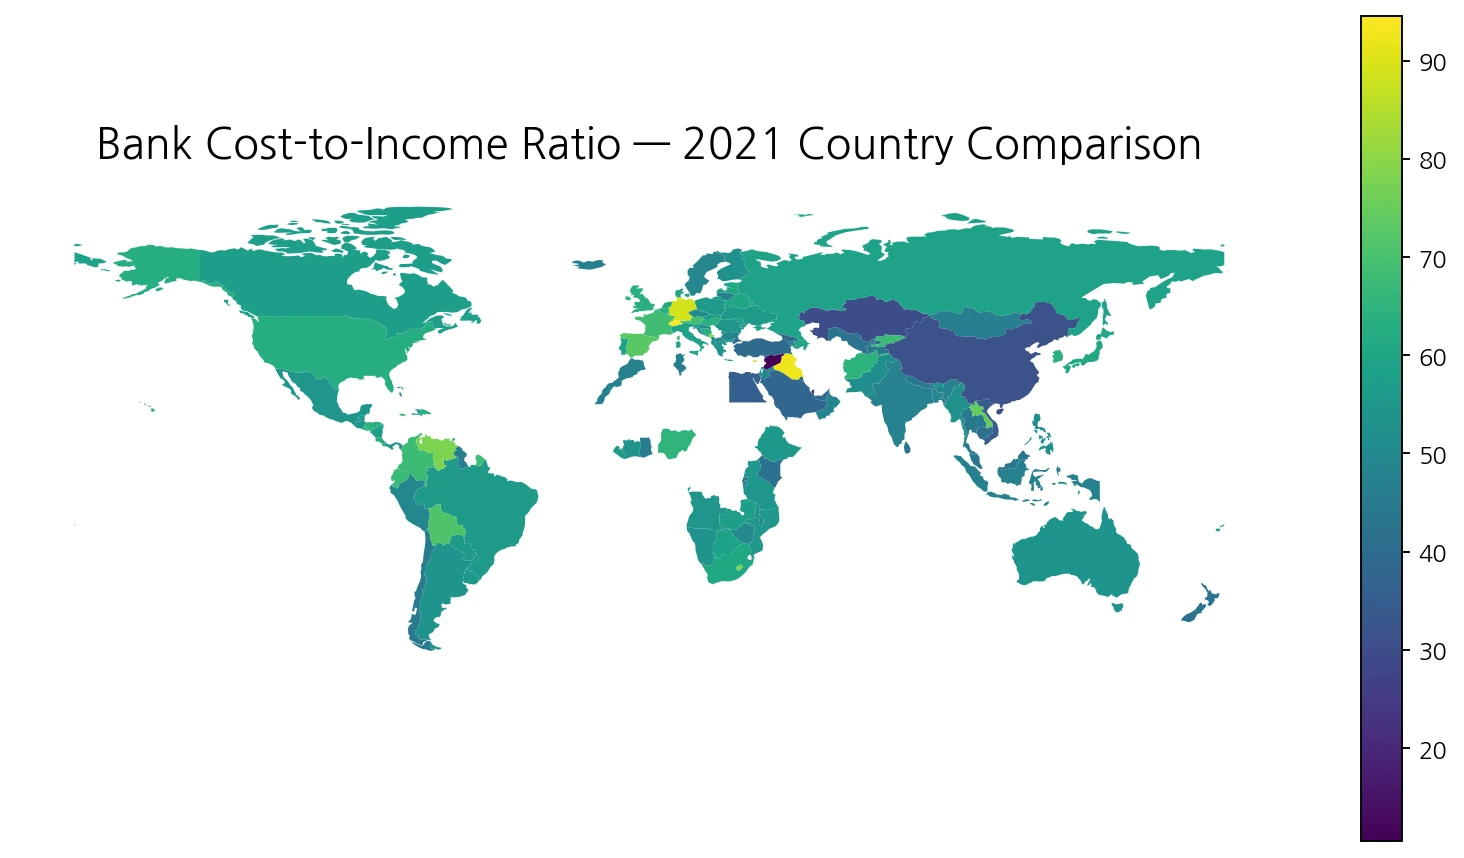
Table of Contents
What the bank cost-to-income ratio measures
The World Bank defines GFDD.EI.07 as operating expenses of banks divided by the sum of net-interest revenue and other operating income. The series sits in the Efficiency topic of the Global Financial Development database. The underlying source is bank-by-bank unconsolidated financial data from Bankscope for 2000–2014 and Orbis for 2015–2021, both associated with Bureau van Dijk.
The calculation is performed at the country level after numerator and denominator items are aggregated across the available banks. That is important because the result is not simply the average ratio of a few named banks. The composition of the national banking sample, the size distribution of banks, and their business models can affect the aggregate. The World Bank metadata also states that a country-year is not reported when there are fewer than three bank-level observations.
The 2021 median is 54.3%, with most observations between 40% and 60%
Giving each of the 132 observations equal weight, the 2021 median is 54.3% and the mean is 54.8%. The first quartile is 47.2% and the third quartile is 61.0%, so half of the country/economy observations lie in a fairly compact band of about 47% to 61%. The global map therefore has a broad middle range rather than a simple split between high-cost and low-cost banking systems.
| 2021 ratio range | Countries/economies | Share of 132 |
|---|---|---|
| Below 30% | 4 | 3.0% |
| 30% to <40% | 7 | 5.3% |
| 40% to <50% | 35 | 26.5% |
| 50% to <60% | 47 | 35.6% |
| 60% to <70% | 27 | 20.5% |
| 70% to <80% | 8 | 6.1% |
| 80% or more | 4 | 3.0% |
The 50% to below-60% band contains 47 observations, while 35 fall between 40% and 50%. Together those two bands account for about 62% of the 2021 sample. Only 12 observations are 70% or higher, and just four are at least 80%. At the other end, only four are below 30%, so the most extreme colors on the map represent relatively small groups.
Switzerland, Iraq, Cyprus, and Germany have the highest 2021 ratios
Switzerland records the highest 2021 value at 94.5%, followed by Iraq at 92.4%, Cyprus at 89.2%, and Germany at 88.6%. Montenegro is 79.3%, Venezuela 78.0%, Lesotho 77.6%, and Malta 76.1%. Curaçao and Lao PDR are both around 74.7%, while Spain is 72.8% and Bolivia 71.0%.
| Country/economy | 2021 cost-to-income ratio |
|---|---|
| Switzerland | 94.5% |
| Iraq | 92.4% |
| Cyprus | 89.2% |
| Germany | 88.6% |
| Montenegro | 79.3% |
| Venezuela, RB | 78.0% |
| Lesotho | 77.6% |
| Malta | 76.1% |
| Curacao | 74.7% |
| Lao PDR | 74.7% |
| Spain | 72.8% |
| Bolivia | 71.0% |
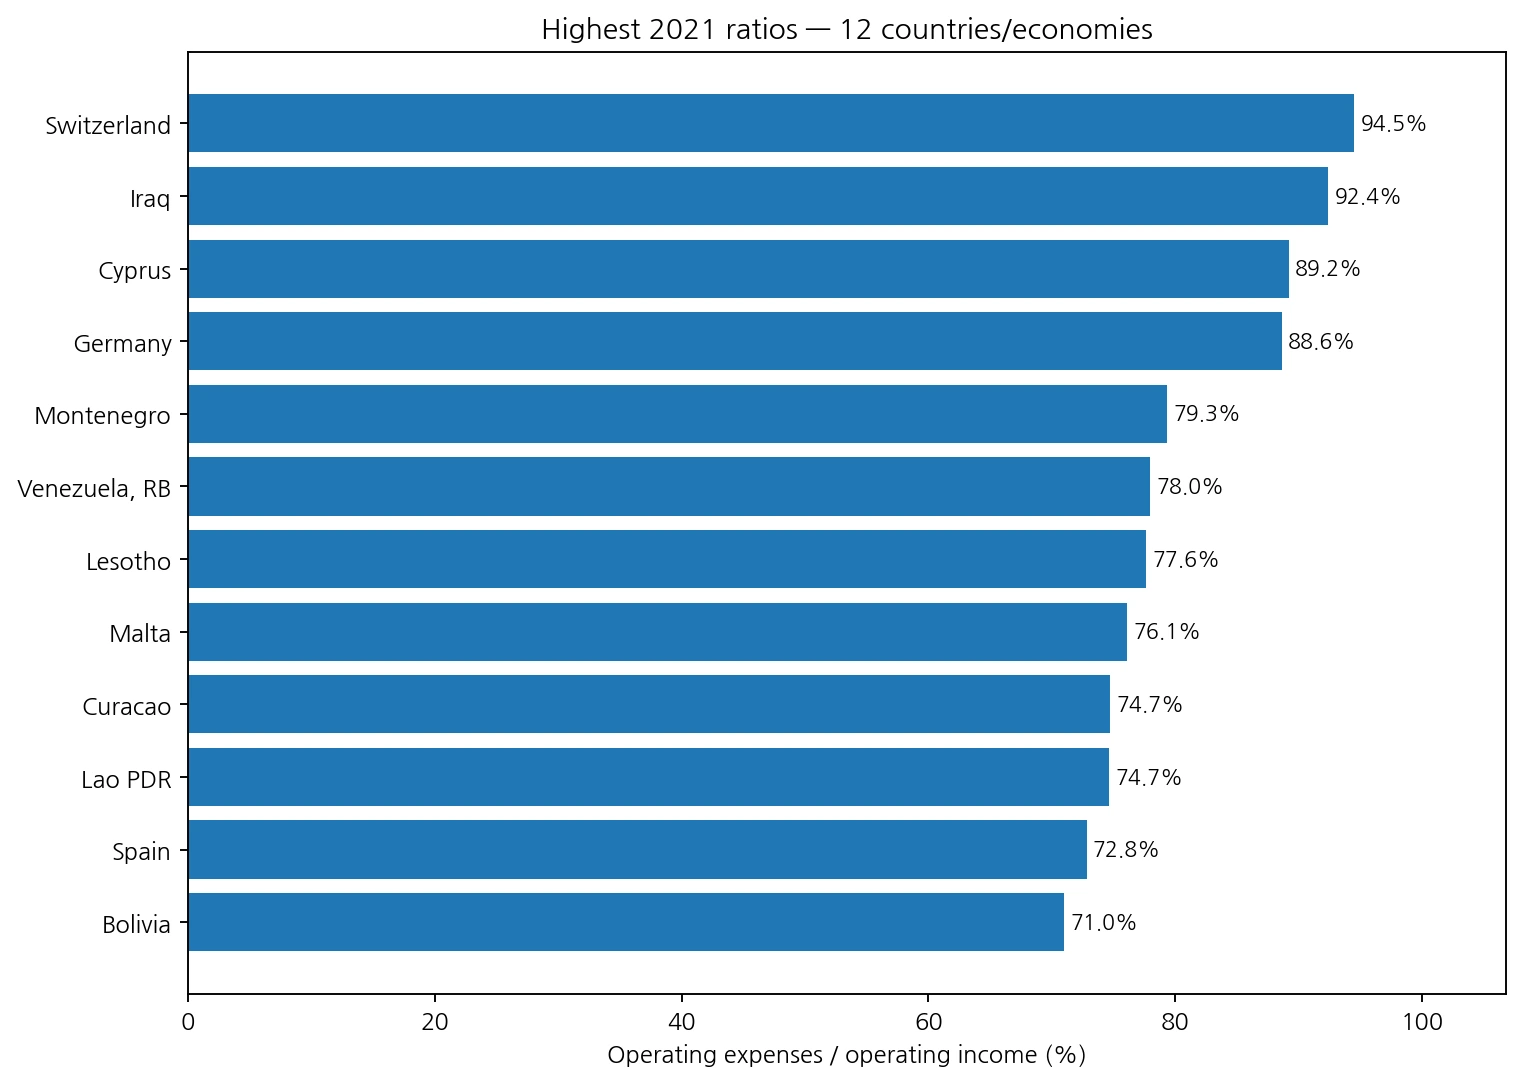
A high value does not identify the cause by itself. The ratio can rise because operating expenses increase, but it can also rise because net-interest revenue or other operating income weakens. Interest-rate conditions, fee income, restructuring expenses, business mix, branch networks, technology investment, and the composition of the reported banks can all influence the numerator or denominator.
The lowest 2021 values are in Syria, Qatar, Macao, and Kazakhstan
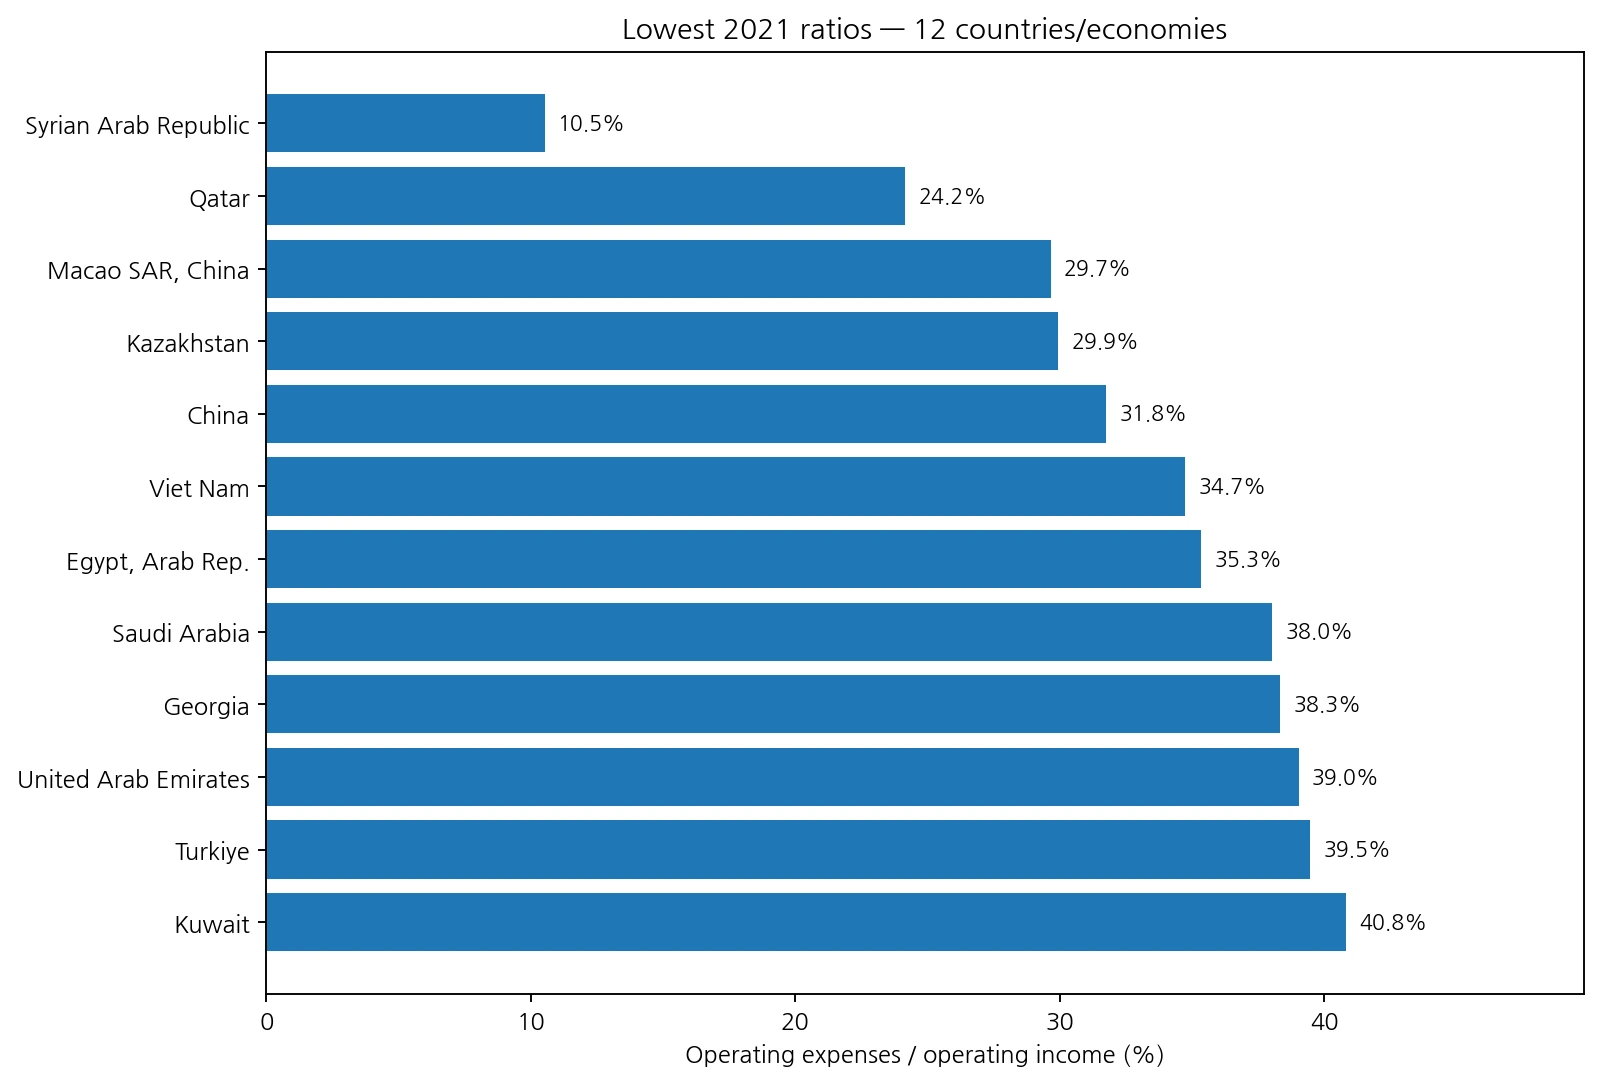
The Syrian Arab Republic has the lowest retained 2021 value at 10.5%, followed by Qatar at 24.2%, Macao SAR at 29.7%, and Kazakhstan at 29.9%. China is 31.8%, Viet Nam 34.7%, Egypt 35.3%, Saudi Arabia 38.0%, Georgia 38.3%, and the United Arab Emirates 39.0%. These low values indicate relatively low operating expense compared with the income denominator, but they should not be treated as a complete ranking of bank quality.
| Country/economy | 2021 cost-to-income ratio |
|---|---|
| Syrian Arab Republic | 10.5% |
| Qatar | 24.2% |
| Macao SAR, China | 29.7% |
| Kazakhstan | 29.9% |
| China | 31.8% |
| Viet Nam | 34.7% |
| Egypt, Arab Rep. | 35.3% |
| Saudi Arabia | 38.0% |
| Georgia | 38.3% |
| United Arab Emirates | 39.0% |
| Turkiye | 39.5% |
| Kuwait | 40.8% |
Korea is 63.7%, the United States 62.7%, and China 31.8%
Selected large economies show how widely banking cost structures differ. Korea is 63.7% in 2021, the United States 62.7%, and Japan 60.6%. France is 68.9%, Germany 88.6%, the United Kingdom 63.9%, and the Netherlands 61.2%. China is much lower at 31.8%, while India is 47.8%, Indonesia 47.2%, Singapore 45.4%, and Saudi Arabia 38.0%.
| Country/economy | 2021 cost-to-income ratio |
|---|---|
| Korea, Rep. | 63.7% |
| United States | 62.7% |
| Japan | 60.6% |
| China | 31.8% |
| India | 47.8% |
| Indonesia | 47.2% |
| Germany | 88.6% |
| France | 68.9% |
| United Kingdom | 63.9% |
| Canada | 57.3% |
| Australia | 54.1% |
| Brazil | 55.8% |
| Mexico | 54.4% |
| Singapore | 45.4% |
| Switzerland | 94.5% |
| Saudi Arabia | 38.0% |
Those differences are useful for identifying outliers, but they do not justify statements such as “China’s banking system is twice as efficient as Germany’s.” The denominator is shaped by each banking system’s revenue structure, and the number and type of banks represented can differ. Large gaps are more informative than tiny decimal-point rankings, and a serious comparison should add profitability, capital, asset-quality, net-interest-margin, and risk indicators.
Why the main comparison uses 132 observations from 2021
The supplied latest-non-missing table contains 171 country/economy rows, but their observation years range from 2002 to 2021. Exactly 132 are dated 2021, while 39 use an earlier year. Mixing a 2003 banking observation with a 2021 observation in one “current” ranking would weaken comparability because regulation, technology, interest rates, and industry structure changed substantially over that period.
The main map and all rankings therefore use 2021 only. The broader latest-value table is still fairly recent in aggregate—160 of its 171 observations are from 2019 or later—but the same-year rule is more transparent. A gray location on the 2021 map should not be interpreted as zero banking activity. It may simply lack a 2021 observation, or a small island may not have a separate polygon in the low-resolution boundary layer.
Lower is usually more cost-efficient, but not automatically better
Cost-to-income is an efficiency measure, not a universal quality score. A bank can reduce the ratio by cutting operating expenses, but some expenses support cybersecurity, compliance, digital infrastructure, risk management, customer service, and branch access. Conversely, a temporary technology or restructuring program can raise expenses today while improving future efficiency.
Income effects matter just as much. If net-interest revenue rises sharply while operating costs are unchanged, the ratio falls even though the institution did not become leaner in a mechanical cost sense. That is why the map is best used to locate unusually high and low national ratios and then investigate the underlying banking context, rather than turning the colors into a simple “good versus bad” classification.
Data source and mapping method
The statistical source is the World Bank Global Financial Development series GFDD.EI.07, Bank cost to income ratio (%). World Bank metadata defines the ratio as operating expenses divided by the sum of net-interest revenue and other operating income. The source data are Bankscope for 2000–2014 and Orbis for 2015–2021. A result is not reported for a country-year with fewer than three bank-level observations.
This article restricts the comparison to the 132 observations dated 2021. ISO-3 codes are joined to a Natural Earth low-resolution world boundary layer, producing 122 directly filled polygons. Statistical calculations use all 132 observations, including small economies that may not have a visible polygon at this scale. The mean is unweighted across countries/economies; it is not weighted by bank assets, national GDP, or population.
Frequently Asked Questions
Is a lower bank cost-to-income ratio always better?
A lower ratio generally indicates greater cost efficiency when other conditions are similar, but revenue structure, investment, restructuring, and bank composition can affect the result.
What does a 60% cost-to-income ratio mean?
Under the World Bank definition, operating expenses are about 60% of the sum of net-interest revenue and other operating income.
Why does this article use 132 observations from 2021 instead of all 171 latest values?
The 171 latest observations span 2002–2021. Using the 132 actual 2021 values gives a more comparable same-year country view.
Does this ratio measure bank profitability or financial stability?
No. It measures operating cost efficiency. Profitability, capital adequacy, asset quality, liquidity, and financial stability require additional indicators.
Related Articles
Bank operating efficiency is not the same as GDP growth or income per person, but broader country-level economic indicators can provide useful context when interpreting large differences across banking systems.
- Global GDP Growth Map – 2025 Country Comparison
- Global GDP per Capita Map – 2025 Country Comparison
- World Bank Global Economic Monitor Guide
Green Map creates custom-edited map images using open geographic data sources such as geoBoundaries, Natural Earth, OpenStreetMap, and government open data.
These maps are edited visual materials, not raw data files, and are provided for education, documents, presentations, and graphic reference.