UNESCO Institute for Statistics (UIS) data for 2023 show a highly concentrated pattern in the study destinations of internationally mobile students whose country of origin is the Russian Federation. The verified dataset contains 70 countries and areas for the same reference year. Germany has the largest value at 11,024 students, followed by Czechia at 7,781. The United States is third at about 4,543, while Türkiye, Italy, the United Kingdom and France each report roughly 3,000.
The 70 reported destination rows sum to about 61,753 students. That total should not be described as the complete worldwide number of students from the Russian Federation, because it only adds the destinations present in this verified extract. Within those 70 rows, the top 10 destinations account for about 67.9% of the total, and Germany plus Czechia alone account for about 30.5%. The data therefore show a strongly concentrated destination distribution.
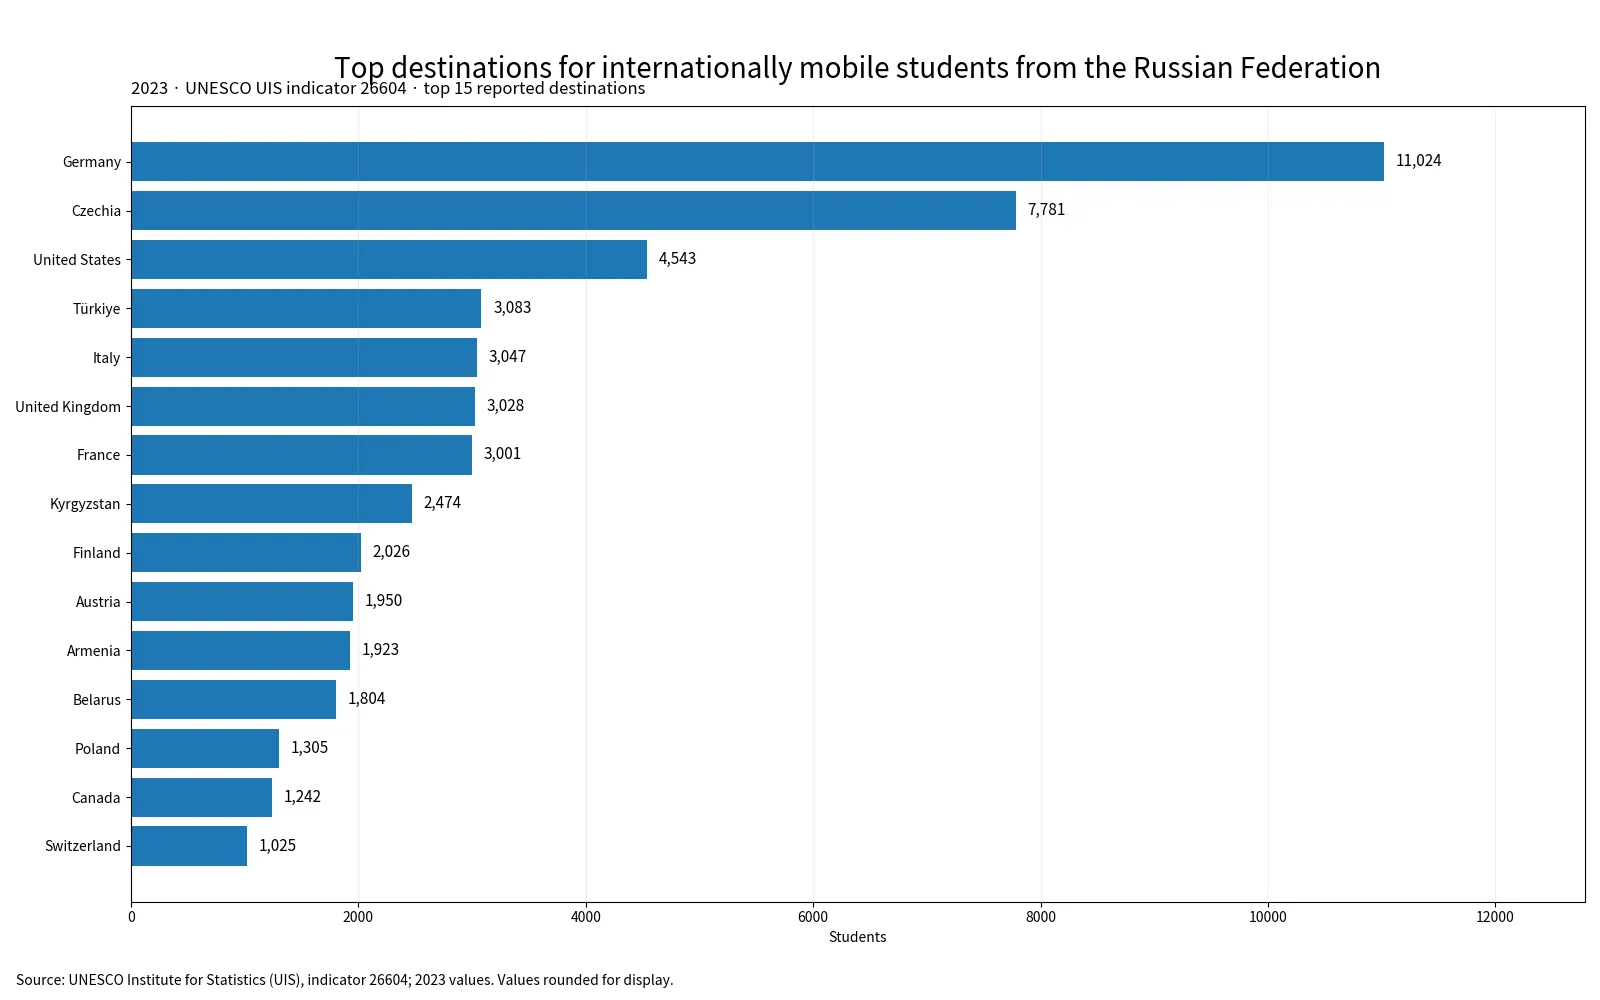
Table of Contents
What this indicator counts
UIS uses the term “internationally mobile students” for people who physically cross an international border to participate in education in a destination country that differs from their country of origin. For tertiary education, country of origin is preferably based on the country where the student obtained upper-secondary qualifications. If that cannot be used, usual or permanent residence may be used, with citizenship recommended only as a last resort. “From the Russian Federation” therefore should not automatically be read as a pure nationality count.
Physical movement matters to the definition. A student taking distance-learning courses from a foreign institution while remaining in the origin country is not internationally mobile under the UIS concept. Nor is enrolment in a foreign institution operating inside the origin country, if no international border is crossed. The indicator is for both sexes combined, so it describes the overall count rather than a male-female split.
Germany and Czechia are the two largest destinations
Germany’s 11,024 students represent about 17.9% of the sum across the 70 reported destination rows. Czechia contributes 7,781, or about 12.6%. Together they account for roughly 18,805 students. The United States is third with about 4,543, followed by Türkiye at 3,083, Italy at 3,047, the United Kingdom at 3,028 and France at about 3,001.
European destinations occupy many of the highest positions, but this dataset does not identify the reasons behind those choices. It cannot by itself tell us whether visa rules, tuition, language, geographic proximity, university reputation, scholarships or political conditions caused the observed pattern. The United States ranking third and Kyrgyzstan ranking eighth also show that the distribution is not confined to one geographic cluster.
| Rank | Destination | Students in 2023 |
|---|---|---|
| 1 | Germany | 11,024 |
| 2 | Czechia | 7,781 |
| 3 | United States | 4,543 |
| 4 | Türkiye | 3,083 |
| 5 | Italy | 3,047 |
| 6 | United Kingdom | 3,028 |
| 7 | France | 3,001 |
| 8 | Kyrgyzstan | 2,474 |
| 9 | Finland | 2,026 |
| 10 | Austria | 1,950 |
| 11 | Armenia | 1,923 |
| 12 | Belarus | 1,804 |
| 13 | Poland | 1,305 |
| 14 | Canada | 1,242 |
| 15 | Switzerland | 1,025 |
About 68% are concentrated in the top 10 destinations
The median across the 70 rows is 264.5 students, or about 265 when rounded. Germany is more than 40 times that median. There are 16 destinations with at least 1,000 students and 26 with fewer than 100. This is a long-tailed distribution in which a relatively small group of destinations contains a large share of the reported students.
The top 10 are Germany, Czechia, the United States, Türkiye, Italy, the United Kingdom, France, Kyrgyzstan, Finland and Austria. Together they account for about 41,957 students, or 67.9% of the 70-row total. The top five alone make up about 47.7%, so the observed students are far from evenly spread across all reported destinations.
Mid-sized and small destinations still matter
Below the top 10, Armenia reports 1,923 students, Belarus 1,804, Poland 1,305, Canada 1,242 and Switzerland 1,025. The Republic of Korea reports 1,015 and ranks 16th among the 70 observations. Slovakia has 961, Spain 781, Ukraine 655 and Uzbekistan 648, followed by a broad range of destinations in the hundreds or lower.
There are 26 rows below 100 students. Small values should not be interpreted as proof that a destination attracts virtually no students from the Russian Federation in every possible dataset. International student statistics depend on national reporting coverage and classification practices, and a country that does not appear in this 70-row extract must not be converted to zero. Missing, unreported and zero are different statistical states.
A common 2023 reference year makes the ranking easier to read
Many cross-country datasets combine each country’s latest available observation, which can produce comparisons spanning several years. This extract is simpler: all 70 rows are dated 2023. That removes one major source of ambiguity and allows the destination counts to be compared within a single reference year.
A common year does not eliminate every comparability issue. UIS applies international definitions, standards and quality-control procedures, but national administrative systems can differ in how they identify and report mobile students and their country of origin. Large gaps of hundreds or thousands are therefore more informative than fine distinctions based on a few students or small decimal differences.
Why some student counts contain decimals
Although the unit is a number of students, the source returns decimal values for some destinations. The United States is 4,542.875, France 3,001.465 and Austria 1,949.855 in the verified file. Such values can arise when statistical systems store estimated, allocated or otherwise processed figures as continuous numbers. The chart and table round these values to the nearest whole student for readability.
All calculations use the original unrounded values. The 67.9% top-10 share and the approximately 61,753 total across the 70 rows are therefore calculated from the verified source values rather than by re-adding the rounded display numbers. This keeps the public presentation simple without reducing calculation precision.
What the data can and cannot tell us
- It can show the 2023 count reported for each destination and the large differences between countries.
- It can support rankings, concentration measures, medians and distribution summaries across the 70 verified rows.
- It cannot explain individual destination choices, visa approval rates, tuition costs, scholarship availability or post-study employment.
- It cannot turn the sum of these 70 rows into a guaranteed complete worldwide total of all students from the Russian Federation studying abroad.
- Missing destinations must not be treated as zero, and country of origin should not be reduced automatically to citizenship.
Data source and calculation method
The statistical source is UNESCO Institute for Statistics indicator 26604, using national observations dated 2023. The underlying records come from the UNESCO UIS Data API. The interpretation of internationally mobile students follows the UIS Data Browser glossary. UIS manages tertiary student-mobility data through official education statistics and the joint UNESCO-OECD-Eurostat collection framework.
This comparison uses 70 countries and areas with verified 2023 values. The rankings, median, concentration shares and totals are calculated directly from the source values. Missing values are not replaced with zero. The bar chart shows the top 15 destinations, and decimal source values are rounded only for display.
Frequently Asked Questions
Does “from the Russian Federation” mean Russian citizenship?
Not necessarily. UIS prefers country of prior education for tertiary students, with usual or permanent residence as an alternative and citizenship used only as a last resort when better measures are unavailable.
Is Germany’s 11,024 equal to 17.9% of all Russian students studying abroad worldwide?
It is about 17.9% of the sum across the 70 verified destination rows in this dataset. That 70-row sum should not automatically be treated as a complete worldwide total.
Are all destinations compared for the same year?
Yes. All 70 verified rows are dated 2023, so the ranking does not mix different reference years.
Does a destination missing from the dataset have zero students?
No. Missing or unreported is not the same as zero. Destinations absent from this 70-row extract must not be assigned a zero value.
Related Articles
- Private tertiary enrolment share by country
- Compulsory education duration by country in 2025
- Government education spending as a share of GDP
Green Map creates custom-edited map images using open geographic data sources such as geoBoundaries, Natural Earth, OpenStreetMap, and government open data.
These maps are edited visual materials, not raw data files, and are provided for education, documents, presentations, and graphic reference.