Bond County in southwestern Illinois is organized around Greenville, with smaller towns spread toward nearly every edge of the county. Mulberry Grove lies to the east, Pocahontas and Pierron are southwest of Greenville, Keyesport sits near the southeast corner, and Sorento occupies the northwestern side. Between those communities, the maps show a dense network of creeks and shallow valleys rather than one dominant river corridor.
This Bond County Map page combines a detailed county overview, a simplified ranked-city map, a terrain-and-water map, and an elevation map. You can download high-resolution JPG copies of all four supplied maps in one ZIP file, using the same images shown here for printing, classroom work, presentations, or closer study. The maps are designed for county-scale geographic reference and should not be treated as parcel, flood, navigation, or survey products.
Bond County’s official website notes that the county was formed from Madison County in 1817 and named for Shadrach Bond, who later became Illinois’ first governor. On the supplied maps, Greenville is the strongest urban reference point and includes labels for the Bond County Courthouse and Bond County Emergency Medical. From there, roads, creeks, and the nearby Governor Bond Lake make it easy to connect the county’s settlements with its physical landscape.
Table of Contents
Greenville provides the clearest starting point
The county overview places Greenville slightly east of the center, where several roads meet and the largest built-up area appears. Route 140 crosses the county from the west toward Greenville, while I-70 and U.S. 40 run through the southwestern side near Pocahontas before continuing toward the Greenville area and beyond. Smithboro lies immediately east of Greenville, and Mulberry Grove is farther east near the county boundary.
Other communities help define the county’s outer edges. Sorento sits in the northwestern projection, Pierron lies near the southern-left side, and Keyesport is close to the southeastern corner. Panama and Donnellson appear just beyond the northern boundary, providing useful outside references. The pattern is not a tight cluster of towns but a central city with smaller communities spread across a broad rural area.
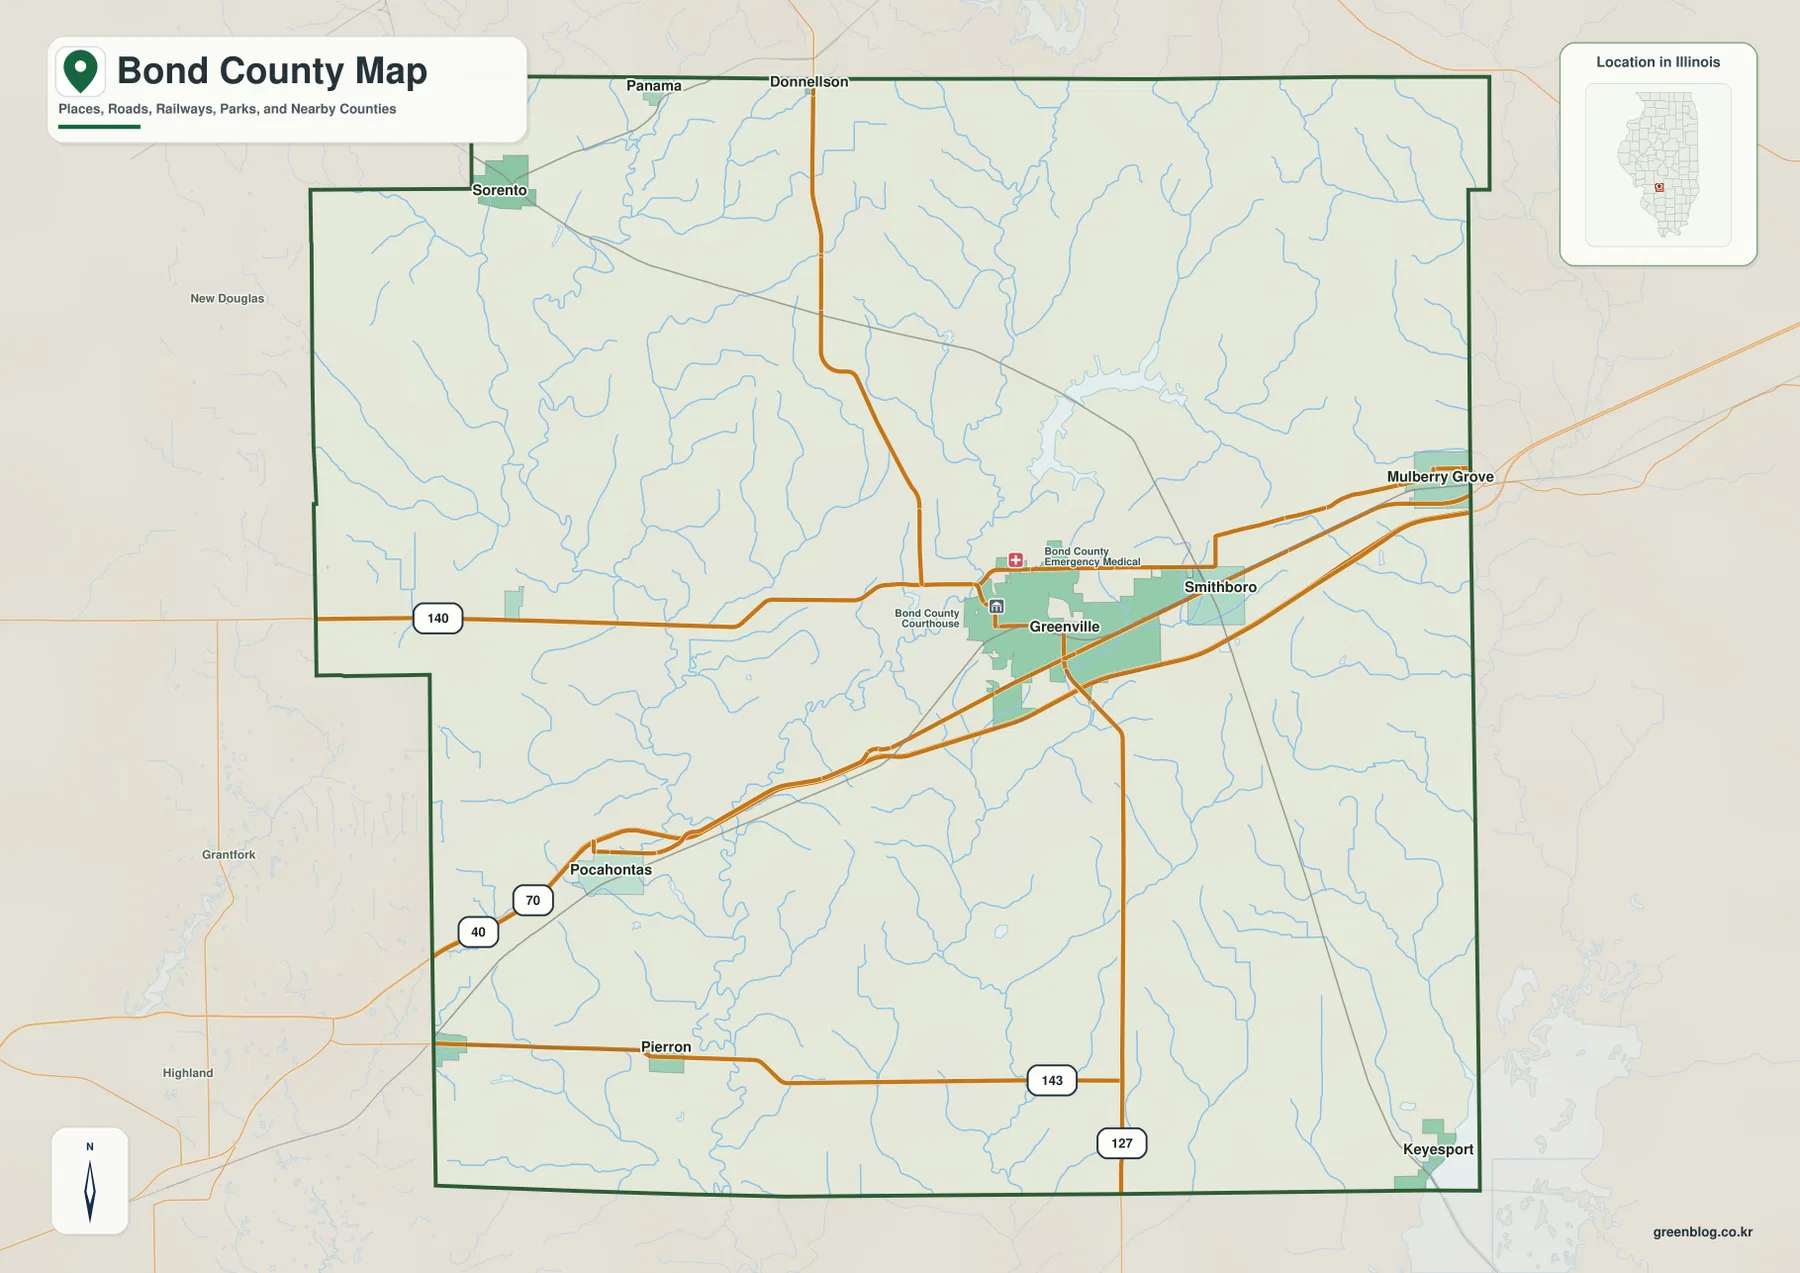
Blue stream lines fill much of the space between towns. Governor Bond Lake is visible northeast of Greenville, and smaller drainage lines branch across the northwestern and southern parts of the county. Route 127 runs south toward the lower county boundary, while Route 143 crosses the southern area. Near Keyesport, the map also points toward the Carlyle Reservoir area beyond Bond County’s southeastern edge.
Use the overview for orientation, not live travel or parcel decisions
The overview works well for seeing how Greenville, the smaller towns, roads, and streams fit together. It does not show current road closures, construction, lane details, legal parcel lines, or private access. Those questions require current transportation, assessor, or land-management information rather than a general county map.
Six ranked places show a wide spread around Greenville
The city-distribution map removes most road detail and emphasizes six locations. Greenville is ranked number 1, followed by Pocahontas, Mulberry Grove, Keyesport, Sorento, and Pierron. The printed CITY INDEX gives values of 7,235 for Greenville, 843 for Pocahontas, 765 for Mulberry Grove, 635 for Keyesport, 472 for Sorento, and 414 for Pierron.
The map does not display a census year or statistical date beside those figures, so this article does not present them as current population counts. They are treated as values printed on the supplied city map. The geographic message is clear regardless of date: Greenville is the dominant mapped center, while the five smaller places are spread toward the southwest, east, southeast, and northwest.
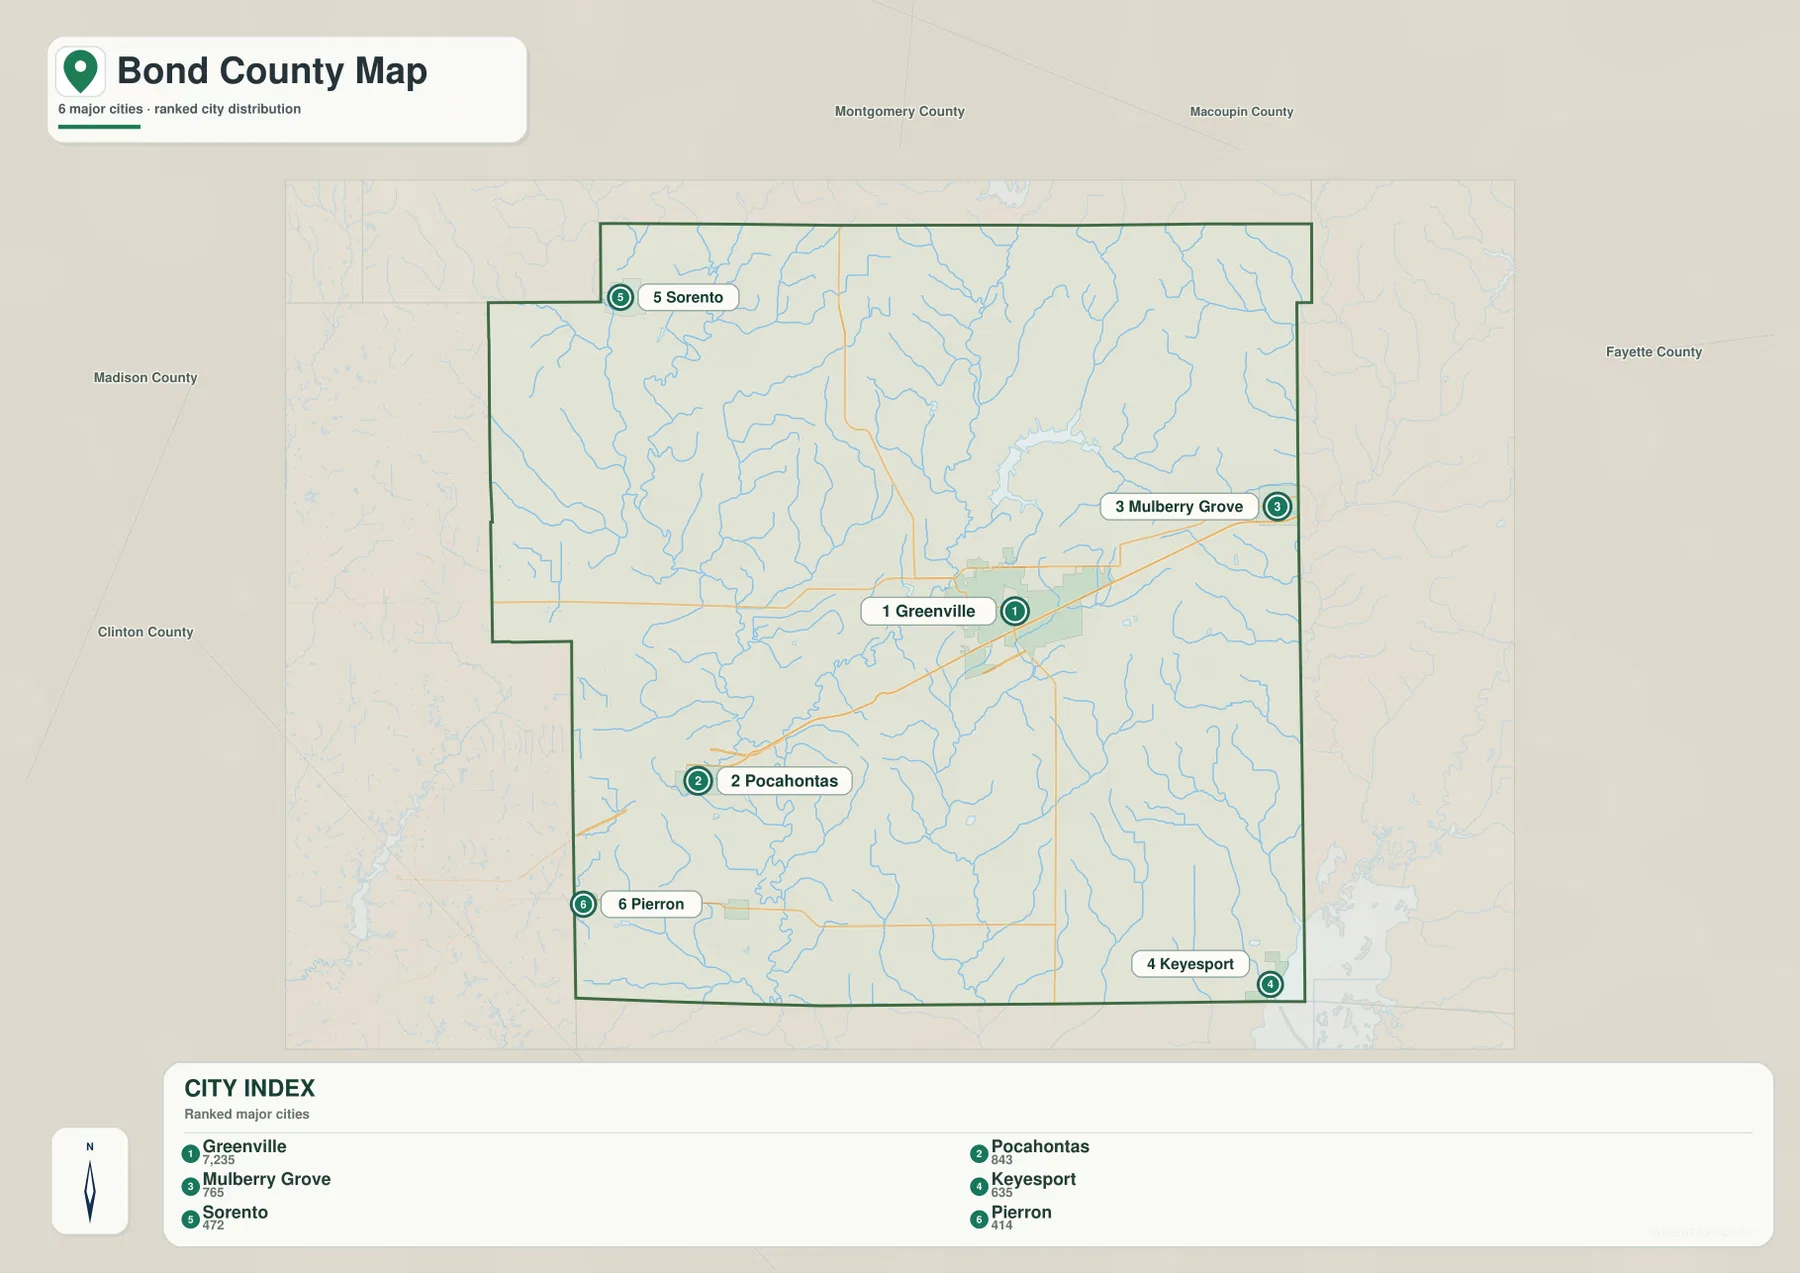
The simplified positions make the county easier to remember. Mulberry Grove is east of Greenville, Pocahontas and Pierron are in the southwestern half, Sorento is near the northwest corner, and Keyesport lies at the southeast edge. Neighboring county labels around the frame add another layer of orientation without crowding the map with street-level detail.
The CITY INDEX is not a dated census table
The printed numbers are useful for comparing the map’s ranked places, but their date is not shown on the graphic. If a report needs current official population figures, consult a dated U.S. Census Bureau source. Here, the city map is used primarily to explain the relative prominence and location of the six labeled communities.
Governor Bond Lake and the Shoal Creek network
The terrain-and-water map replaces road emphasis with drainage features. Governor Bond Lake is the largest named water body inside the county and sits northeast of Greenville. East Fork Shoal Creek runs through the central part of the county, while Shoal Creek lies farther west. Indian Creek connects into the central drainage, and the northwestern area includes Yankee Creek, Dry Fork, and Little Dry Fork.
Farther south, Beaver Creek and Little Beaver Creek curve across the lower half of the county. Smaller features such as White Branch and Fish Branch appear toward the southeast. Carlyle Reservoir is shown immediately outside the county’s southeastern side, giving the Keyesport area a clear regional water reference even though most of the large reservoir lies beyond Bond County.
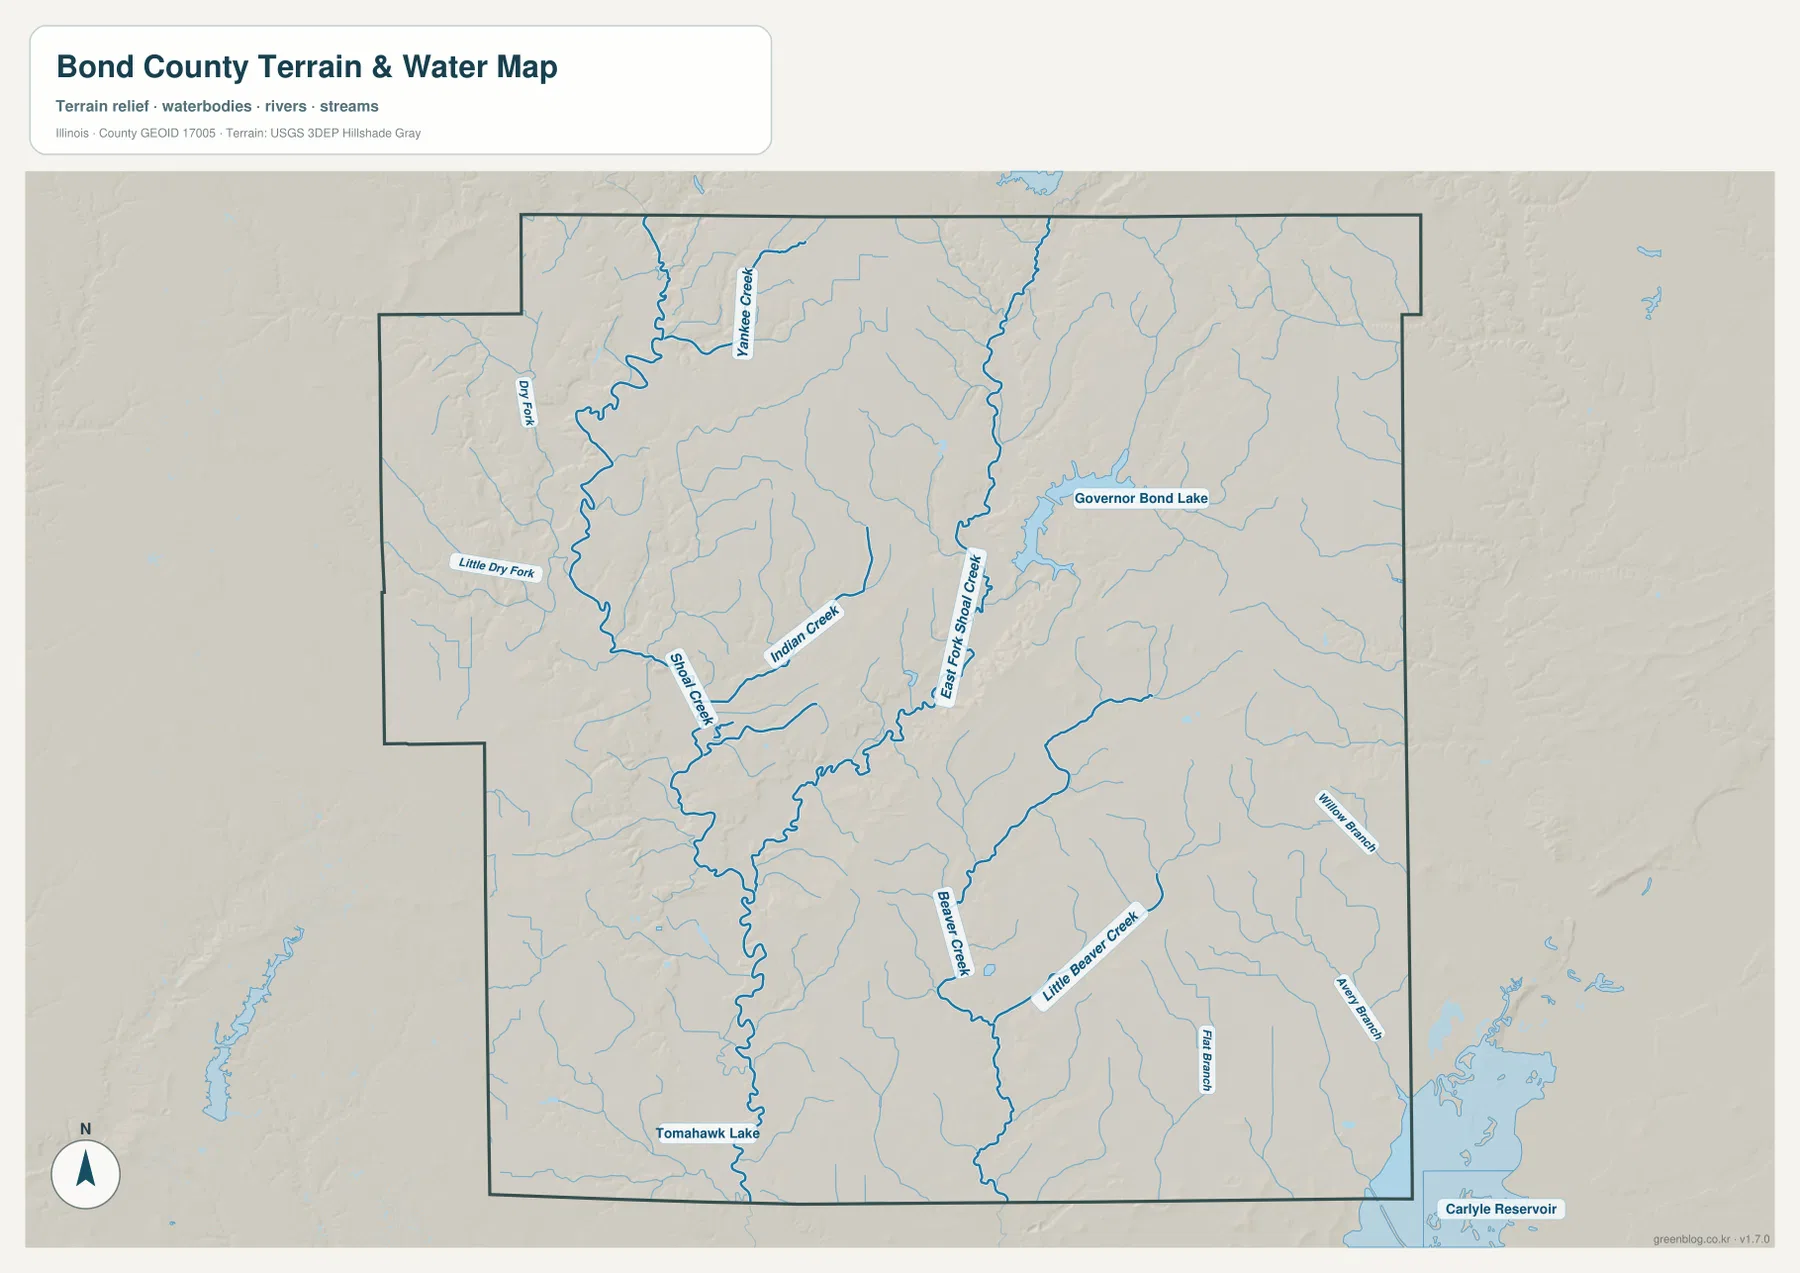
The City of Greenville’s official page says Governor Bond Lake was built in the late 1960s as a water supply for Greenville and surrounding communities and is approximately 775 acres in size. The same page also describes fishing, boating, and other recreational use. On the map, the lake’s position northeast of Greenville makes it one of the easiest natural landmarks to connect with the county’s main population center.
The water map is not a flood or navigation product
This map shows the locations of lakes, creeks, tributaries, and surrounding terrain. It does not provide flood-hazard zones, live water levels, depths, boating rules, water rights, or legal access. Current City of Greenville and responsible agency information should be used for lake regulations, safety, flood, or water-management decisions.
Low creek valleys cut through higher northern ground
The elevation map turns the drainage pattern into a clear color contrast. A broad green lowland runs through the central part of the county and continues into much of the south. Yellow, tan, and brown become more common toward the northern half, where higher rolling ground surrounds narrow green valleys. Additional ridges appear in the east-central area, while the southeastern side is generally lower and smoother.
The map reports an actual countywide elevation range of about 135 to 204 meters and a mean of about 164 meters. Its legend uses several color bands from roughly 140 to 186 meters, while the separate “Actual” line records the wider minimum and maximum found in the mapped data. Those endpoints summarize the county and should not be assigned directly to Greenville, Sorento, or any specific road or property.
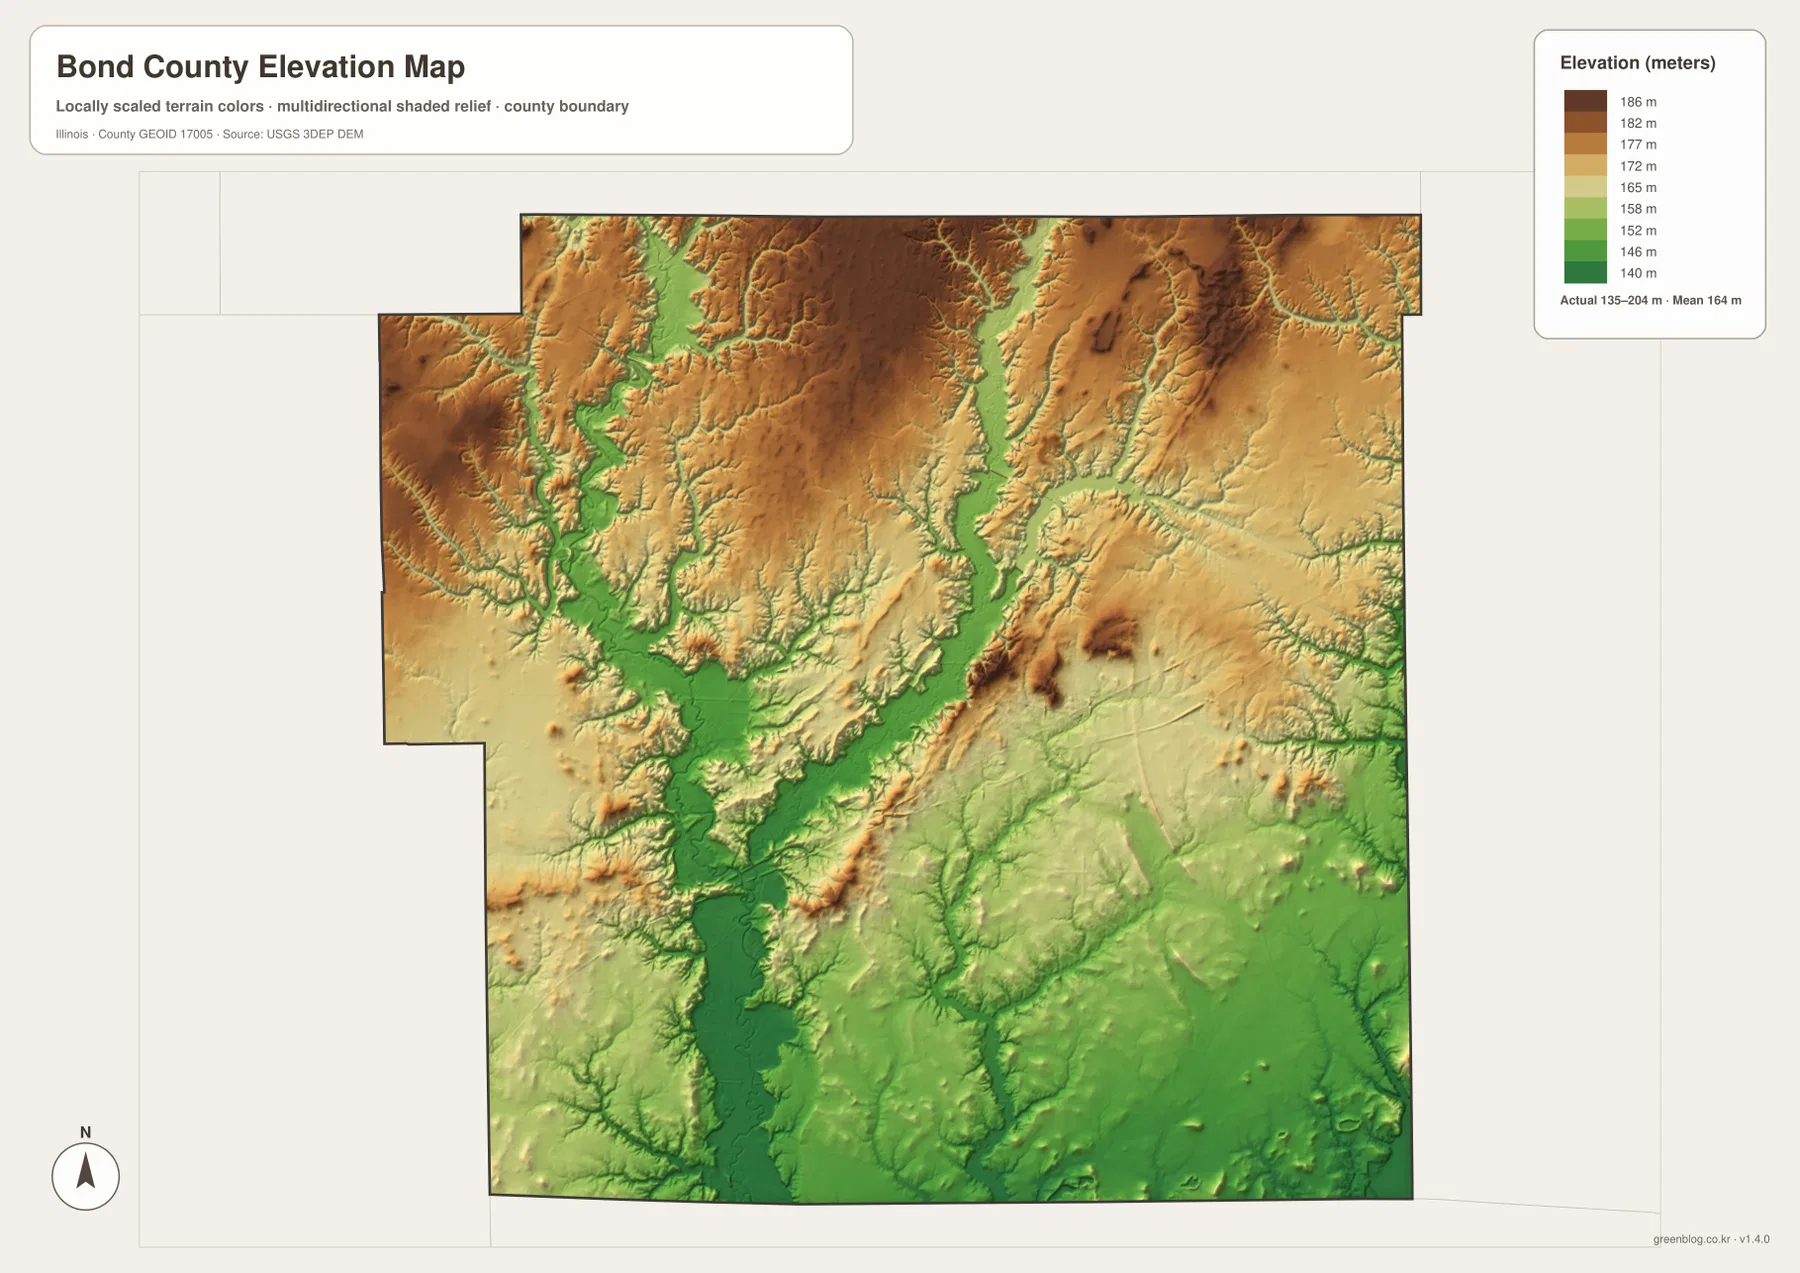
Comparing the elevation and water maps makes the pattern easier to recognize. The green central corridor broadly follows the low country associated with Shoal Creek and East Fork Shoal Creek, while many smaller northern streams run through narrow lower cuts between higher ridges. The map is useful for broad comparisons across Bond County, but it does not provide survey-grade elevation for an individual site.
135 to 204 meters is a countywide range
An exact elevation for a building site, road grade, drainage project, or parcel requires location-specific source data or a professional survey. The low and high endpoints shown here belong to the countywide elevation dataset. They are best used to understand the general difference between lower creek valleys and higher rolling ground.
Choose the Bond County map that matches the question
Use the county overview when you want Greenville, smaller towns, major roads, county boundaries, and streams together. The city-distribution map is better for quickly comparing Greenville, Pocahontas, Mulberry Grove, Keyesport, Sorento, and Pierron. Choose the terrain-and-water map for Governor Bond Lake, Shoal Creek, East Fork Shoal Creek, and smaller tributaries. The elevation map is the clearest choice for comparing the lower central and southern valleys with higher northern ground.
A practical sequence is to begin with Greenville on the overview, then look outward toward Mulberry Grove, Pocahontas, Sorento, and Keyesport. Next, simplify the settlement pattern with the city map. Move to the water map to locate Governor Bond Lake and the two Shoal Creek channels, and finish with elevation to see how those water features occupy lower ground between the surrounding hills.
Each map has a defined purpose. The overview is not a parcel or live-traffic product, the CITY INDEX is not presented as a current census table, the water map does not assess flood or navigation conditions, and the elevation surface is not survey-grade. Within those limits, the set works well for printed reference sheets, teaching, presentations, county orientation, and trip-planning context.
Frequently Asked Questions
Where is Governor Bond Lake in relation to Greenville?
The supplied maps place Governor Bond Lake northeast of Greenville. The City of Greenville describes it as a local water-supply and recreational lake. For access, permits, or current lake-use rules, consult the city’s latest Governor Bond Lake information.
Are the CITY INDEX numbers current population counts?
This page does not treat them as current population figures because the supplied map does not display a census year or statistical date beside the index. When an official current population figure is required, use a dated U.S. Census Bureau source.
Does 135 to 204 meters give Greenville’s elevation?
No. The elevation map identifies 135–204 m as the actual range across the Bond County dataset and gives a mean of about 164 m. Exact elevation for Greenville or any specific road, property, or structure requires point-specific elevation or survey data.
Sources and Reference Material
The article uses the supplied Bond County maps together with the official references below. For current road conditions, lake regulations, legal boundaries, or exact point elevations, use the responsible agency’s current source data rather than these explanatory county maps.
- Bond County Official Website – county background and government information
- City of Greenville – Governor Bond Lake – lake history, use, and local information
- U.S. Census Bureau TIGER/Line Shapefiles – county boundaries and geographic reference data
- USGS National Hydrography – rivers, streams, lakes, and related hydrography data
- USGS 3D Elevation Program – elevation and terrain data
Map File Information
The high-resolution JPG originals for the Bond County overview, ranked-city map, terrain-and-water map, and elevation map are bundled in one ZIP file. Each image is a 3,638 × 2,572-pixel landscape file suitable for larger displays, printed reference sheets, lessons, and presentation graphics.
- Included Files: 4 high-resolution JPG maps
- Printable Size: 3,638 × 2,572 pixels each
Related Maps
Green Map creates custom-edited map images using open geographic data sources such as geoBoundaries, Natural Earth, OpenStreetMap, and government open data.
These maps are edited visual materials, not raw data files, and are provided for education, documents, presentations, and graphic reference.