Gender gaps in international tertiary student mobility to North America and Western Europe vary sharply by country of origin. In the 2023 UNESCO Institute for Statistics (UIS) data, the adjusted gender parity index (GPIA) covers 198 countries and areas. The median is 1.024, which is close to parity, but that central value hides a very wide distribution. A total of 124 observations are more than 0.20 away from 1, and 25 are more than 0.50 away.
This is not a simple female-to-male student-count ratio. UIS first calculates the mobile outbound gross enrolment ratio for female and male tertiary students from each origin country who study in North America and Western Europe, then expresses the gender relationship as an adjusted parity index. A GPIA of 1 means the two sex-specific mobility rates are equal. Values above 1 indicate a higher female mobility rate; values below 1 indicate a higher male mobility rate.
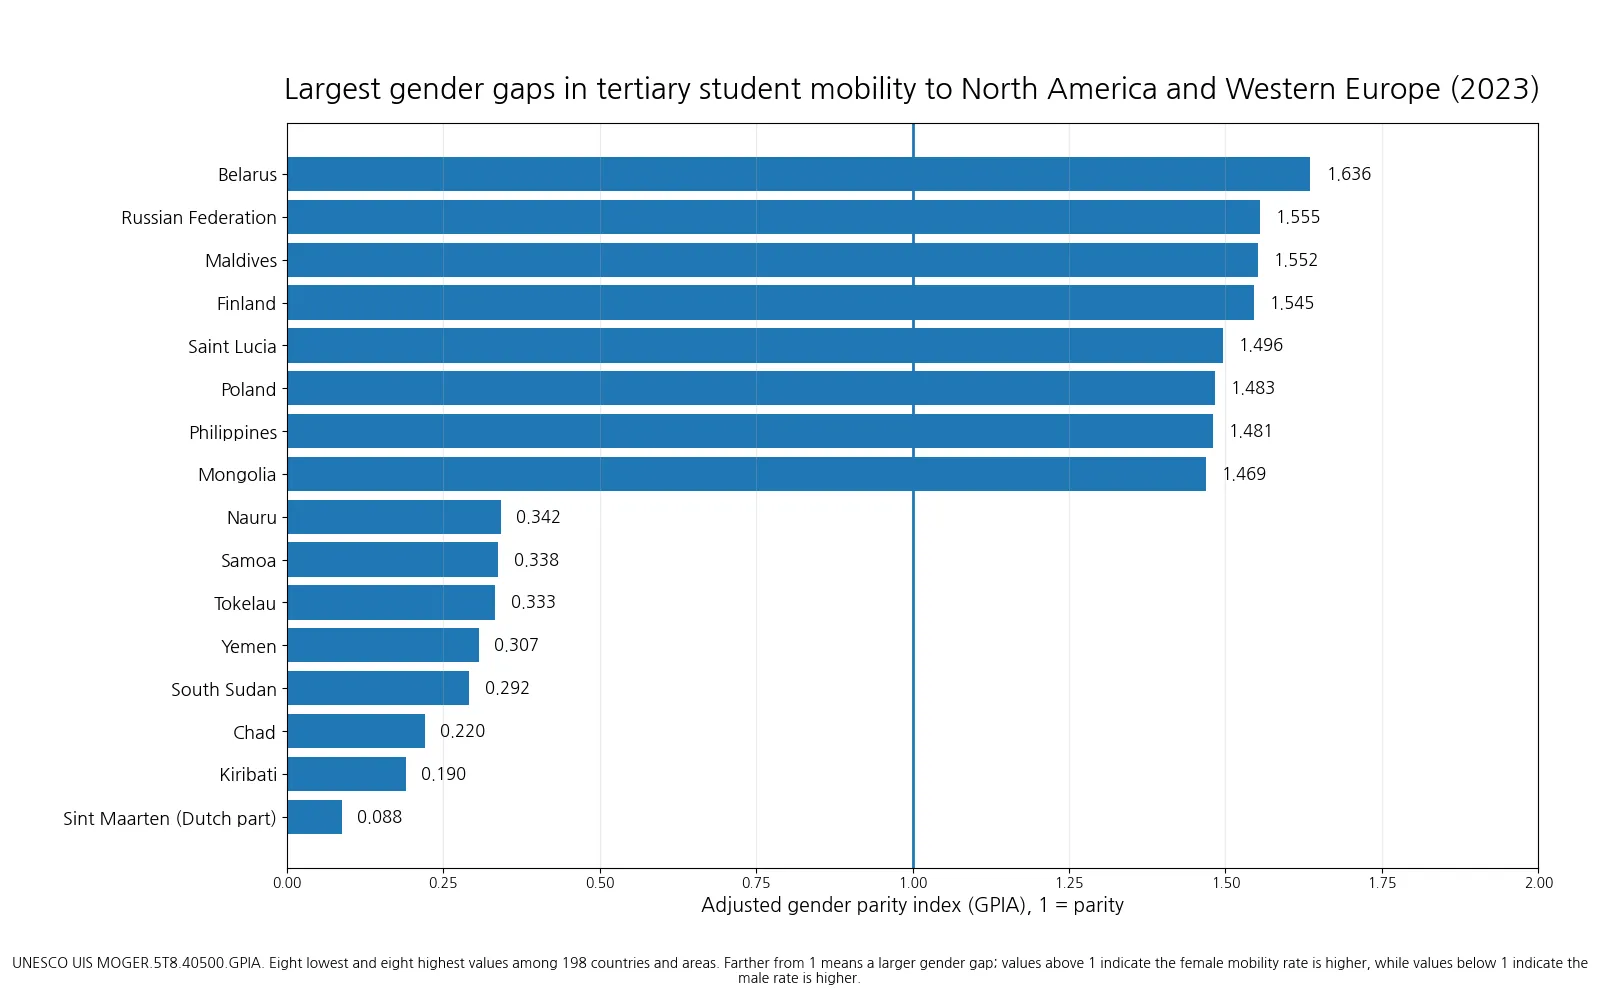
Table of Contents
What this indicator actually compares
UIS defines the mobile outbound gross enrolment ratio as total enrolment of internationally mobile tertiary students studying in a host country or region, expressed relative to the population in the five-year age group immediately following the end of upper secondary education. Student age does not limit the numerator. The denominator is therefore not all tertiary students, and the measure is not the share of a country’s existing college students who went abroad.
For MOGER.5T8.40500.GPIA, the destination is fixed as North America and Western Europe. The country rows are countries of origin. Finland’s value, for example, does not describe foreign students enrolled in Finland. It describes the gender relationship in the mobility rate of students from Finland who study at the tertiary level in the specified destination region. Reversing origin and destination would change the meaning of the indicator completely.
Why adjusted gender parity is centered on 1
The conventional gender parity index is generally formed by dividing the female value of an indicator by the male value. A raw ratio is not symmetric around 1: a value of 0.5 means the female indicator is half the male value, while an unadjusted value of 1.5 does not represent the exact mirror image. UIS therefore uses an adjusted transformation for ratios above 1 so that disparities on either side of parity can be compared on a common 0-to-2 scale.
That adjustment matters for interpretation. A GPIA of 1.50 should not be described as “the female mobility rate is 1.5 times the male rate.” It means the result lies on the female-higher side of parity and is 0.50 away from 1 on the adjusted scale. To recover or compare the underlying female and male gross mobility rates themselves, those sex-specific indicators must be consulted directly.
Only 14 of 198 observations fall in the usual parity band
Using the commonly applied UIS parity interval of 0.97 to 1.03, only 14 of the 198 observations, or 7.1%, fall within the band. Another 98 (49.5%) are above 1.03 and 86 (43.4%) are below 0.97. This does not establish one universal global gender advantage. It shows that sizable country-level gender differences are common in this specific route of tertiary mobility.
The unweighted median is 1.024 and the mean is 0.969. The first quartile is 0.679 and the third quartile is 1.238, so even the middle half of observations spans a broad range. The mean is pulled downward by very low values and should not be interpreted as a student-weighted global gender ratio. Every country or area receives one equal statistical row regardless of population size or number of internationally mobile students.
| GPIA range | Countries/areas | Share of 198 |
|---|---|---|
| Below 0.97 | 86 | 43.4% |
| 0.97–1.03 | 14 | 7.1% |
| Above 1.03 | 98 | 49.5% |
The highest and lowest values show very different directions
Belarus has the highest 2023 GPIA at 1.636. The Russian Federation follows at 1.555, with Maldives at 1.552 and Finland at 1.545. Saint Lucia, Poland, the Philippines and Mongolia are also above 1.46. These values indicate that the female mobile outbound gross enrolment ratio is higher than the male rate for tertiary study in North America and Western Europe. They do not tell us that these countries have the largest numbers of female students abroad.
At the other end, Sint Maarten (Dutch part) is 0.088, Kiribati 0.190, Chad 0.220, South Sudan 0.292 and Yemen 0.307. These indicate a much higher male mobility rate. Extreme parity indices can sometimes arise where the underlying numbers or rates for one sex are small, especially in small states and territories, but this dataset does not include the sex-specific counts needed to diagnose that mechanism. The values should therefore be treated as signals for deeper inspection rather than causal explanations.
| Country/area | 2023 GPIA | Direction |
|---|---|---|
| Belarus | 1.636 | Higher female mobility rate |
| Russian Federation | 1.555 | Higher female mobility rate |
| Maldives | 1.552 | Higher female mobility rate |
| Finland | 1.545 | Higher female mobility rate |
| Poland | 1.483 | Higher female mobility rate |
| Pakistan | 0.368 | Higher male mobility rate |
| Yemen | 0.307 | Higher male mobility rate |
| South Sudan | 0.292 | Higher male mobility rate |
| Chad | 0.220 | Higher male mobility rate |
| Kiribati | 0.190 | Higher male mobility rate |
Several countries are very close to parity
The United Kingdom is closest to 1 at 0.997. The British Virgin Islands are 1.004, Sri Lanka 1.007 and El Salvador 1.009. Montserrat at 0.989 and Australia at 0.987 are also inside the 0.97–1.03 parity range. New Zealand, Mexico and Anguilla sit just above 1 but remain close to the parity threshold.
The correct wording is that the sex-specific mobile outbound gross enrolment ratios are similar, not necessarily that equal numbers of women and men study abroad. The ratio uses population denominators for each sex and is a gross enrolment measure, so headcounts and rates answer different questions. A country could have similar GPIA with very different absolute numbers of outbound students.
| Country/area | 2023 GPIA |
|---|---|
| United Kingdom | 0.997 |
| British Virgin Islands | 1.004 |
| Sri Lanka | 1.007 |
| El Salvador | 1.009 |
| Montserrat | 0.989 |
| Australia | 0.987 |
| New Zealand | 1.018 |
| Mexico | 1.020 |
| Anguilla | 1.022 |
| Macao SAR, China | 0.976 |
A high or low GPIA is not a score of educational quality
The index measures disparity, not performance. A value near 1 says that the female and male mobility rates are similar; it does not say that either rate is high. Both could be very low. Likewise, a value far from 1 identifies an imbalance but does not reveal whether the underlying level of outbound mobility is large enough to be policy-significant in absolute terms. The mobile outbound gross enrolment ratio and its parity index should therefore be read together with student counts or the sex-specific rates when those are available.
The Republic of Korea records 1.388 in the 2023 data, placing it on the female-higher side of the distribution. That observation is useful as one country example, but it should not become the organizing axis of a global comparison. Countries with similar GPIA values may still differ greatly in the number of students who move abroad, the size of the relevant age cohort, domestic tertiary participation and the mix of destinations within North America and Western Europe.
All 198 rows use the same 2023 reference year
A major advantage of this dataset is timing. International education tables often combine each country’s latest available value, which can mix observations from widely different years. Here every retained country and area row is dated 2023. The cross-country distribution is therefore not distorted by one country being represented by a 2018 observation and another by a 2023 observation.
A synchronized year does not eliminate every comparability issue. National administrative systems may differ in how they identify internationally mobile students and determine country of origin. Small populations can also produce volatile parity measures. Differences of several tenths from 1 are more informative than tiny rank changes in the second or third decimal place, especially when the sex-specific underlying rates are not displayed alongside the index.
Do not confuse this indicator with other student-mobility measures
UIS publishes several related but distinct measures. Inbound students are counted from the perspective of the host country. Outbound students are counted from the origin country. The outbound mobility ratio uses total tertiary enrolment in the origin country as its denominator. The mobile outbound gross enrolment ratio instead compares internationally mobile tertiary enrolment with the five-year population group immediately following upper-secondary education.
This distinction changes the research question. If the goal is “what share of current university students study abroad?”, the outbound mobility ratio is more direct. If the goal is to compare the scale of international tertiary mobility with the population at the usual transition age, the mobile outbound gross enrolment ratio is the relevant measure. The GPIA used here adds a gender-disparity layer to that second measure for a fixed destination region.
What the data can and cannot tell us
- It can show the direction and magnitude of gender disparity in the 2023 mobile outbound gross enrolment ratio for tertiary students from each origin country studying in North America and Western Europe.
- It can identify which of the 198 countries and areas are close to parity and which lie far from 1 on the adjusted scale.
- It cannot reveal the actual female and male student headcounts or reconstruct both sex-specific mobility rates from GPIA alone.
- It cannot establish whether tuition, scholarships, visa rules, language, household income, safety, migration policy or other factors caused a gender gap.
- It should not be read as an education-quality score, and values above 1 should not be treated as simple female-to-male multiples.
Data source and calculation method
The values come from UNESCO Institute for Statistics indicator MOGER.5T8.40500.GPIA. In the UIS international mobile student framework, this series belongs to outbound students by host region, with North America and Western Europe fixed as the destination region. The definitions of mobile outbound gross enrolment ratio and adjusted parity index follow UIS metadata and glossary conventions.
The source records are 198 national observations dated 2023 from the UNESCO UIS Data API. The broader indicator family is visible in the UIS Data Browser outbound-student section, and definitions can be checked in the UIS glossary. Medians, quartiles, parity-band counts and distances from 1 are calculated directly from the published values; no missing observation is converted to zero.
Frequently Asked Questions
What does a GPIA of 1 mean?
It means the female and male mobile outbound gross enrolment ratios are equal. Values closer to 1 indicate less gender disparity; 0.97–1.03 is commonly used as a practical parity band.
Does a GPIA of 1.5 mean there are 1.5 times as many female students?
No. GPIA is an adjusted parity index, not a raw headcount ratio. A value of 1.5 indicates a large gap on the female-higher side of parity, but it must not be read as a simple 1.5-to-1 count ratio.
Are the countries in the table origins or study destinations?
They are countries of origin. The destination region is fixed as North America and Western Europe, and each row compares the female and male mobility rates from that origin.
Are all 198 observations from 2023?
Yes. All 198 retained country and area rows are dated 2023, allowing a same-reference-year comparison of the adjusted gender parity index.
Related Articles
- Private tertiary enrolment share by country
- Compulsory education duration by country in 2025
- Government education spending as a share of GDP
Green Map creates custom-edited map images using open geographic data sources such as geoBoundaries, Natural Earth, OpenStreetMap, and government open data.
These maps are edited visual materials, not raw data files, and are provided for education, documents, presentations, and graphic reference.