Spending in public secondary institutions can be divided broadly into current expenditure and capital expenditure. UNESCO Institute for Statistics indicator XSPENDP.2T3.FDPUB.FNCUR measures current expenditure as a percentage of total expenditure in public secondary institutions.
Across the 71 country and area observations dated 2022, the unweighted median is 94.1% and the mean is 91.9%. 52 observations are at or above 90%, and 30 are at or above 95%. The Republic of Korea is 83.3%, placing it toward the lower-current-share side of this dataset.
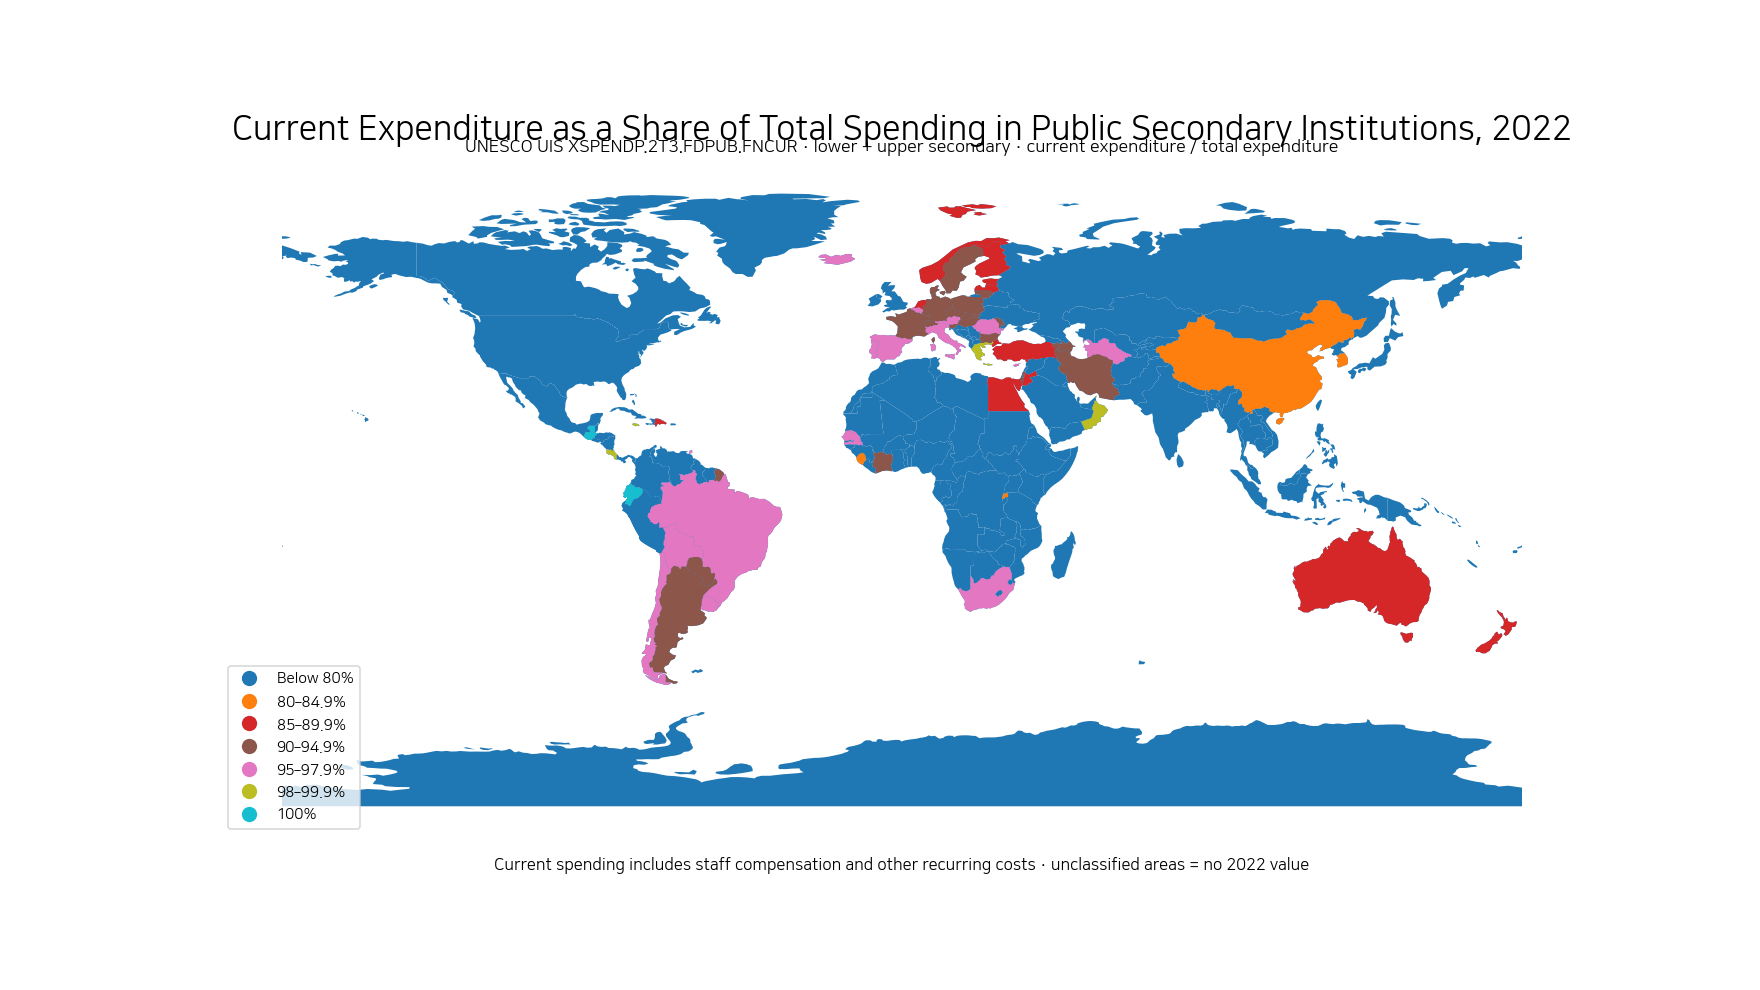
Table of Contents
Current expenditure includes staff compensation and recurring operating costs
UIS defines current expenditure as spending on educational goods and services consumed within the current year and requiring renewal when needed in a following year. It includes staff compensation as well as current expenditure other than staff compensation, such as books and teaching materials, ancillary services, administration and other operating activities.
The indicator therefore should not be read as a salary share. A country with a 90% current-expenditure share may allocate very different portions of that 90% to teachers, non-teaching staff, materials, meals, transport, administration and other recurring costs.
The residual of total spending is the capital-spending share under the UIS framework
UIS expenditure-by-nature classifications distinguish current expenditure from capital expenditure. Capital spending covers assets whose useful life extends beyond the current year, including construction, major renovation and major equipment.
Under that accounting structure, a 90% current-expenditure share leaves about 10% of total expenditure for capital spending, subject to rounding and reporting conventions. A relatively low current share can therefore signal a year in which buildings, facilities or equipment took a larger share of the expenditure envelope.
Fifty-two of the 71 observations are at or above 90%
52 of the 71 observations reach at least 90%. 30 are at or above 95%, 12 are at or above 98%, and 4 are reported at 100%. The distribution is strongly concentrated near the top of the percentage scale.
The first quartile is 89.9% and the third quartile 96.7%. Because so many observations lie between roughly 90% and 100%, the map uses narrow upper-end categories rather than equal 20-point bands. That makes real spatial differences visible instead of placing nearly every country in a single high category.
Guatemala, Ecuador, the Cayman Islands and the Marshall Islands report 100%
Guatemala, Ecuador, the Cayman Islands and the Marshall Islands are reported at 100% in 2022. San Marino is 99.5%, Singapore 99.1%, the Cook Islands 99.1%, Greece 99.0% and Jamaica 99.0%.
A value at or near 100% means nearly all reported total expenditure fell into current rather than capital categories for that year. It should not be interpreted as proof of better fiscal management or as evidence that capital investment was unnecessary. Construction and major equipment spending can be highly project-driven.
| Rank | Country or area | ISO3 | Current expenditure share |
|---|---|---|---|
| 1 | Guatemala | GTM | 100.0% |
| 2 | Ecuador | ECU | 100.0% |
| 3 | Cayman Islands | CYM | 100.0% |
| 4 | Marshall Islands | MHL | 100.0% |
| 5 | San Marino | SMR | 99.5% |
| 6 | Singapore | SGP | 99.1% |
| 7 | Cook Islands | COK | 99.1% |
| 8 | Greece | GRC | 99.0% |
| 9 | Jamaica | JAM | 99.0% |
| 10 | Oman | OMN | 98.6% |
| 11 | Andorra | AND | 98.1% |
| 12 | Costa Rica | CRI | 98.0% |
| 13 | Barbados | BRB | 97.7% |
| 14 | Turkmenistan | TKM | 97.6% |
| 15 | Uruguay | URY | 97.5% |
Korea is 83.3%, implying a comparatively large capital share in 2022
The Republic of Korea records 83.3% in current expenditure. Subtracting from total expenditure leaves about 16.7% as the implied capital share under the current-versus-capital classification.
China is 82.3%, Australia 89.8%, Germany 90.8% and France 90.1%. Brazil is 95.3%, Spain 96.0% and Italy 95.9%. The contrast shows how investment timing can produce large same-year differences even among sizeable education systems.
| Country | Current share | Implied capital share |
|---|---|---|
| Republic of Korea | 83.3% | 16.7% |
| China | 82.3% | 17.7% |
| Australia | 89.8% | 10.2% |
| Germany | 90.8% | 9.2% |
| France | 90.1% | 9.9% |
| Brazil | 95.3% | 4.7% |
| Netherlands | 88.5% | 11.5% |
| Sweden | 92.5% | 7.5% |
| Finland | 89.0% | 11.0% |
| Norway | 87.1% | 12.9% |
| Spain | 96.0% | 4.0% |
| Italy | 95.9% | 4.1% |
Monaco is a major outlier at 45.2%
Monaco has the lowest observation at 45.2%, implying roughly 54.8% for capital expenditure under the same accounting split. El Salvador is 73.7%, the Turks and Caicos Islands 75.3% and Peru 77.6%.
An outlier of this size deserves caution. A major construction or renovation programme, a small denominator, or national reporting characteristics can strongly affect a single-year share. The 2022 result should not be generalized into a permanent long-run spending pattern.
| Low-share rank | Country or area | ISO3 | Current expenditure share |
|---|---|---|---|
| 1 | Monaco | MCO | 45.2% |
| 2 | El Salvador | SLV | 73.7% |
| 3 | Turks and Caicos Islands | TCA | 75.3% |
| 4 | Peru | PER | 77.6% |
| 5 | Rwanda | RWA | 80.6% |
| 6 | Sierra Leone | SLE | 80.8% |
| 7 | China | CHN | 82.3% |
| 8 | Republic of Korea | KOR | 83.3% |
| 9 | New Zealand | NZL | 86.1% |
| 10 | Egypt | EGY | 86.6% |
| 11 | Norway | NOR | 87.1% |
| 12 | Estonia | EST | 87.5% |
The map shows high shares across many reported European and South American countries
Among mapped observations, the median is about 93.1% in Europe and 95.5% in South America. Spain, Italy, Greece, Belgium and Austria are around 95% or higher, while Norway, Finland and the Netherlands sit noticeably lower within Europe.
The mapped Asian median is about 90.3%. Korea and China are on the lower-current-share side, while Singapore and Oman are close to 99%. The within-region spread is large, so a single regional explanation would be too simplistic; investment cycles and national accounting structures matter.
A high current-expenditure share is not automatically better
Current spending pays for teachers and recurring school operations, so it is essential. But a very high share can also mean relatively little capital investment in buildings, laboratories, technology or major equipment during that year.
Conversely, a lower current share may simply reflect a year of major investment rather than weak day-to-day education funding. The indicator is best understood as the composition of spending between recurring operations and longer-lived assets, not as an efficiency or quality score.
The indicator covers lower and upper secondary education together
The code 2T3 spans lower- and upper-secondary education. It therefore differs from indicators that apply only to upper-secondary institutions. This scope difference matters when the result is compared with other UIS finance measures.
For example, the non-staff current-expenditure indicator for upper-secondary institutions measures only one component of current spending and may use a different reference year. Those values should not be subtracted from the 2022 secondary-level figure unless year, education level and denominator are aligned.
One year does not establish a long-term fiscal strategy
Capital expenditure is project-driven. A school-construction programme, large renovation cycle or equipment replacement can sharply increase capital spending in one year and then fall in the next.
For that reason, the 2022 cross-section is useful for comparing the spending composition in that year but not for proving a permanent national preference for current or capital expenditure. A time series is needed for a structural interpretation.
Blank areas on the map are not zero
The statistical dataset contains 71 country and area rows, of which 61 match separate polygons in the low-resolution boundary layer used here. Small islands and territories may have a valid observation without a visible polygon, and countries absent from the 2022 extract remain unclassified.
Missing observations are not filled with zero. The legend is also concentrated between 80% and 100% because that is where most observed values lie, improving the visual resolution of the actual data distribution.
Data source and interpretation
Country values come from the UNESCO UIS Data Browser for XSPENDP.2T3.FDPUB.FNCUR, using the 2022 observations. UIS defines current expenditure on education as spending on educational goods and services consumed within the current year.
The denominator is total expenditure in public secondary institutions and the unit is percent. The difference from 100% is described as the implied capital share under the UIS current-versus-capital framework, allowing for rounding and reporting conventions. The provider is UNESCO UIS, consistent with the source metadata.
Frequently Asked Questions
Does current expenditure mean teacher salaries only?
No. It includes staff compensation and other recurring costs such as books, materials, ancillary services, administration and other school operations.
What does Korea’s 83.3% mean?
About 83.3% of total expenditure in public secondary institutions was current expenditure in 2022. Under the current-versus-capital framework, the implied capital share is about 16.7%.
Is a higher current-expenditure share automatically better?
No. A high share means recurring operations take a larger part of total spending and capital investment a smaller part. Investment needs and project timing must be considered.
Does the indicator cover upper secondary only?
No. Indicator code 2T3 covers both lower- and upper-secondary education.
Related Maps
Green Map creates custom-edited map images using open geographic data sources such as geoBoundaries, Natural Earth, OpenStreetMap, and government open data.
These maps are edited visual materials, not raw data files, and are provided for education, documents, presentations, and graphic reference.