McHenry County sits at a sharp land-cover transition within northeastern Illinois. The 2025 maps show broad agricultural ground across much of the west, while the eastern and southeastern half contains larger developed areas, more lakes and wetlands, and a denser network of hard surfaces. Agriculture is still the largest countywide class at 56.53%, but that single number does not describe the strong east-west contrast visible across the county.
Four views are provided here: current land cover, forest and farmland, impervious surface with developed land, and a 1985–2025 class comparison. The four original JPG maps are available together in one ZIP. Using the set as a group makes it possible to separate questions about what covers the ground today from questions about where pavement is concentrated or where the mapped class differs between the two endpoint years.
Table of Contents
Eastern McHenry County carries the densest developed pattern, while the west remains more open
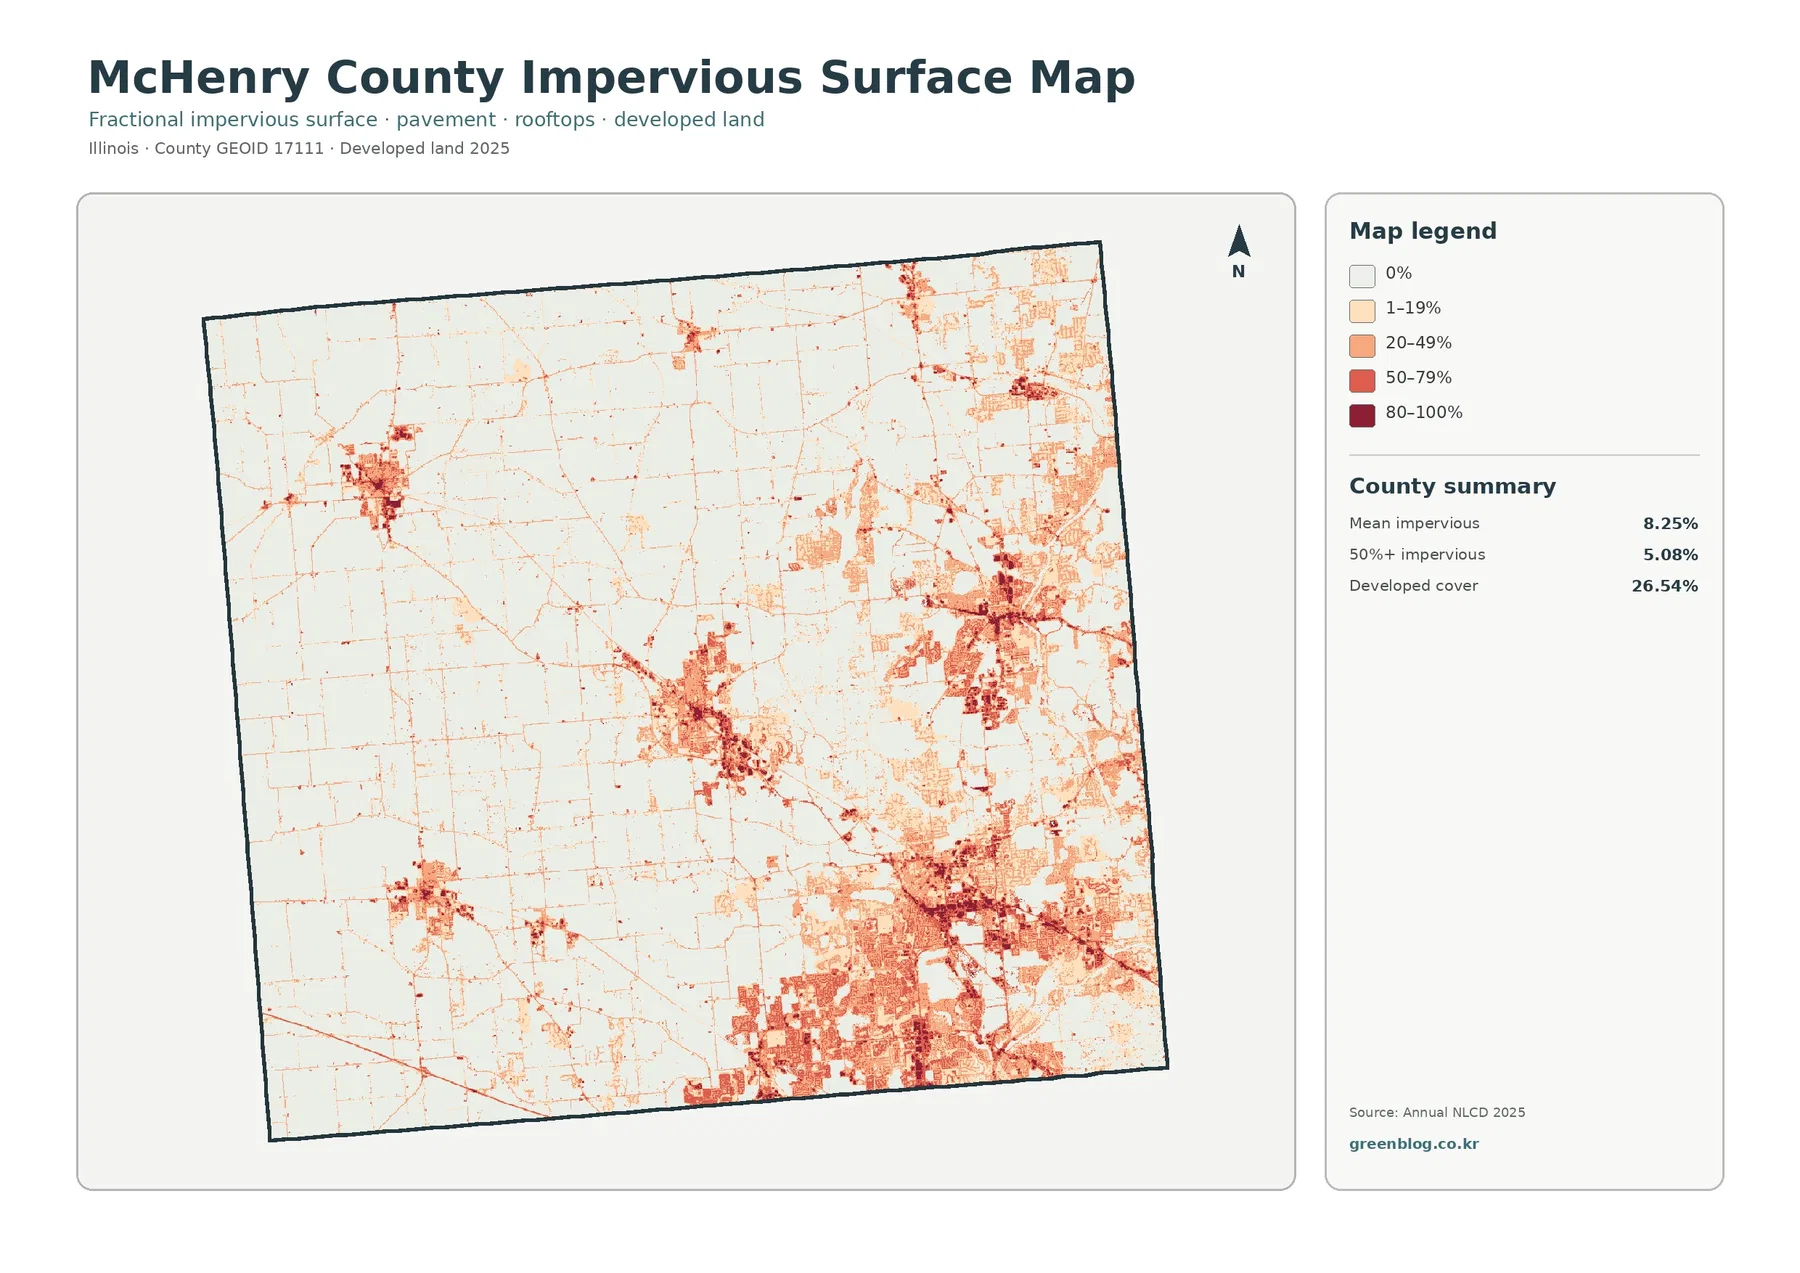
The impervious map makes the county’s settlement pattern easier to recognize than the full land-cover view. Darker red and orange clusters are concentrated through the eastern and southeastern half, where communities such as McHenry, Crystal Lake, Lake in the Hills, Cary, and Algonquin form a much more continuous developed setting. Woodstock stands out as an interior center, while Harvard and Marengo appear as smaller urban islands surrounded by large areas with low impervious values.
McHenry County’s mean impervious value is 8.25%, and 5.08% of the county is mapped above 50% impervious. Those numbers are much lower than the 26.54% developed-cover share on the general map. The measures are not interchangeable. Developed land is a land-cover class that can include lawns, trees, exposed soil, buildings, and streets within a built setting, while the impervious percentage estimates the harder portion such as roofs, parking lots, and pavement.
The full 2025 map explains why 56.53% agriculture does not make McHenry County uniformly rural
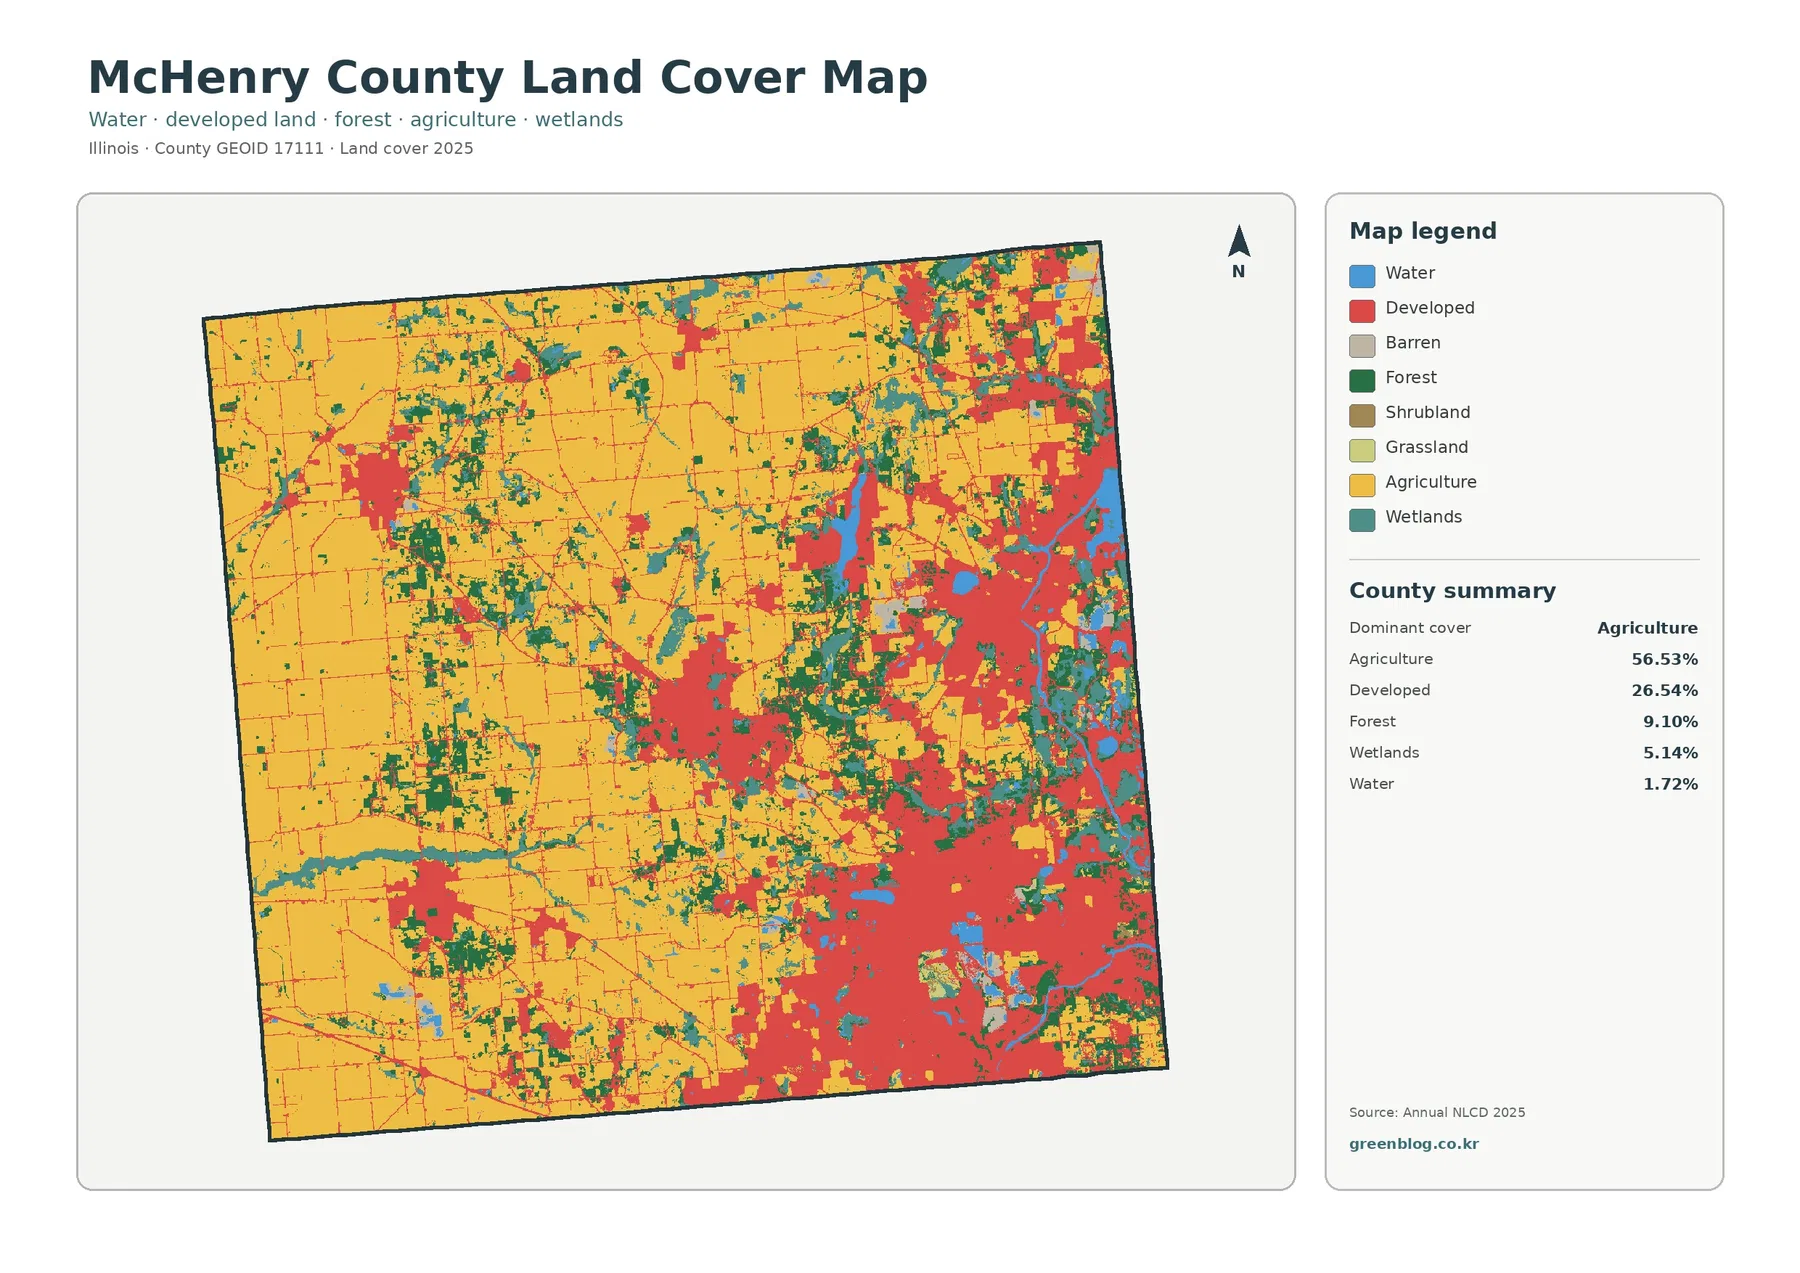
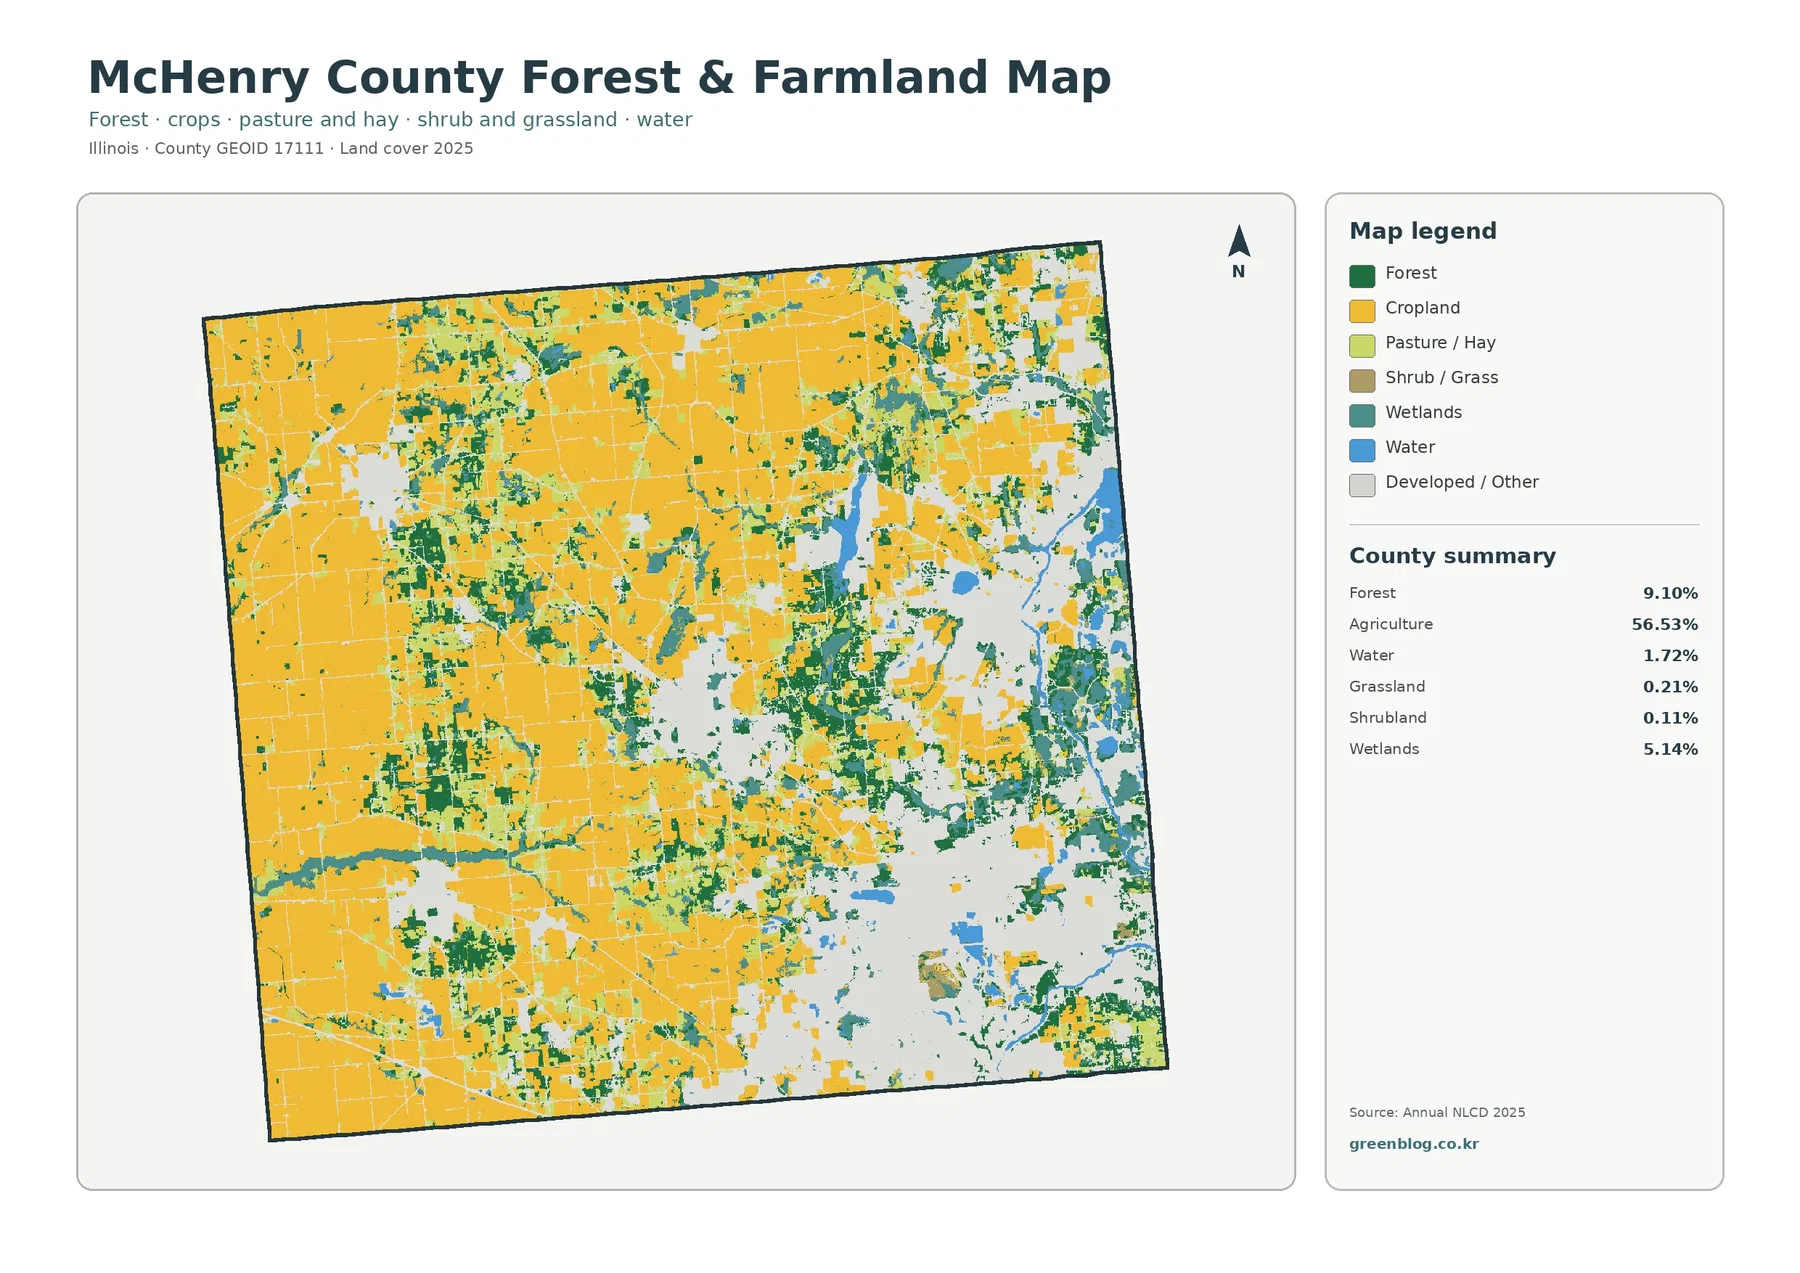
The county summary reports 56.53% agriculture, 26.54% developed land, 9.10% forest, 5.14% wetlands, and 1.72% water. Agricultural yellow dominates the western half and continues through much of the north-central interior. Red developed cover becomes progressively more common toward the east and southeast, where it breaks the agricultural pattern into smaller pieces. Forest and wetland colors also become more frequent around waterways and the more irregular landscape east of the broad farm blocks.
Fox River, lakes, and wetlands give the eastern edge a more complex shape than the farm grid
Water and wetlands account for a smaller share of the county than agriculture or development, yet their geography is highly visible. McHenry County water-resource documents describe the Fox River running north to south near the eastern border and identify the Chain O’Lakes system, including Pistakee Lake partly within the county. On the land-cover map, blue water and teal wetlands form irregular corridors and patches along this side of the county rather than following the straight field and road geometry common in the west.
Removing most urban color reveals how farmland continuity changes from west to east
The forest-and-farmland map is particularly useful in McHenry County because the standard land-cover map contains so much red developed cover in the east. Once that development is muted to light gray, the western agricultural blocks become even more continuous, while the central and eastern portions show a finer mixture of cropland, forest, wetlands, and water. Forest accounts for 9.10% of the county and is scattered in patches and narrow bands rather than forming one large continuous woodland.
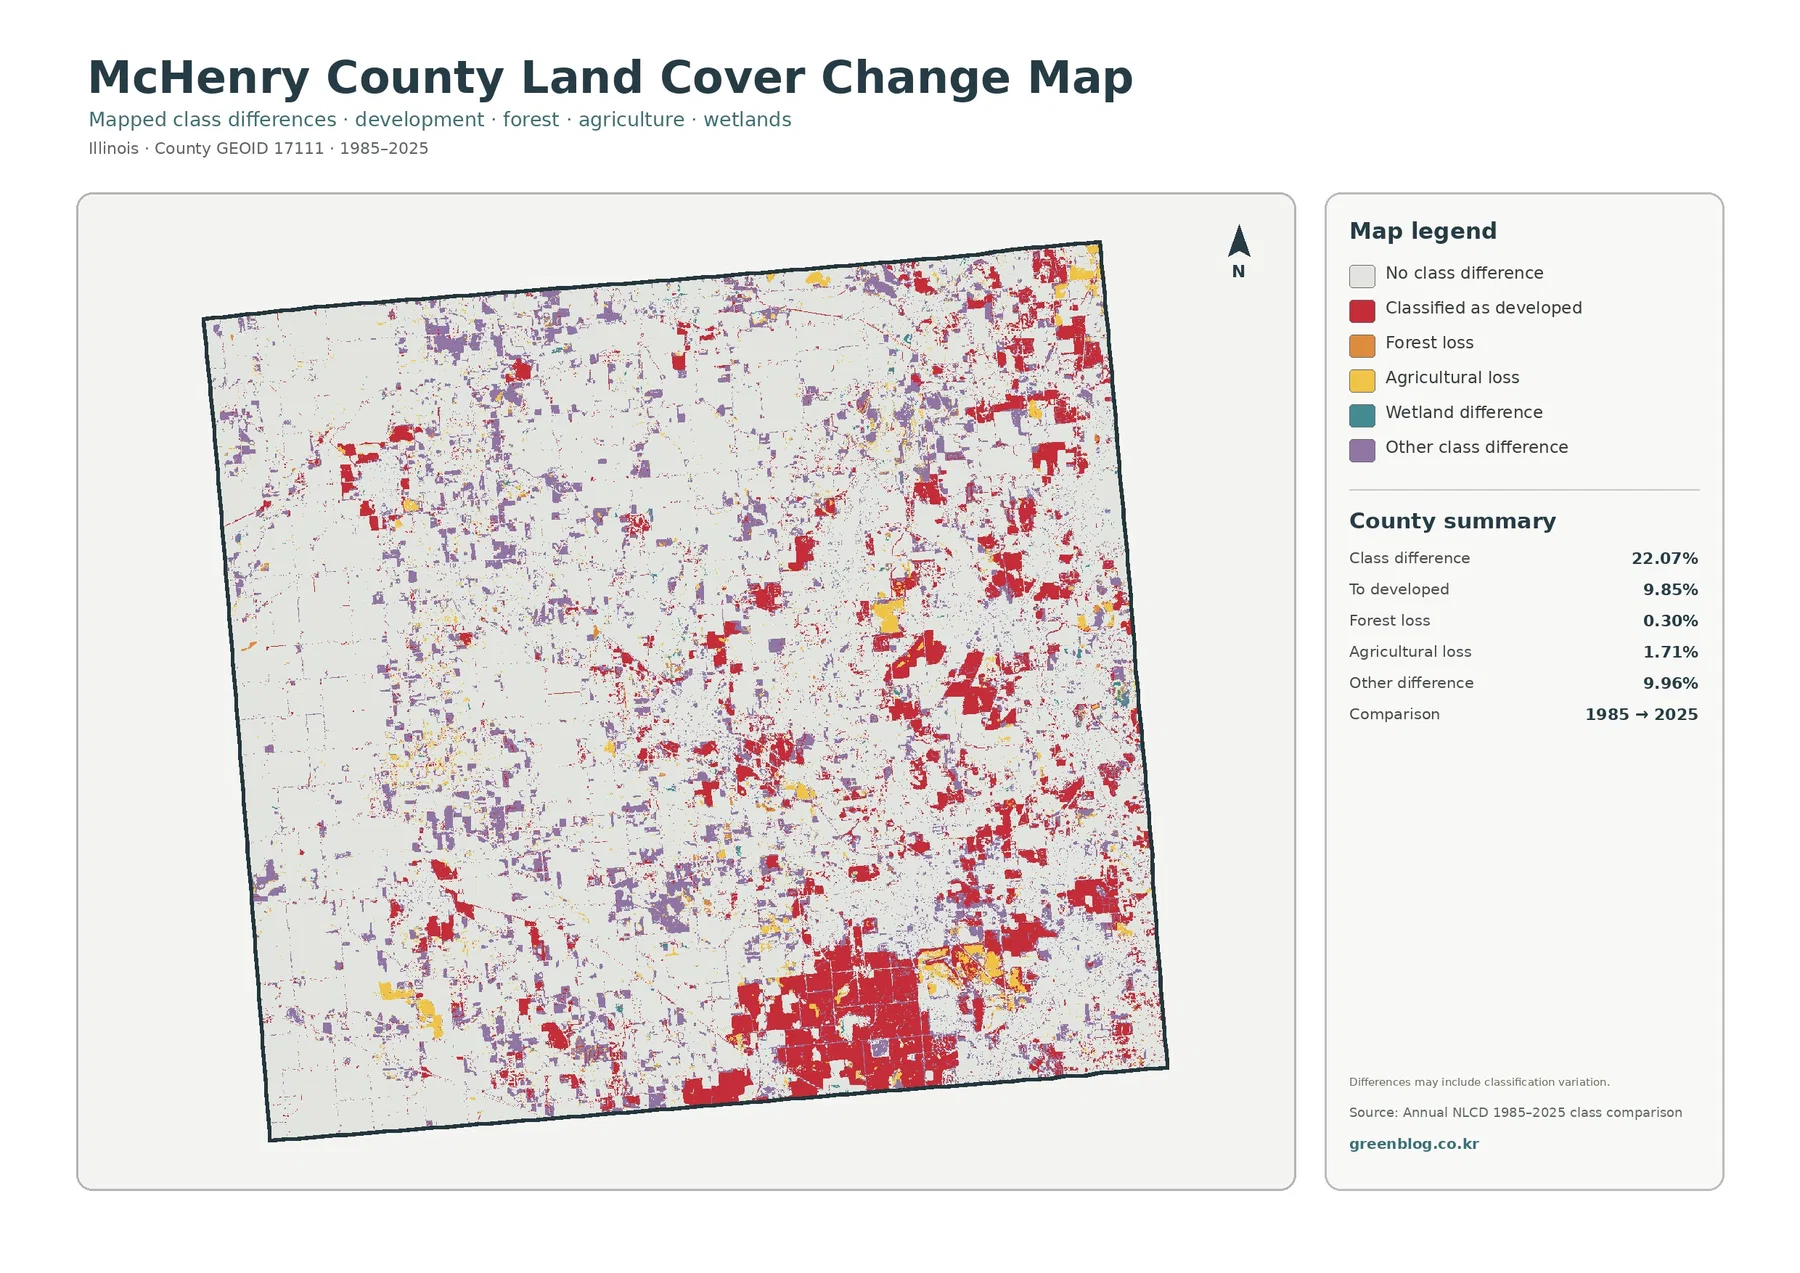
A 22.07% endpoint class difference includes much more than urban growth
The change map compares the representative class assigned to each cell in 1985 with the class assigned in 2025. McHenry County has 22.07% total class difference in the supplied summary. Change to developed is 9.85%, forest loss is 0.30%, agricultural loss is 1.71%, and other class difference is 9.96%. Wetland difference has its own legend color, but the summary does not print a separate exact percentage, so it should not be calculated from the remaining total and presented as a verified value.
Red change-to-developed cells are especially extensive along the southern edge and through the eastern half. Large blocks appear around the present developed areas, while smaller red patches and road-like extensions occur farther north. Purple other-difference cells are more scattered through the west and north, and yellow agricultural-loss cells appear in smaller clusters around several growth areas. The map therefore records a mixture of endpoint differences rather than one uniform conversion spreading across the county.
A city, a farm block, and a wetland corridor each change meaning across the four map views
Consider a developed area near Crystal Lake or the southeastern communities. The general map assigns a broad developed class and places that area beside agriculture, forest, wetlands, and water. The impervious map then separates harder surfaces from the greener portions inside the developed setting. The forest-and-farmland view pushes the built area into the background so the surrounding field and woodland boundary is easier to follow. Finally, the change map retains only cells whose endpoint classifications differ.
Raster cells simplify narrow features, mixed edges, and parcel boundaries
Annual NLCD is raster data, so the county is represented as a grid of cells rather than surveyed property polygons. A single cell can contain part of a field, trees, pavement, a house, and a small drainage feature. The classification assigns a representative cover, which means narrow woodland strips or small wetlands can appear broken, and mixed edges can shift slightly from what is visible in higher-resolution aerial photography. Those limitations matter most when the map is enlarged beyond its intended county-scale use.
Choose the JPG by the question, then keep the complete four-map set for cross-checking
Use the general land-cover JPG when the goal is to describe the county’s overall 2025 surface pattern. Choose the forest-and-farmland file when the broad western cropland and the fragmented eastern natural cover are the main subject. The impervious map is better for comparing hard-surface concentration between Woodstock, eastern communities, and smaller western centers. The 1985–2025 map belongs in a historical class-comparison discussion, not as a substitute for a current development map.
Frequently Asked Questions
Why is developed cover 26.54% when mean impervious surface is only 8.25%?
They measure different things. The developed land-cover class can include buildings, pavement, lawns, trees, and other surfaces within a built setting. Impervious percentage estimates the hard portion that resists water infiltration. A suburban cell can therefore be classified as developed while still containing substantial grass, trees, or exposed soil, so the countywide developed share can be much larger than mean impervious cover.
What makes the eastern side of McHenry County look more complex than the western side?
The east combines larger developed areas with the Fox River, lakes, wetlands, forest patches, and smaller agricultural pieces. The west contains broader continuous farm blocks with smaller town centers and fewer large water features. Because those cover types have irregular boundaries, the eastern map contains more color changes over short distances, while the western farm landscape produces larger, simpler shapes.
Can the 1985–2025 change map tell me when a particular field or neighborhood changed?
No. It compares the representative land-cover class at the two endpoint years. A cell shown as different could have changed at any time between those dates, and it may have passed through more than one condition. The map also does not identify the legal use, owner, development approval, or cause of change. Historical aerial imagery and local records are needed for a dated site history.
Sources and Reference Data
The 2025 land-cover percentages, impervious summary, and 1985–2025 class-difference values in this article come from the supplied McHenry County maps and legends. The official links below provide background on Annual NLCD classification, county planning, and the Fox River and Chain O’Lakes water setting. Their statistics are not merged into the supplied map totals.
- MRLC Annual NLCD Data – official Annual NLCD data access and product information
- USGS Annual NLCD Land Cover Classification – definitions and guidance for land-cover classes
- McHenry County Plans and Planning Documents – county comprehensive plans covering growth, agriculture, natural resources, and land use
- McHenry County Water Resources Division – official county information on watersheds, wetlands, flooding, and water resources
Map File Information
The ZIP contains four original JPG maps for McHenry County, Illinois: general land cover, forest and farmland, impervious surface and developed land, and the 1985–2025 land-cover class comparison.
- Included Versions: Land cover / forest and farmland / impervious and developed land / land-cover change
- File Type: ZIP containing four JPG maps
Related Maps
- Adams County Illinois Land Cover Map
- Alexander County Illinois Land Cover Map
- Bond County Illinois Land Cover Map
Green Map creates custom-edited map images using open geographic data sources such as geoBoundaries, Natural Earth, OpenStreetMap, and government open data. These maps are edited visual materials, not raw data files, and are provided for education, documents, presentations, and graphic reference.