Wapello County in southeastern Iowa is easiest to understand by starting with Ottumwa and then following the major roads and the Des Moines River across the county. This Wapello County Map collection includes a general reference map, a simplified city-distribution map, a terrain-and-water map, and an elevation map. The WebP images in the article are designed for quick viewing, while the download box farther down the page provides the same county geography as high-resolution JPG files for printing, close inspection, or use in a larger report.
Ottumwa sits slightly west of the county’s center and spreads across both sides of the Des Moines River. US 34 and US 63 meet in the city, Iowa 149 approaches from the north, and Iowa 16 provides a useful route reference toward Eldon in the southeast. Agency lies east of Ottumwa, Blakesburg is near the western edge, and Chillicothe and Kirkville mark the northwestern and northern parts of the county. On the physical maps, the broad Des Moines River valley stands out against the surrounding hills, while Cedar Creek and smaller tributaries cut a dense network of narrower valleys across the uplands.
Table of Contents
Using Ottumwa and US 34–63 as the main reference points
The general county map immediately directs attention to Ottumwa. Its built-up area is much larger than the other mapped communities, and landmarks such as the Wapello County Courthouse and Indian Hills Community College help anchor the city visually. US 34 crosses the county from west to east and continues through Ottumwa toward Agency, while US 63 provides a strong north-south reference through the same urban area. Once these two highways are located, the smaller highways, local roads, rail lines, streams, and nearby communities become much easier to place in relation to one another.
Ottumwa is the county seat, and the official Wapello County government site places the courthouse there. The county’s official history notes that Wapello County was created in 1843 and that the site that became Ottumwa was laid out along the Des Moines River as the planned county seat area. That historical role is still visible in the modern map because roads, rail corridors, public facilities, and the river all concentrate around Ottumwa. For a reader who does not know the county, finding this one city first gives a reliable center from which to judge the position of smaller places.
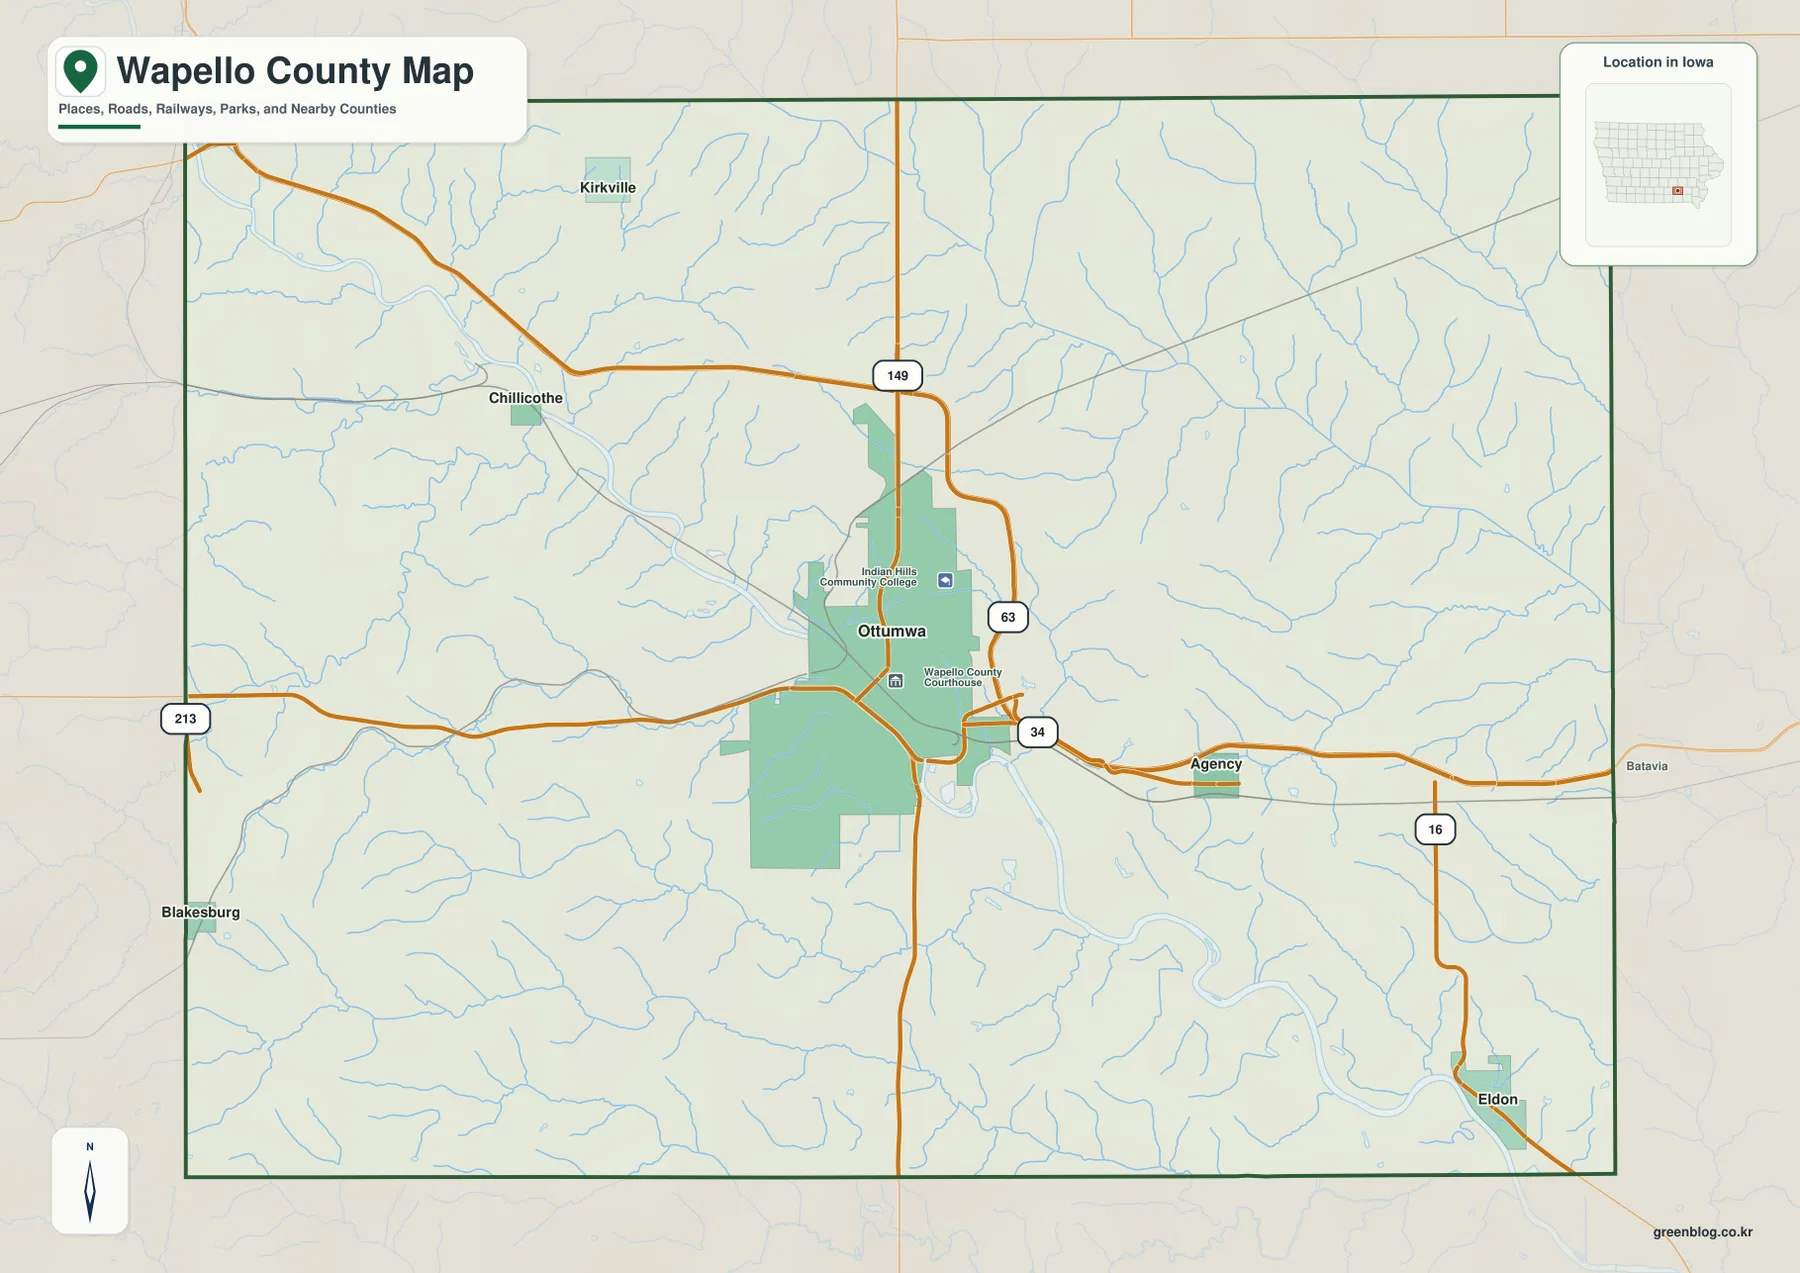
Following US 34 east from Ottumwa leads toward Agency, which is one of the clearest small-city references on the eastern side of the map. Eldon is much farther southeast and is associated with Iowa 16 near the county’s lower-right corner. Blakesburg lies close to the western boundary, while Chillicothe and Kirkville occupy separate positions in the northwest and north. These locations show that settlement is not arranged along a single straight corridor. Instead, Ottumwa is the dominant hub and the smaller communities are dispersed around the county in several directions.
This map is best treated as a county-scale reference rather than a live navigation service. It combines major routes with many smaller roads, railways, streams, park areas, and neighboring-county context so that a reader can explain where a place is without opening several separate maps. To locate Eldon, for example, begin with Ottumwa and the US 34 corridor before shifting toward Iowa 16 and the southeast. Blakesburg is easier to identify by using the western county edge and Iowa 213 as reference points. Current closures, detours, and turn-by-turn directions should still be checked with an up-to-date transportation source.
Ottumwa and the smaller communities across Wapello County
The city-distribution map removes much of the road detail and emphasizes the relative positions of major communities. Its city index highlights Ottumwa, Eddyville, Eldon, Agency, Blakesburg, and Kirkville, with Ottumwa clearly shown as the largest reference point. Eddyville appears near the northwestern edge, Eldon near the southeast, Agency east of Ottumwa, and Blakesburg near the western boundary. Kirkville is positioned north of Ottumwa and helps define the northern part of the county. This simplified view is useful when the goal is to compare places without the visual weight of hundreds of rural roads.
The general map also labels Chillicothe, so the six indexed places should not be interpreted as a complete list of Wapello County communities. The county government’s official communities page lists seven incorporated communities: Agency, Blakesburg, Chillicothe, Eddyville, Eldon, Kirkville, and Ottumwa. The city map is therefore a cartographic selection designed to keep the display readable, not an administrative inventory or a substitute for a current population table. This distinction matters when the map is used in school assignments, local-history work, or reports that need to separate geographic orientation from demographic statistics.
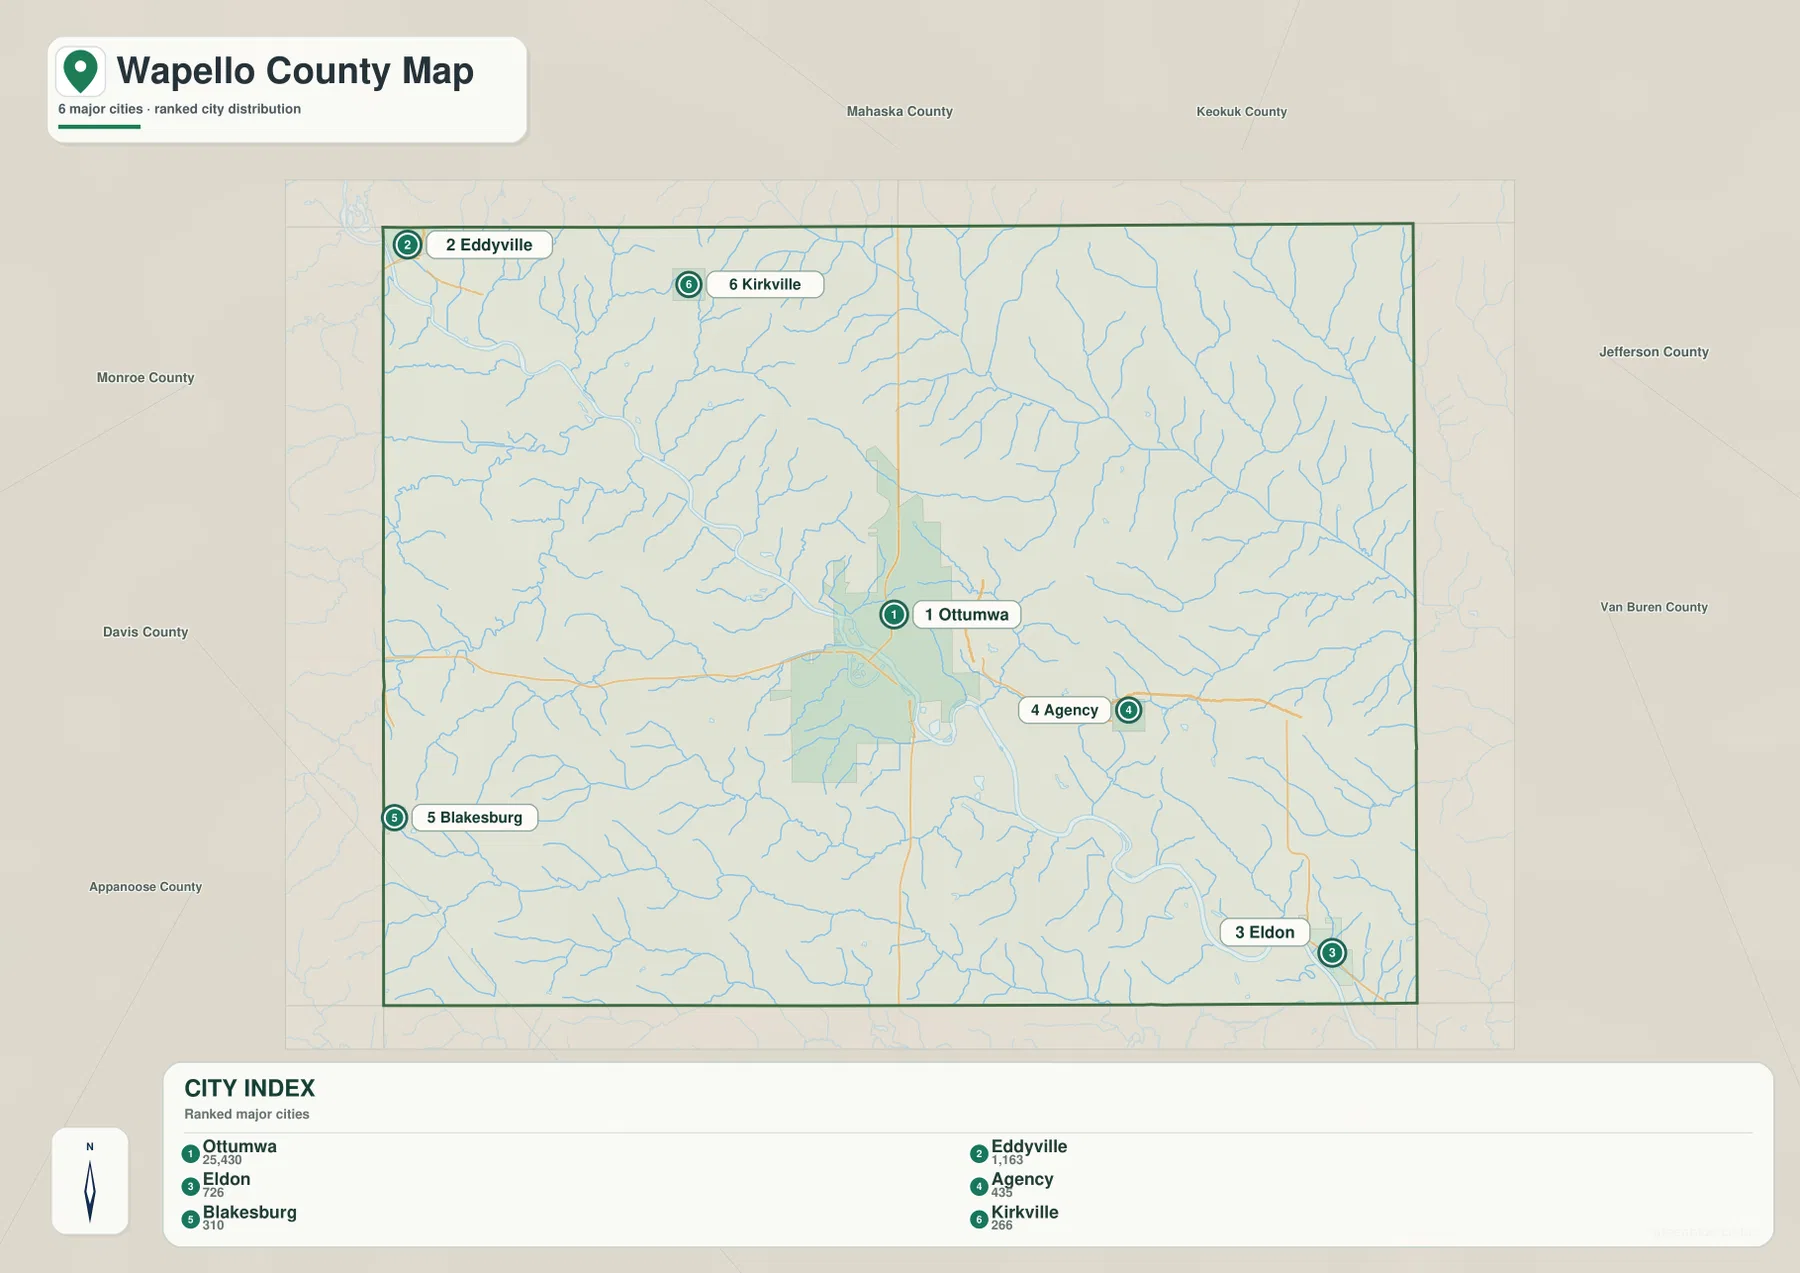
Ottumwa and Agency sit relatively close together along the US 34 corridor, while Eldon is clearly separated to the southeast. Blakesburg provides a useful western reference, and the locations of Eddyville and Kirkville make the northern half easier to understand. When these city positions are transferred to the terrain-and-water map, the county becomes more than a set of points. Each community can be related to the Des Moines River, tributary valleys, and higher uplands, making it easier to explain why roads and settlement patterns differ from one part of the county to another.
The printed values in the city index are best viewed as reference values used in the map set rather than as a replacement for the latest Census estimates. Population totals depend on date and methodology, and a map designed for spatial comparison may use a different source year from a current demographic table. For this page, the most important information is the rank-like visual emphasis and the geographic separation among the communities. Anyone needing current population figures should consult Census data, while the map remains useful for seeing where those places sit within the county.
The Des Moines River as Wapello County’s dominant valley
The terrain-and-water map is dominated by the Des Moines River. It enters the county from the northwest, passes through the Ottumwa area, and continues southeast in a series of broad bends. The river valley is much wider than the surrounding tributary valleys, creating a smooth, low corridor through the middle of a landscape that is otherwise heavily dissected by streams. Comparing this map with the general reference map makes the relationship between Ottumwa and the river especially clear: the city occupies the county’s principal river corridor rather than a broad, uniform plain.
Iowa Department of Natural Resources river information identifies several Des Moines River sections associated with Wapello County, including the Red Rock-to-Ottumwa stretch and the hydropower dam within Ottumwa. The river continues downstream from Ottumwa toward Farmington through Wapello and Van Buren counties. Those official recreation references are more appropriate for access points and fishing information, while the map on this page is designed to show the river’s overall geometry and how tributaries feed into it. The two types of information complement one another without serving the same purpose.
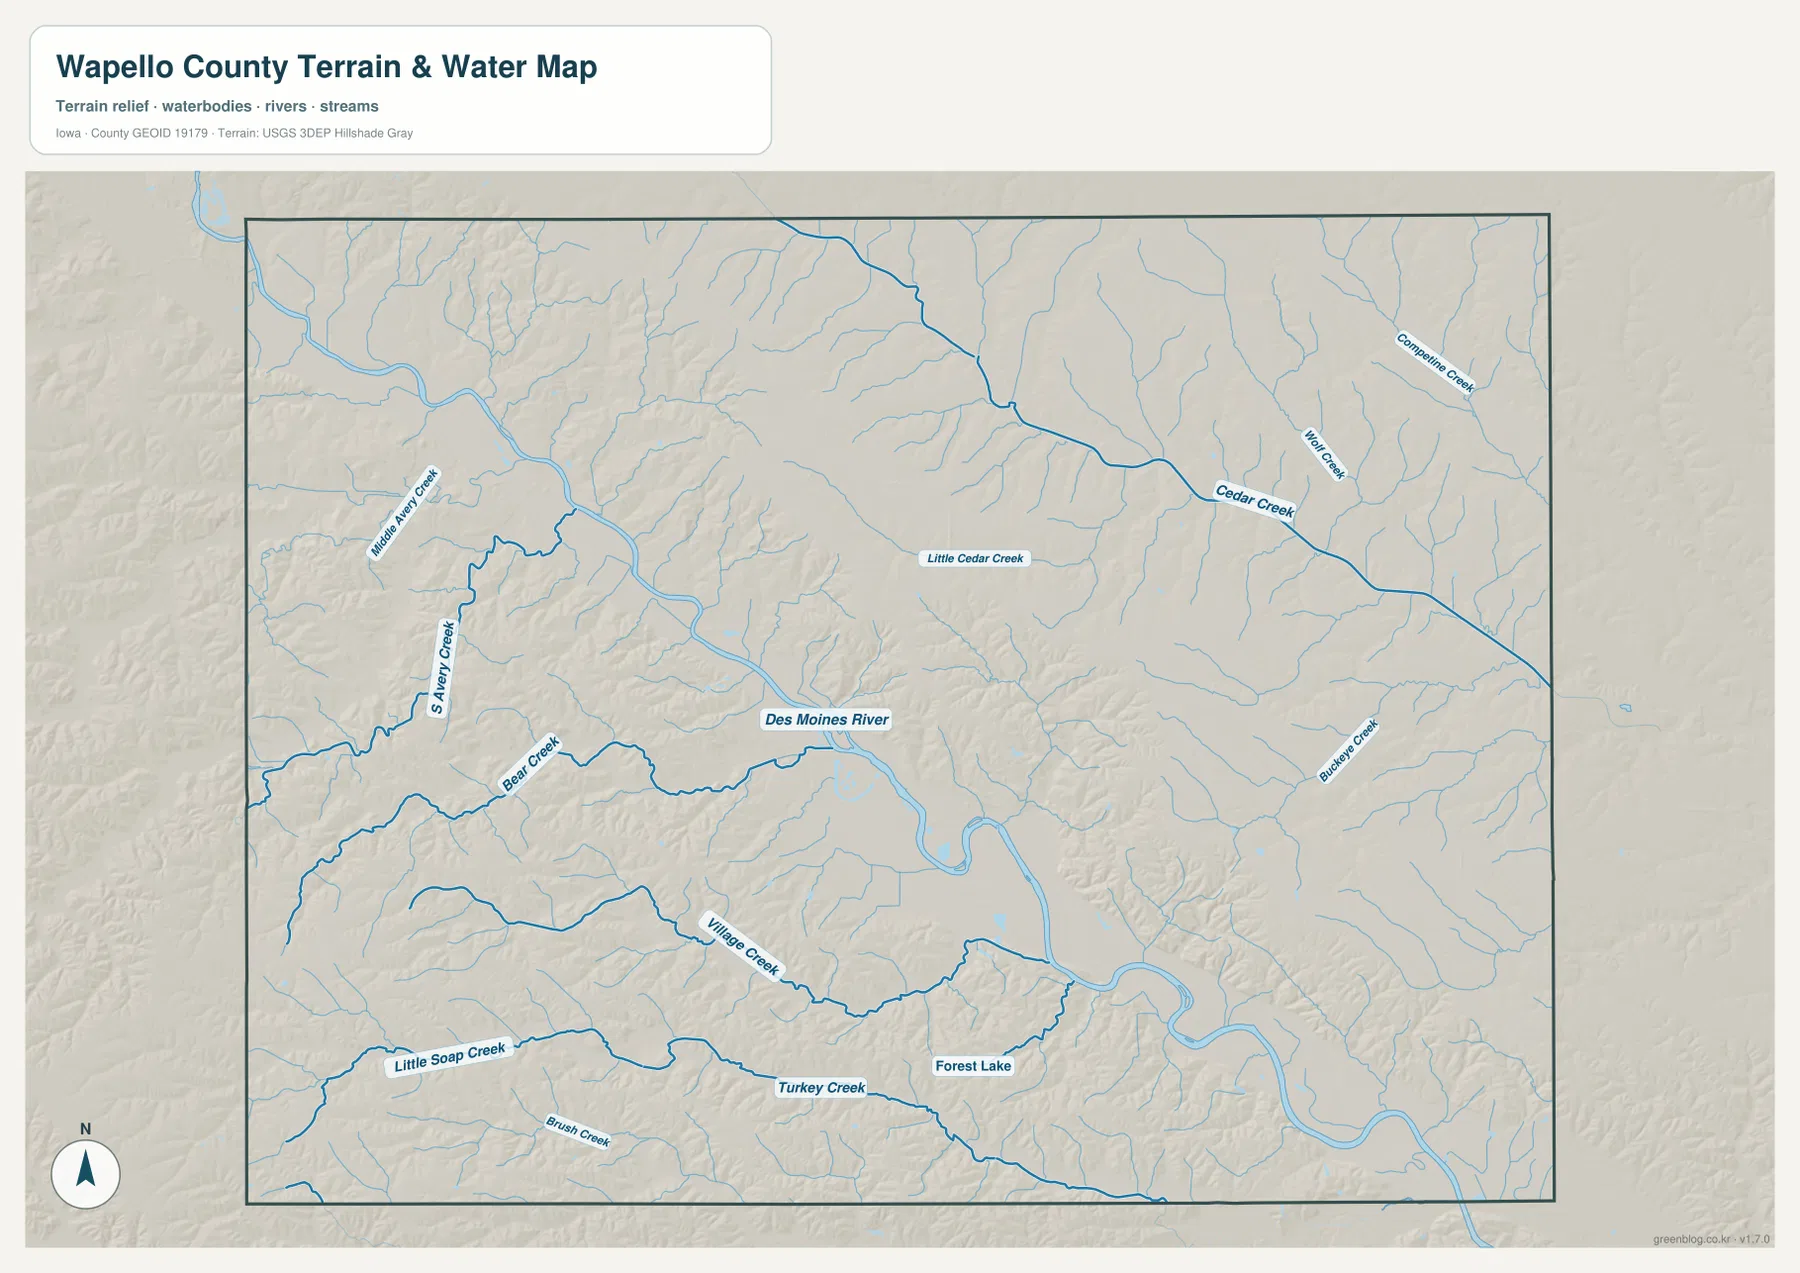
Several named tributaries help organize the western and southern parts of the water map. S Avery Creek and Middle Avery Creek appear west of the main river, while Bear Creek approaches the Des Moines River through the southwestern hills. Village Creek and Turkey Creek extend across the southern half, and Forest Lake provides a small but useful waterbody reference south of the main river. These features become even easier to understand on the elevation map because most of the same channels appear as low green valleys cutting into higher terrain.
The broad floodplain-like form along the Des Moines River differs markedly from the narrow tributary valleys elsewhere in the county. This contrast is especially visible southeast of Ottumwa, where the river makes large bends through a continuous low corridor. The water map is not a flood-hazard map and should not be used to determine inundation zones, levee performance, or parcel-level risk. For those questions, current FEMA and local sources are more appropriate. As a regional geography reference, however, the map is excellent for showing why the main river dominates the county’s physical structure.
Cedar Creek and the smaller drainage network
Cedar Creek is the strongest named stream in the northeastern part of the county. It crosses a landscape of narrow valleys and is joined by smaller channels, including Little Cedar Creek. Instead of creating one broad lowland like the Des Moines River, these streams form a branching network that divides the uplands into many ridges and short slopes. This texture is easy to miss on the road map, where the same area may appear to be mostly open rural land, but the shaded terrain reveals a much more varied surface.
The southern half has its own set of recognizable tributaries. Village Creek, Little Soap Creek, and Turkey Creek stretch through the rolling terrain, while Forest Lake provides another local reference point. Each stream is smaller than the Des Moines River, yet together they explain much of the fine-grained relief visible in the elevation map. Tracing one named creek from its upper branches toward a larger valley is a simple way to read the map without becoming overwhelmed by the many unnamed blue lines.
A county-scale hydrography map does not show every water-management detail. Small channels may be emphasized for readability, and it does not provide current discharge, water quality, flood stage, fishing regulations, or property boundaries. Those uses require the latest information from Iowa DNR, USGS, or local agencies. The strength of this map is broader: it shows how Cedar Creek and numerous smaller tributaries break the uplands into ridges and valleys and how all of those features relate to the large Des Moines River corridor.
Elevation from about 184 to 283 meters
The elevation-map legend gives an actual mapped range of approximately 184–283 meters and a mean elevation of about 234 meters. Green tones represent lower ground, while yellow, tan, and brown indicate progressively higher terrain. The most obvious low feature is the Des Moines River valley, which forms a continuous green band from the northwest through central Wapello County and toward the southeast. Smaller green fingers branch away from it along tributaries, creating a strong visual connection between the water map and the elevation surface.
Higher ground is prominent in the southwestern hills and on uplands bordering the main river. The north-central part of the county also contains substantial higher terrain, but it is repeatedly cut by stream valleys rather than forming one flat plateau. Eastern Wapello County has a similar pattern around Cedar Creek and its branches. For that reason, the county’s relief is better described as a broad central river lowland surrounded by rolling, stream-cut uplands than as a simple west-to-east slope.
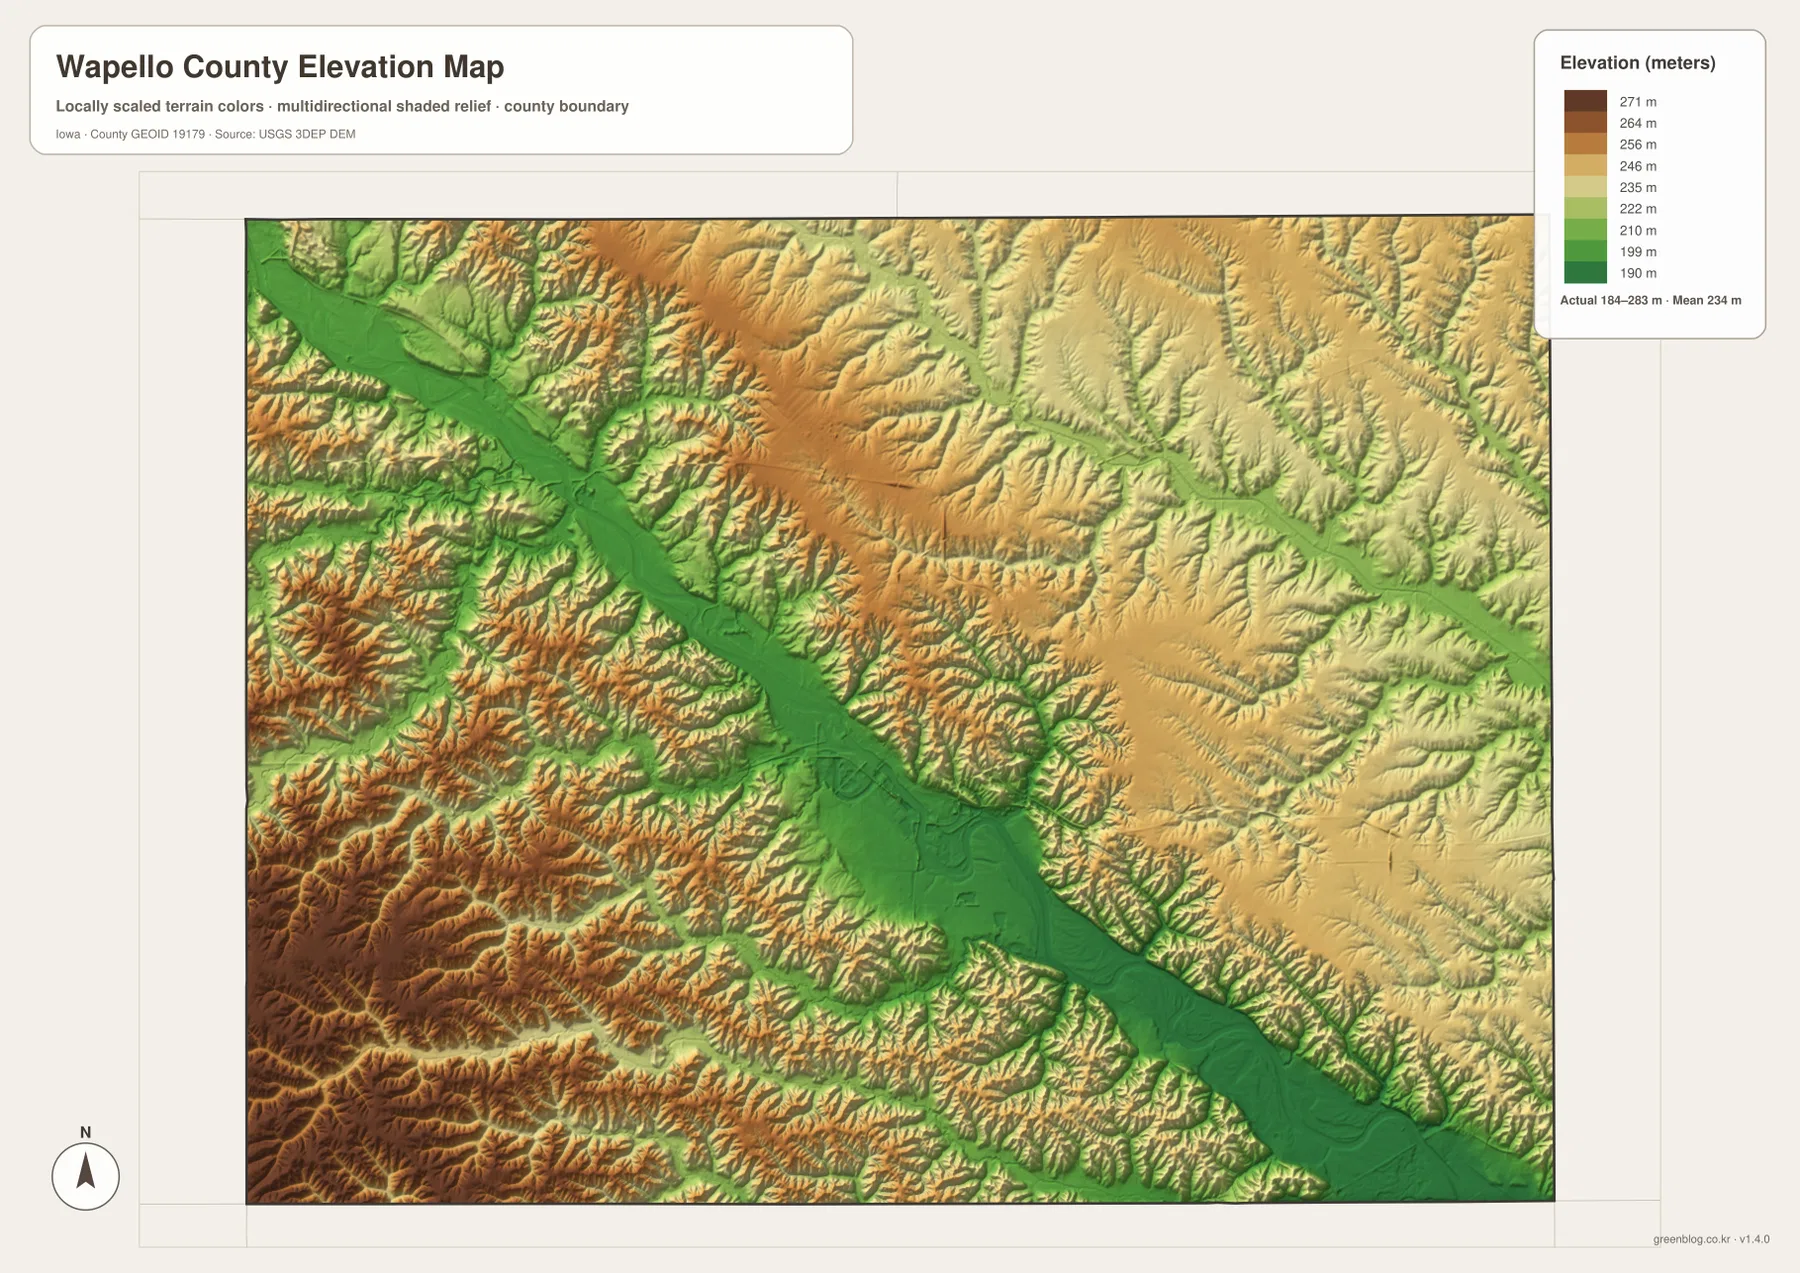
The elevation pattern also changes how places on the reference map should be interpreted. Ottumwa occupies the main river corridor and nearby slopes, while the countryside away from the river is much more dissected by small valleys. The southeast route toward Eldon remains closely associated with the Des Moines River lowland, whereas the southwestern area near Blakesburg includes more extensive higher ground and many small channels. Comparing the location map with the elevation map therefore explains differences that a road-only view cannot show.
This elevation surface is intended for regional comparison, not parcel surveying. The 184–283 meter range summarizes terrain across an entire county and cannot provide a certified elevation for a house, bridge, field corner, or construction site. Engineering, drainage design, legal work, and detailed site planning should use the underlying USGS elevation products or professional survey data. For education, travel orientation, and general county geography, the map is most useful for showing the close relationship between stream valleys and the rolling uplands.
Comparing roads, settlements, rivers, and relief
The four maps become more informative when they are read as a sequence. Start on the reference map by locating Ottumwa, US 34, and US 63, then identify Agency, Eldon, Blakesburg, and the northern communities. Move to the city map to simplify those locations and compare their spacing without the distraction of local-road detail. The terrain-and-water map can then explain which towns are associated with the Des Moines River or smaller tributary systems, and the elevation map shows whether those same areas occupy broad lowlands or rolling uplands.
The Ottumwa-to-Eldon area is a useful example. On the road map, the southeast side can be followed using US 34, Iowa 16, and the position of Eldon. On the water map, the Des Moines River bends through the same general region, and on the elevation map that river is represented by a long, low green corridor. Blakesburg presents a different setting because it lies away from the main river and closer to higher, more dissected uplands. The comparison adds physical context to what would otherwise be only a distance-and-direction relationship.
Agency and the Cedar Creek region provide another useful contrast. Agency appears as a small community along the eastbound US 34 corridor, while farther northeast Cedar Creek and its tributaries create a complex pattern of narrow valleys. The elevation surface repeats those channels as lower bands surrounded by higher ground. Revisiting the same location on each map is therefore more useful than treating the maps as isolated illustrations. The general map answers “where,” the city map simplifies “relative to what,” and the physical maps explain “within what kind of terrain.”
Choosing a map for printing, reports, or study
The general reference map is the most versatile choice for a county overview because it combines cities, roads, railways, streams, and recognizable public landmarks. The city map is more effective in a presentation or classroom setting when only the major communities need to be compared. The terrain-and-water map is better for discussions of the Des Moines River, Cedar Creek, and drainage patterns. The elevation map depends on color gradation and shaded relief, so it is best viewed on a color screen or printed in color when the differences between low valleys and higher uplands matter.
The article uses lightweight WebP images, but each downloadable JPG is 3638 × 2572 pixels. The larger files make small labels easier to inspect and provide more flexibility when the map must be reduced for a report, printed on a large page, or viewed on a high-resolution monitor. The terrain-and-water map benefits from the larger size because it contains many creek labels, while the elevation map preserves more of its hillshade and color steps at full resolution. The simpler city map remains legible at smaller sizes but still looks cleaner when the original is scaled down.
The download archive contains the four JPG maps together, making it convenient to keep the county reference, city distribution, hydrography, and elevation views as one set. They are well suited to educational materials, regional comparisons, presentations, and general research where county-scale geography is the main need. Static maps should not replace live sources for road closures, flood conditions, legal boundaries, or facility status. Used as a geographic foundation, however, the set provides a consistent way to compare Wapello County from several complementary perspectives.
Frequently Asked Questions
What is the easiest starting point on a Wapello County map?
Ottumwa is the easiest starting point because it is the county seat, the largest mapped city, and the place where US 34, US 63, and the Des Moines River come together. From Ottumwa, Agency lies to the east, Eldon to the southeast, Blakesburg to the west, and Kirkville and Chillicothe to the north or northwest. Using both the highways and the river as reference features makes the smaller communities much easier to locate.
Why is the Des Moines River so important on the Wapello County physical maps?
The Des Moines River is the county’s largest water feature and crosses Wapello County from the northwest through Ottumwa toward the southeast. On the water map it forms a broad valley that receives many tributaries, and on the elevation map the same corridor appears as a long low green band. It is therefore useful for understanding both settlement and terrain. Current river levels, flood conditions, and recreation rules should still be checked through the appropriate official sources.
Can the 184–283 meter elevation range be used as an exact property elevation?
No. The range is a county-wide summary that helps compare the low Des Moines River valley with higher surrounding uplands. It is not a parcel survey or a certified point elevation. Construction, engineering, drainage design, or legal work should rely on the underlying USGS elevation data and, when required, professional surveying. The county map is most appropriate for understanding broad relief and the relationship between streams, valleys, and hills.
Map File Information
The download contains the Wapello County reference map, city distribution map, terrain-and-water map, and elevation map as full-resolution JPG files. They are better suited to close inspection and printing than the lightweight WebP previews used in the article.
- Included Files: Wapello County reference map, city map, terrain and water map, and elevation map
- Printable Size: 3638 × 2572 px for each JPG
Related Maps
Sources and References
The county descriptions are based on the supplied map previews together with official Wapello County and Iowa DNR information. Federal mapping references are included for the boundary, hydrography, and elevation datasets commonly used in county-scale mapping.
- Wapello County Government – About Wapello County – official county history and county-seat background
- Wapello County Government – Communities – official list and contact information for the county’s communities
- Iowa DNR – Rivers & Streams – official Des Moines River sections and access information
- U.S. Census Bureau TIGER/Line Shapefiles – county boundary, road, and place-reference data
- USGS National Hydrography – national hydrography and water-feature data
- USGS 3D Elevation Program – national elevation and terrain data
Green Map creates custom-edited map images using open geographic data sources such as geoBoundaries, Natural Earth, OpenStreetMap, and government open data.
These maps are edited visual materials, not raw data files, and are provided for education, documents, presentations, and graphic reference.