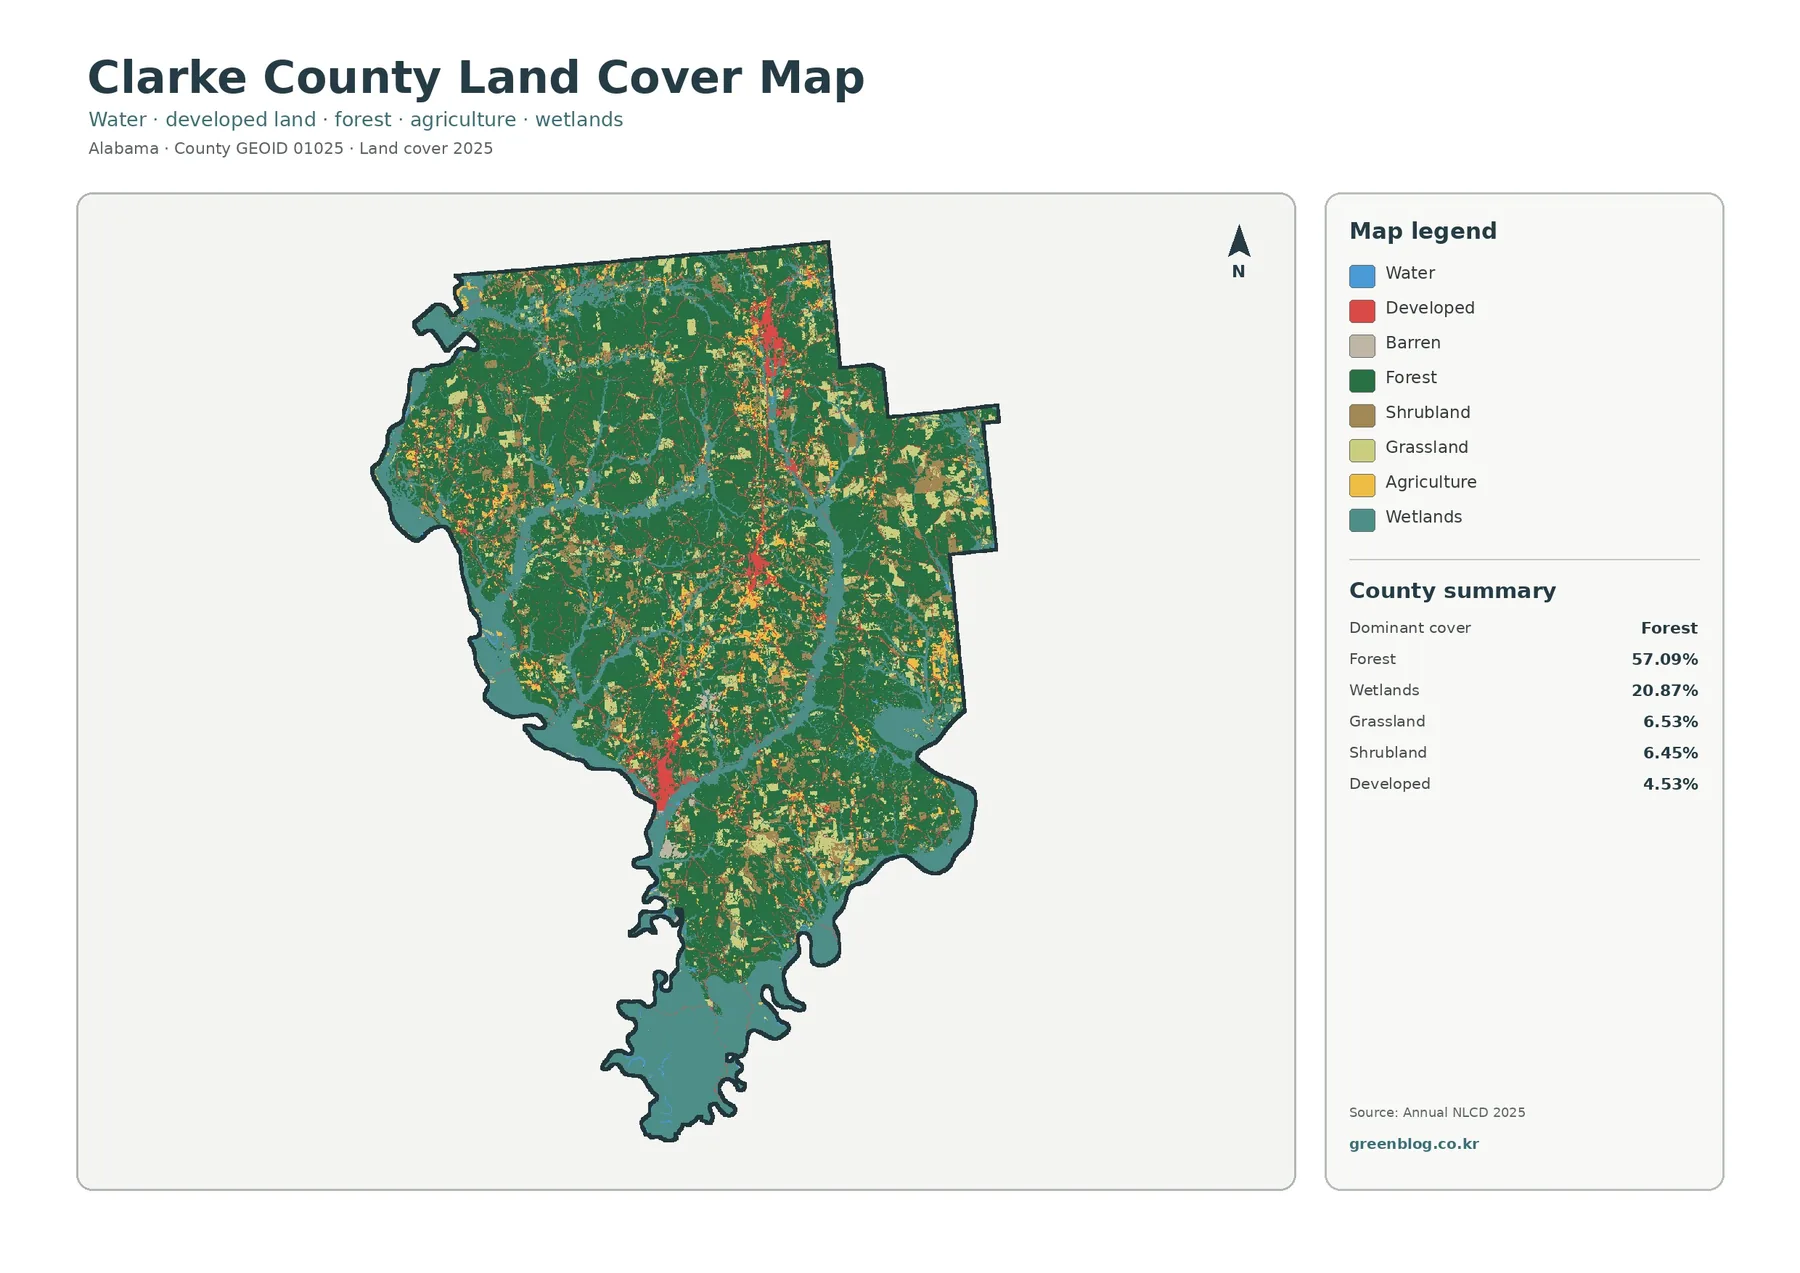
Clarke County is strongly forested in the 2025 land-cover map, but the large wetland share makes the county more varied than a simple woodland description suggests. Forest accounts for 57.09% of the mapped area and wetlands account for 20.87%. Grassland at 6.53%, shrubland at 6.45%, developed cover at 4.53%, and agriculture at 3.11% fill many of the openings between the larger forest and wetland blocks. The southern projection and the irregular western edge are especially useful reference points because broad wetland colors stand out there.
This page compares four views of the same county: general 2025 land cover, forest and farmland, impervious surface and developed land, and the 1985–2025 class-difference map. WebP previews are shown in the article, while the four original JPG maps are available together in one ZIP download. The explanations below focus on what each view adds, how to compare the same location across maps, and where the data should be treated as a county-scale reference rather than a parcel-level answer.
Table of Contents
Start with the wetland share to understand why Clarke County looks different
The 20.87% wetland figure is the most distinctive number after forest. On the map, teal wetland cover is broad around the southern part of the county and along the irregular western edge, while narrower wetland ribbons extend into the interior. These shapes are not the same as open water. The forest-and-farmland summary lists water separately at only 1.03%, so the large teal area represents much more than visible lake or river surface.
Wetland land cover can include ground influenced by water, wet soils, and characteristic vegetation even when a continuous blue water surface is not visible. That distinction is useful in a classroom because the two percentages can be compared directly: 1.03% open water versus 20.87% wetlands. It is also important for practical use. A land-cover wetland class is not a legal wetland delineation, a permit boundary, or a parcel survey. Those questions require the relevant regulatory and site-specific information.
The map also shows that wetland cover is not confined to one large southern block. Smaller teal corridors branch through forested areas farther north. When those corridors are compared with the general land-cover colors, many sit beside extensive forest rather than dense developed land. The visible association helps identify broad areas for further hydrology or habitat review, but it does not by itself explain flooding, soil conditions, or ownership.
A useful reading method is to locate the southern projection first, then trace the wetland color northward and compare its width from place to place. This keeps the discussion tied to a recognizable county shape rather than relying on generic statements about “wet areas.” For a detailed water study, the next step would be to combine this county-scale pattern with hydrography, elevation, flood, or site data rather than treating the NLCD class as the final boundary.
The 2025 general map shows a forest majority with many smaller transitions
Forest covers 57.09% of Clarke County and forms the largest continuous visual background in the general map. Large green blocks extend through the north, center, and south, but they are interrupted by grassland, shrubland, agriculture, wetlands, and small developed areas. The result is a landscape with a clear forest majority without being uniformly green. The edges of major forest blocks are often the places where several colors meet within a short distance.
Grassland and shrubland are close in share, at 6.53% and 6.45% respectively. They appear as scattered lighter patches rather than one dominant belt. Agriculture is smaller at 3.11% and is also dispersed. That pattern matters because a reader looking only at the percentages might expect agriculture to be difficult to see, yet many small agricultural patches remain noticeable when spread across a large county.
Developed cover reaches 4.53%. Red areas are limited compared with forest and wetlands, but a few clusters are distinct: a narrow concentration toward the northeast, a smaller central concentration, and another cluster closer to the southwest. Thin linear traces connect or extend from some of these concentrations. Because the supplied map does not label towns or roads, those lines should be described as developed or hard-surface corridors rather than assigned to a particular road without another verified source.
This general map is the best first image for a report because it preserves the full mix of classes. It answers the broad question of what covers the county now. The specialized maps should then be used to simplify the same pattern: one removes some visual complexity to emphasize forest and open land, another isolates hard surfaces, and the final map asks whether the class recorded in 1985 differs from the class recorded in 2025.
Forest and farmland view makes the open patches easier to compare
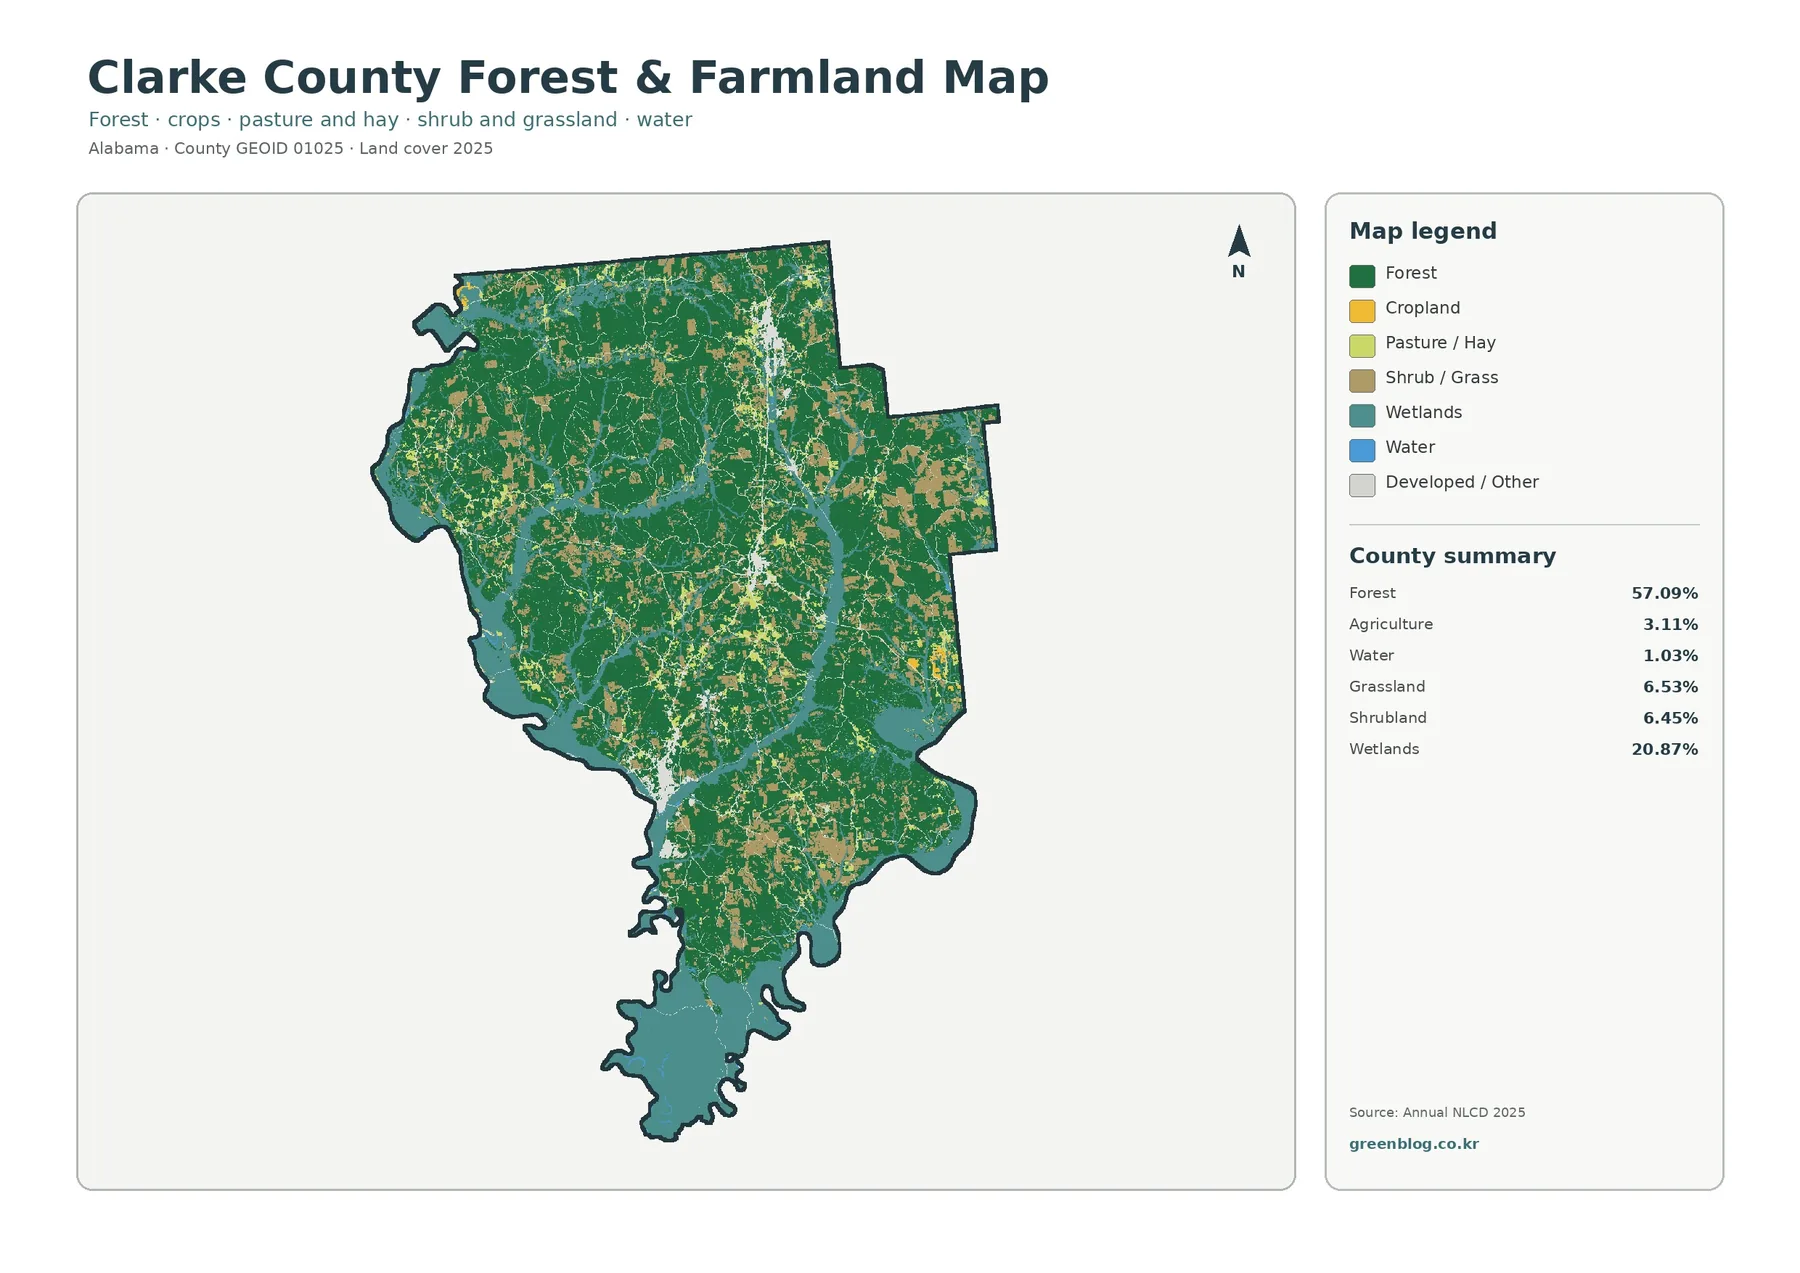
The forest-and-farmland map reduces the visual competition among categories and makes the contrast between wooded land and openings easier to follow. Forest remains 57.09%, while agriculture is 3.11%, grassland 6.53%, shrubland 6.45%, wetlands 20.87%, and water 1.03%. The simplified colors make it clear that agriculture does not form a broad countywide belt. Instead, agricultural cover appears as many smaller patches surrounded by forest, grass, shrub, or wetland classes.
This view is useful when the question is not “what is every class?” but “where are the broad wooded and open areas?” Large forest blocks can be marked first, then the smaller agricultural and grass openings can be compared along their edges. The arrangement is especially visible in the central and southern parts of the county, where multiple open classes break the green forest background into a more detailed mosaic.
Agricultural cover should not be treated as a farm-property layer. The map does not identify crop type, operator, parcel ownership, zoning, or legal land use. The same caution applies to forest. A green cell describes surface cover, not whether land is privately owned, publicly managed, protected, or available for timber harvest. For parcel questions, a county property system or another administrative source is more appropriate.
For educational comparisons, the near-equal grassland and shrubland shares provide another useful point. Both are larger than agriculture in the county summary, yet their locations are not identical. Students can use the legend to distinguish them and then compare how each class touches the forest edge. That exercise demonstrates why a county cannot be summarized accurately by naming only the largest two classes.
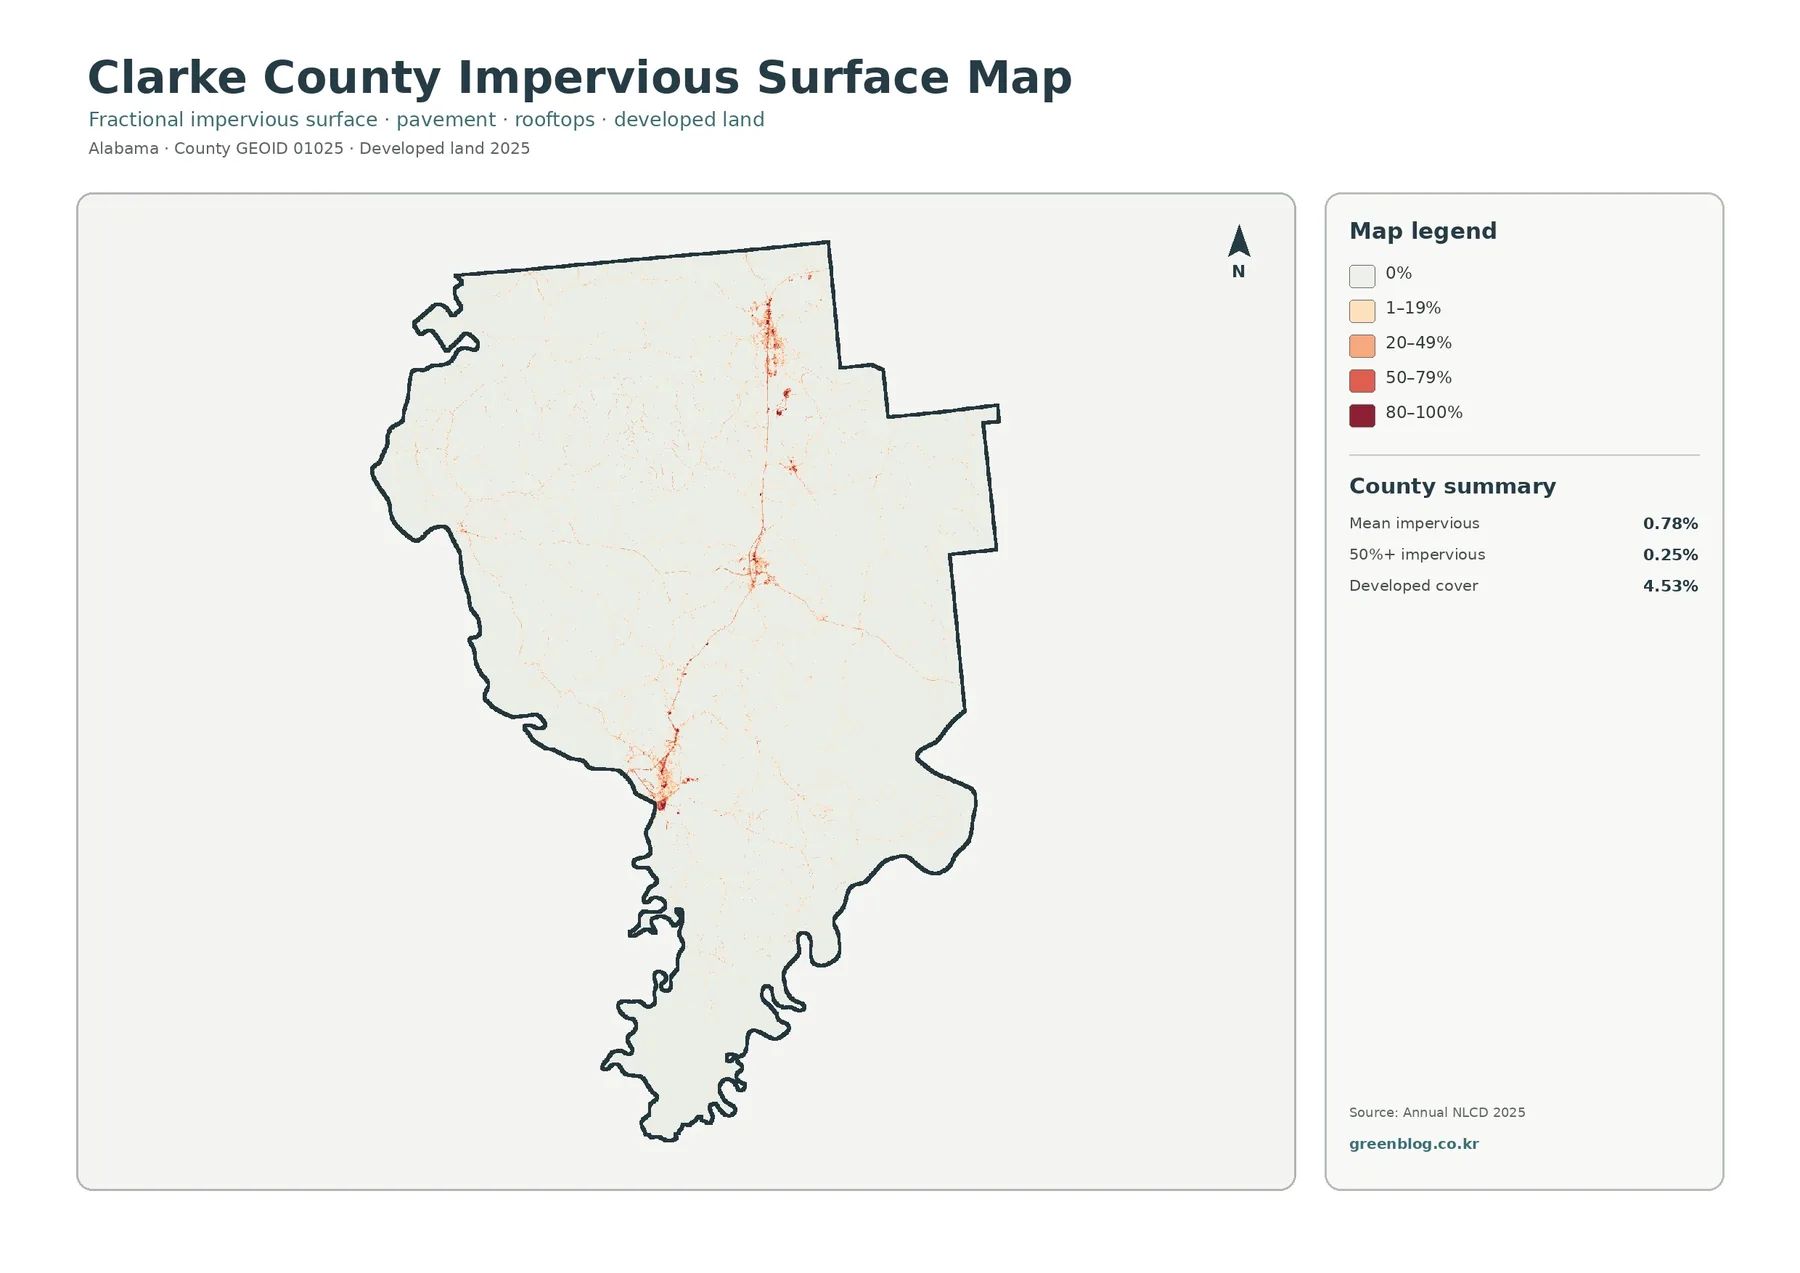
Hard surfaces are concentrated even though the countywide mean is only 0.78%
Impervious surface measures hard cover such as pavement and rooftops that does not readily absorb rainfall. Clarke County has a mean impervious value of 0.78%, and only 0.25% of the county falls in areas that are at least 50% impervious. Those numbers are much smaller than the 4.53% developed-cover share because developed land can also contain lawns, trees, bare soil, and other permeable surfaces.
The impervious map is very pale across most of the county, which is consistent with the large forest and wetland shares. Stronger orange and red values appear in a narrow northeastern concentration, a central cluster, and another small southwestern concentration. Thin lines also stand out between otherwise pale areas. This is a better map for locating hard-surface concentrations than the general land-cover map because the surrounding natural classes have been removed from the color competition.
A low county mean should not be translated into “there are almost no roads or buildings.” A small amount of dense pavement can be diluted by a much larger area of forest, wetland, grass, and other permeable ground. Location therefore matters more than the average alone. In a presentation, pairing the 0.78% mean with the actual impervious map prevents the audience from assuming that every part of the county has the same surface condition.
Impervious cover can help identify places where a more detailed stormwater or development review might begin, but it is not a flood-risk map. Flooding depends on rainfall, terrain, drainage, channel capacity, soils, and other conditions. The safe interpretation is that the map shows where hard surfaces are concentrated. Any claim about runoff impact at a specific site needs additional hydrologic and local evidence.
Use the 1985–2025 map as a class comparison, not a simple development map
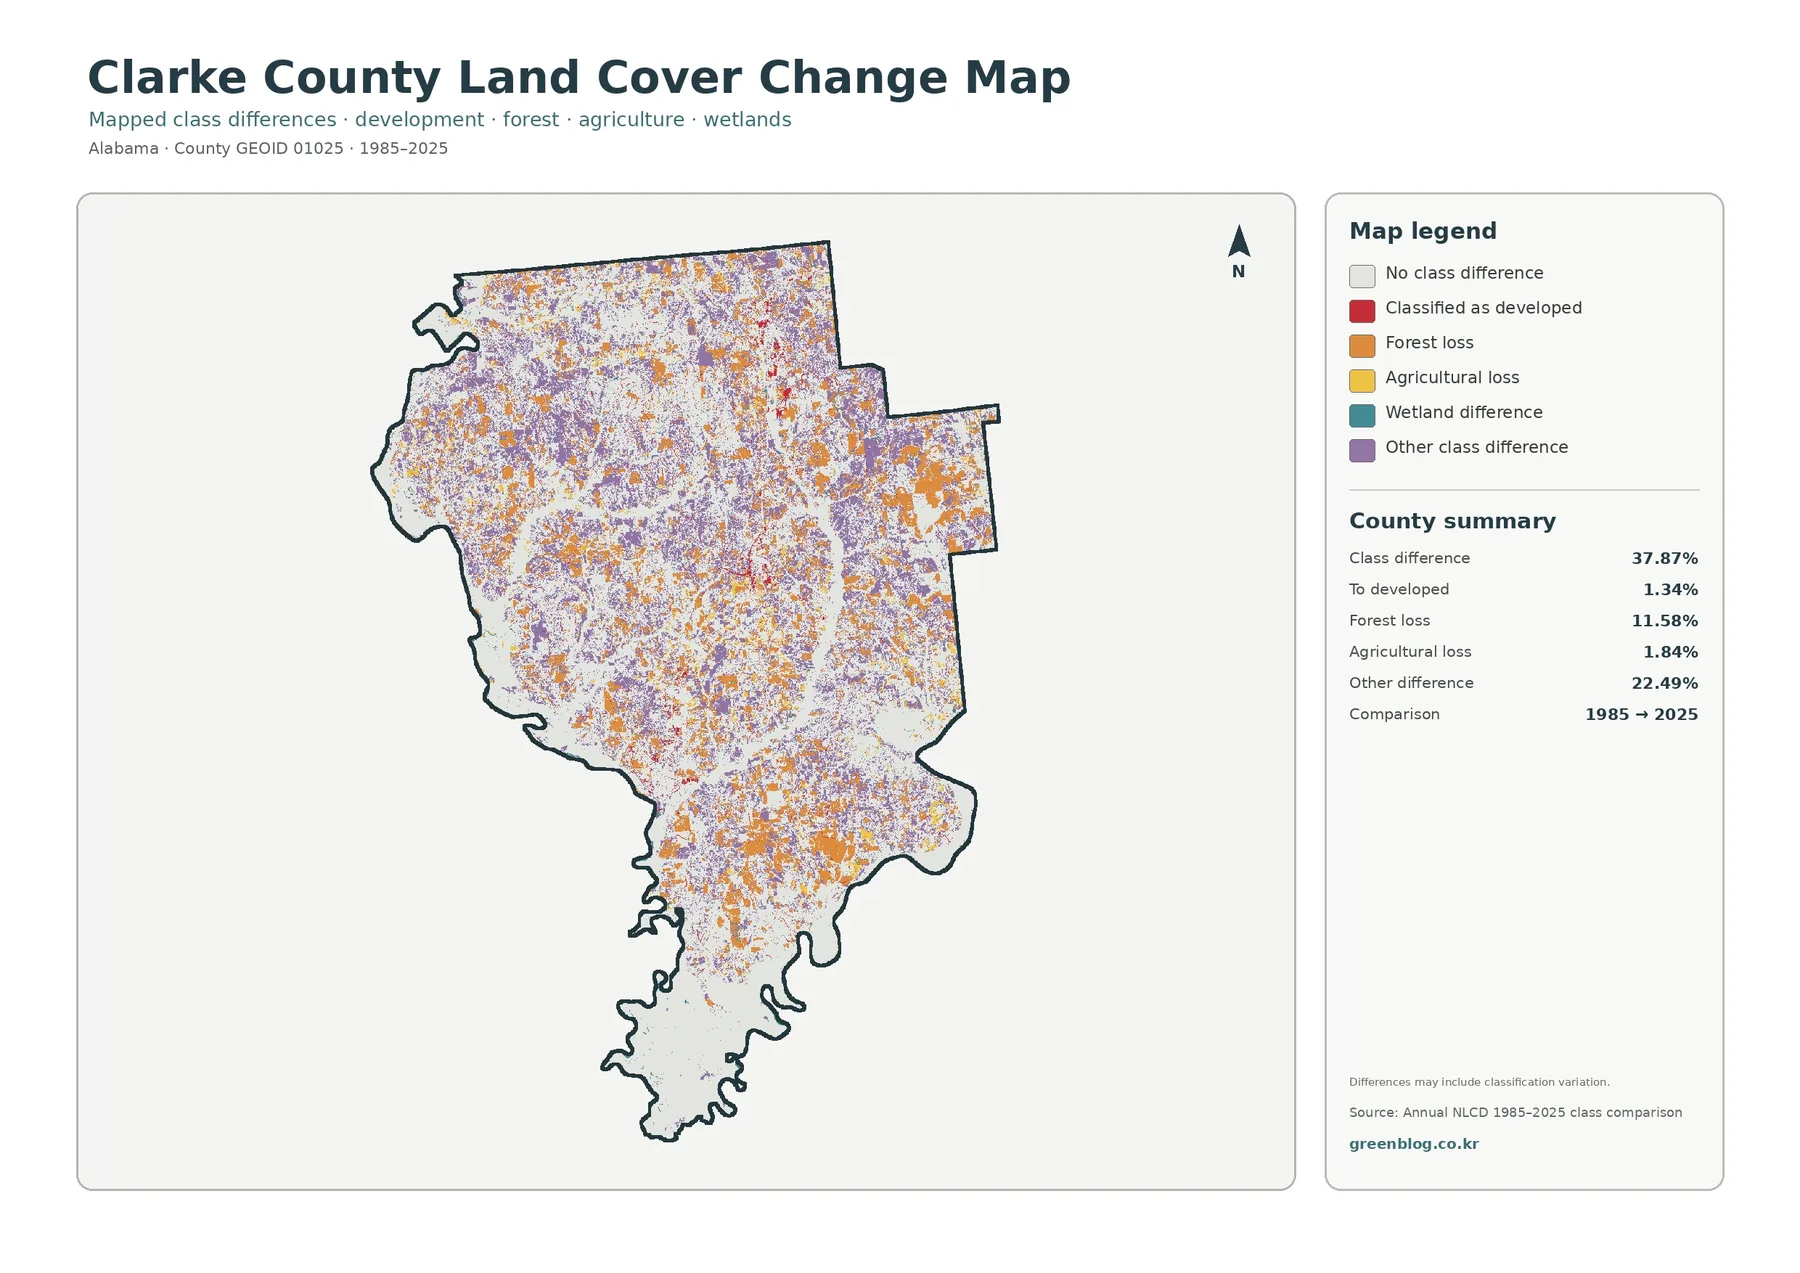
The endpoint comparison reports class differences across 37.87% of the county. The summary breaks that total into 1.34% classified to developed, 11.58% forest loss, 1.84% agricultural loss, and 22.49% other class difference, with wetland difference also represented in the legend. Those categories show immediately why 37.87% cannot be described as the share of Clarke County that became developed.
Orange forest-loss and purple other-difference cells are spread widely from north to south. Some form small isolated patches, while others create larger areas with many adjacent changed cells. Red developed-transition cells are more limited and do not dominate the map. When the change map is compared with the current impervious map, some of the stronger developed locations correspond broadly, but the endpoint comparison contains many changes outside those hard-surface clusters.
“Forest loss” also needs careful wording. It means a cell classified as forest at the earlier endpoint is classified differently at the later endpoint. It does not prove permanent clearing or identify the cause. Harvest and regrowth, shifts among forest, shrub, and grass classes, agricultural change, development, and classification variation are all possible explanations for individual locations. The two endpoint maps alone do not provide the event history needed to choose among them.
The map itself notes that differences may include classification variation. A 30-meter cell can contain mixed surfaces, and the recorded class can be affected by imagery date, vegetation condition, and changes in the classification process. For a location-specific study, the 1985 and 2025 endpoints should be supplemented with intermediate Annual NLCD years and aerial imagery. The change map is most useful for directing attention to areas that deserve that closer review.
A practical four-map workflow for reports, lessons, and county comparisons
For a report or lesson, begin with the general 2025 map because it establishes the full land-cover mix. Ask where forest and wetlands dominate and where smaller developed or open classes interrupt them. Next, switch to the forest-and-farmland view to simplify the landscape. This sequence helps the reader recognize that the same county can look different when a map is designed around a specific question rather than every available class.
The impervious map should come next when the focus turns to settlement or hard surfaces. Instead of treating every red developed cell as equally paved, it shows which areas contain more hard cover. The difference between 4.53% developed land and a 0.78% mean impervious value is a useful example of why related map products are not interchangeable. One classifies a broader type of developed landscape; the other estimates the hard fraction within the surface.
Use the change map last. Its purpose is historical comparison between two classification endpoints, not a description of current cover. A green forest cell in the current map and an orange cell in the change map can refer to the same location while answering different questions. Keeping “current condition” and “endpoint difference” as separate headings in a report prevents percentages such as 57.09% forest and 37.87% class difference from being compared as though they were the same measure.
For county-to-county comparisons, match both year and product. Compare Clarke County’s 2025 forest share with another county’s 2025 forest share from the same classification, and compare the 1985–2025 class-difference total only with another map using the same endpoints and method. Mixing products or years can make data-processing differences look like geographic differences. Keeping the original legend and year in every figure caption is a simple way to avoid that problem.
What comes in the JPG download and how to use it without overstating detail
The ZIP contains four original JPG images: the 2025 general land-cover map, forest-and-farmland map, impervious-surface/developed-land map, and the 1985–2025 land-cover class-comparison map. Each file is 2480×1754 pixels, while the WebP previews in the article are smaller. Because all four images use the same Clarke County outline, they can be placed side by side or in sequence without the reader having to relearn the map extent.
The asset manifest does not mark the JPGs as meeting an A3 high-resolution reference. They remain practical for screen viewing, ordinary documents, many classroom prints, and slide decks, but large-format printing should be tested before final use. Increasing the printed or digital size of the JPG also does not create finer land-cover information than the underlying source. Image dimensions and spatial resolution are separate concepts.
Keep the map type and year visible when exporting or renaming files. A generic file name such as “Clarke map” can easily cause the current-cover and change graphics to be confused later. Labels such as “2025 land cover,” “impervious 2025,” and “1985–2025 change” preserve the meaning of the figures when they are moved into presentations or shared with someone who did not read the original article.
If only one image is needed, choose it based on the question. Use general land cover for the overall county pattern, forest and farmland for wooded-versus-open comparisons, impervious surface for concentrated hard cover, and class change for a two-endpoint historical comparison. Downloading the full set first is still useful because it gives the same geographic reference in all four views and makes later cross-checking much easier.
What a 30-meter raster can show—and what it cannot
Annual NLCD is a raster dataset, meaning the landscape is divided into regular cells and a representative cover class or impervious value is assigned to each cell. The land-cover classification documentation uses a 30-meter spatial resolution. A single cell can contain trees, lawn, a narrow road, a building, bare soil, and a wet edge at the same time. The final mapped class is therefore a generalized description of the cell rather than a survey of every object inside it.
That generalization matters around narrow roads, small buildings, wetland edges, and broken forest boundaries. Zooming in on the image makes the colored cells larger on the screen but does not make the source data more precise. Parcel decisions require parcel records, higher-resolution imagery, field information, and the appropriate legal or regulatory sources. The county land-cover maps are best used to understand broad distribution and to decide where a closer investigation should begin.
Land cover is also different from land use, zoning, ownership, and development permission. A forest cell does not identify the owner or say whether timber can be harvested. An agricultural cell does not identify a crop or farm boundary. A developed cell does not define a municipal limit or permit status. Those questions belong to administrative or property datasets, not a satellite-derived cover classification.
Finally, 2025 is a mapping-year snapshot, not a live view. Construction, harvest, regrowth, or agricultural activity after the observation period may not appear. The 1985–2025 map also compares endpoints and does not show the sequence of events between them. Used with these limits in mind, the four maps provide a clear county-scale picture of forest, wetlands, open land, hard surfaces, and long-term classification differences.
Frequently Asked Questions
What is the largest 2025 land-cover class in Clarke County?
Forest is the largest class at 57.09%. Wetlands are second at 20.87%, followed by grassland at 6.53%, shrubland at 6.45%, and developed cover at 4.53%. Agriculture is listed at 3.11% and open water at 1.03% in the forest-and-farmland summary. The map distribution is important too, because wetlands are especially broad around the southern and western parts of the county.
Does 20.87% wetlands mean one-fifth of the county is open water?
No. Open water is listed separately at 1.03%. Wetland cover can include water-influenced land and vegetation without a continuously visible water surface. The supplied map therefore shows teal wetland areas that are much broader than the blue open-water class. Legal wetland boundaries require separate regulatory and site-specific information.
Why is developed cover 4.53% while mean impervious cover is only 0.78%?
Developed land can include buildings and pavement together with trees, lawns, soil, and other permeable surfaces. Impervious cover measures the hard portion such as rooftops and paved surfaces. A low-density developed area can therefore be classified as developed while most of the cell still remains permeable, producing a lower countywide impervious mean.
Does 37.87% class difference mean 37.87% of Clarke County was developed after 1985?
No. Only 1.34% is summarized as classified to developed. The total also includes 11.58% forest loss, 1.84% agricultural loss, 22.49% other class difference, and wetland differences. The map compares two classification endpoints and may include classification variation, so it should not be reported as a simple development rate.
Which files are included in the download?
The ZIP includes four 2480×1754 JPG maps: general 2025 land cover, forest and farmland, impervious surface and developed land, and the 1985–2025 class comparison. They are larger than the WebP previews used on the page. The manifest does not label them as meeting an A3 high-resolution reference, so test large-format printing before depending on fine text.
Map File Information
Clarke County Land Cover Maps 2025 land cover, forest & farmland, impervious/developed land, and 1985–2025 class-difference maps in four original JPG files
- Included Files: Use only the versions confirmed in the article and supplied images
- File Type: Use the confirmed download contents
- Intended Use: Printing, education, presentations, and map-based projects
Related Maps
- Autauga County Alabama Land Cover Map
- Baldwin County Alabama Land Cover Map
- Barbour County Alabama Land Cover Map
Sources and reference links
- MRLC Annual NLCD Data – official access to Annual NLCD land-cover and impervious-surface products used for this map set.
- USGS Annual NLCD Land Cover Classification – official descriptions of the land-cover classes and how the classification should be interpreted.
- U.S. Census Bureau TIGER/Line Shapefiles – federal geographic reference data for county boundaries and related layers.
Green Map creates custom-edited map images using open geographic data sources such as geoBoundaries, Natural Earth, OpenStreetMap, and government open data.
These maps are edited visual materials, not raw data files, and are provided for education, documents, presentations, and graphic reference.