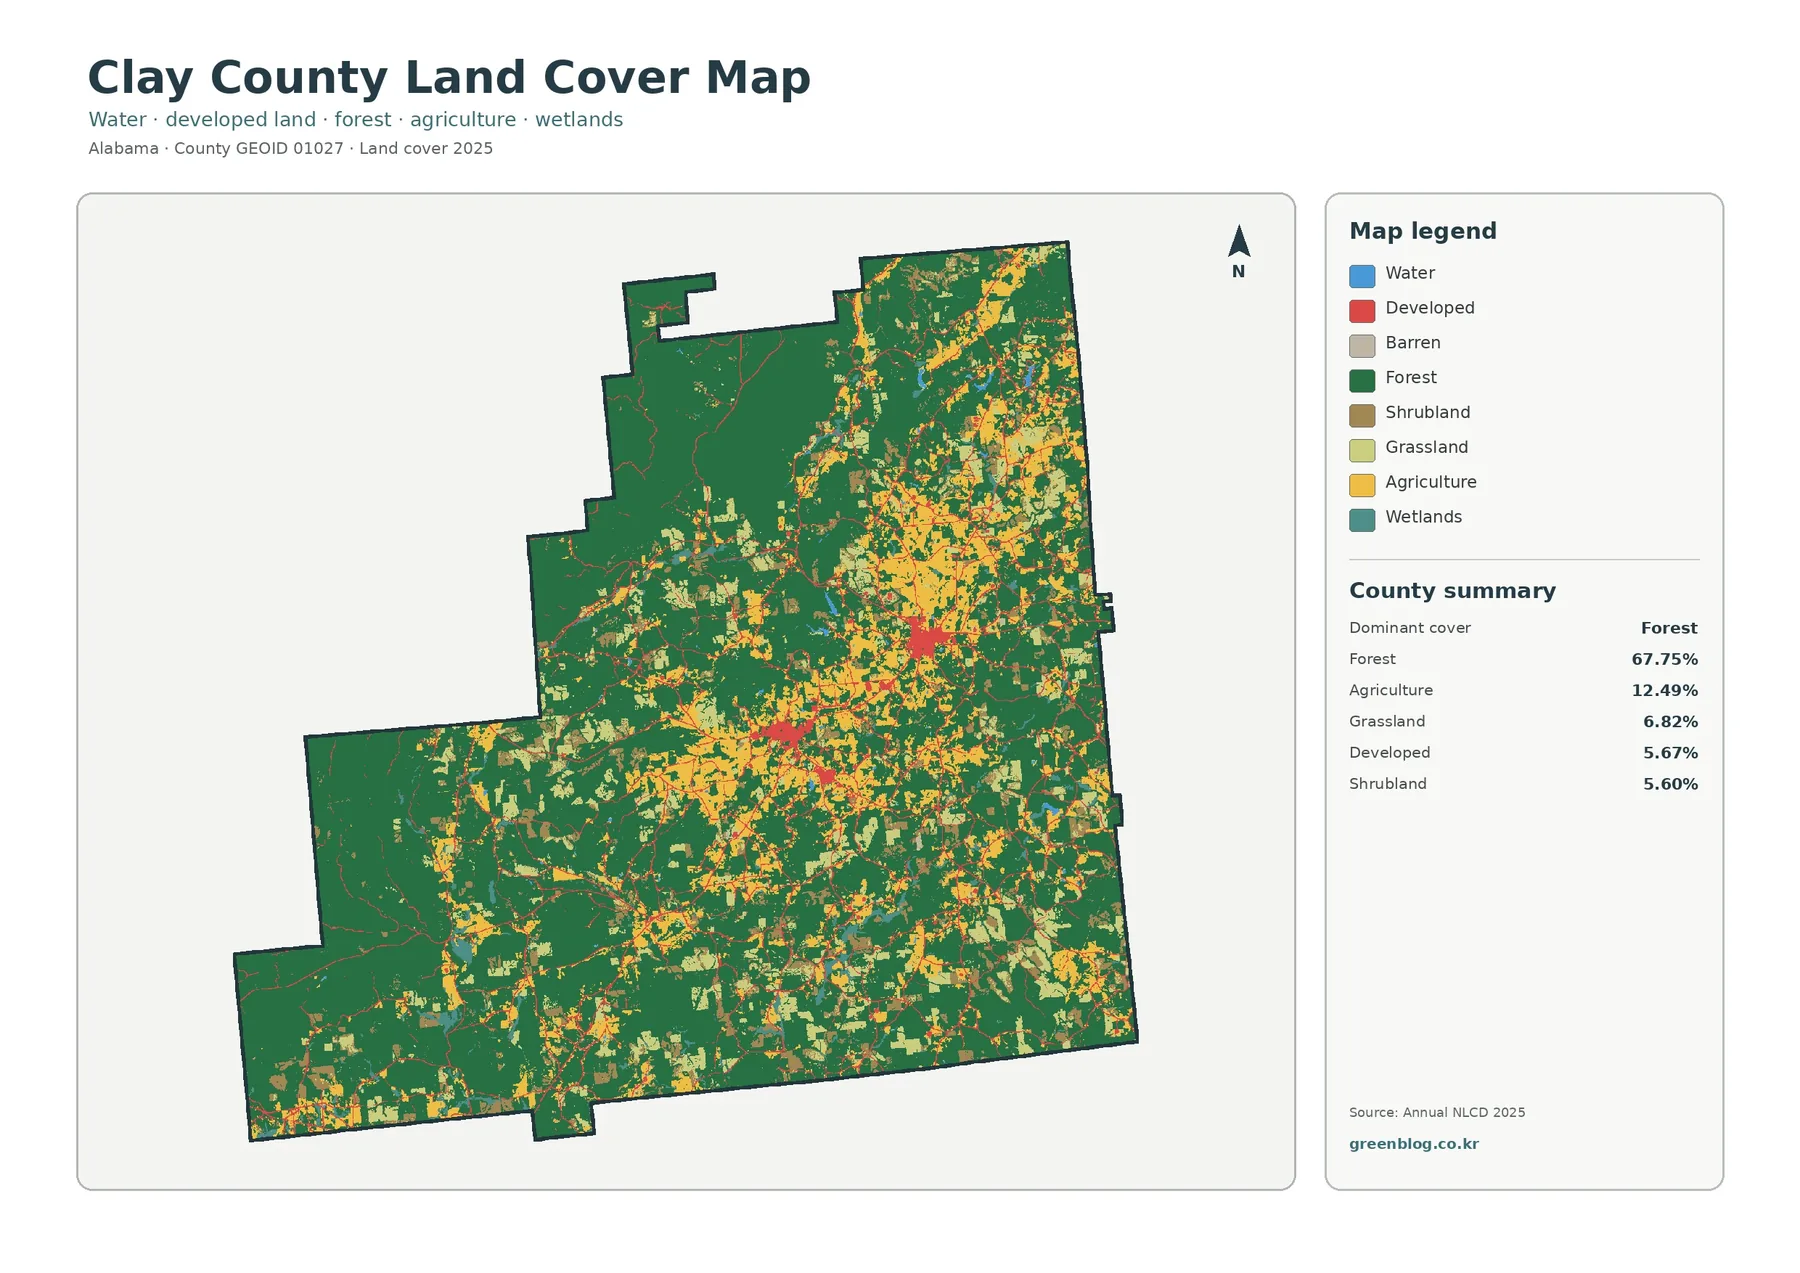
Clay County, Alabama is overwhelmingly wooded in the 2025 land-cover summary. Forest accounts for 67.75% of the county, while agriculture covers 12.49%. Grassland makes up 6.82%, developed land 5.67%, shrubland 5.60%, wetlands 1.34%, and open water only 0.28%. Those numbers are useful, but the map adds an important second layer of information: the forest is not distributed as a single uniform block. Large wooded areas dominate the northwest and west, while a finer mix of fields, grass, shrub cover, and developed patches becomes more visible through the center and east.
This page provides four ways to examine that pattern. The general land-cover map shows the complete 2025 classification; the forest-and-farmland view simplifies the landscape into easier-to-compare groups; the impervious-surface map isolates pavement, rooftops, and other hard surfaces; and the 1985–2025 comparison identifies cells whose mapped class differs between the two endpoints. WebP previews are included in the article, while the download box contains four original JPG maps in one ZIP file.
Table of Contents
A forest-dominated county with a finer land-cover mix through the center
The strongest feature on the 2025 map is the broad forest cover. Dark green fills much of the county, especially across the large western and northwestern sections. Toward the middle and eastern side, the same green background is broken more often by agriculture, grassland, shrubland, and small developed areas. The southern portion also remains heavily wooded even though it contains many open patches. This makes Clay County a useful example of why a countywide percentage should be read together with spatial distribution: 67.75% forest describes the dominant class, but not the internal texture of the landscape.
Agriculture is the second-largest mapped category at 12.49%. Rather than forming one continuous farm belt, it appears in numerous patches, with many of the larger concentrations in the central and eastern portions of the county. Some agricultural cells sit beside grassland, while others meet forest edges directly. The map does not identify crops, ownership, farm boundaries, or management practices, so these yellow areas should be described simply as land classified within the agriculture group for 2025.
Grassland at 6.82% and shrubland at 5.60% add another layer to the pattern. They are scattered through the forest-farm mosaic and are especially noticeable where large wooded blocks give way to more open cover. Their presence does not by itself prove clearing, abandonment, timber harvest, or preparation for development. A land-cover class describes what the surface was classified as at the observation date; explaining why that class occurs requires additional evidence.
Developed land represents 5.67% of Clay County. It is modest as a countywide share, yet the red areas are easier to locate than the percentage might suggest. Compact clusters appear in the central part of the county and farther northeast, with thin linear traces extending away from them. Because this land-cover map does not label roads or municipalities, those lines should not be assigned specific names from the image alone. What the map does support is a simpler conclusion: developed cover is concentrated in relatively small settlement and transportation patterns within a much larger wooded setting.
Forest and farmland become easier to compare in the simplified view
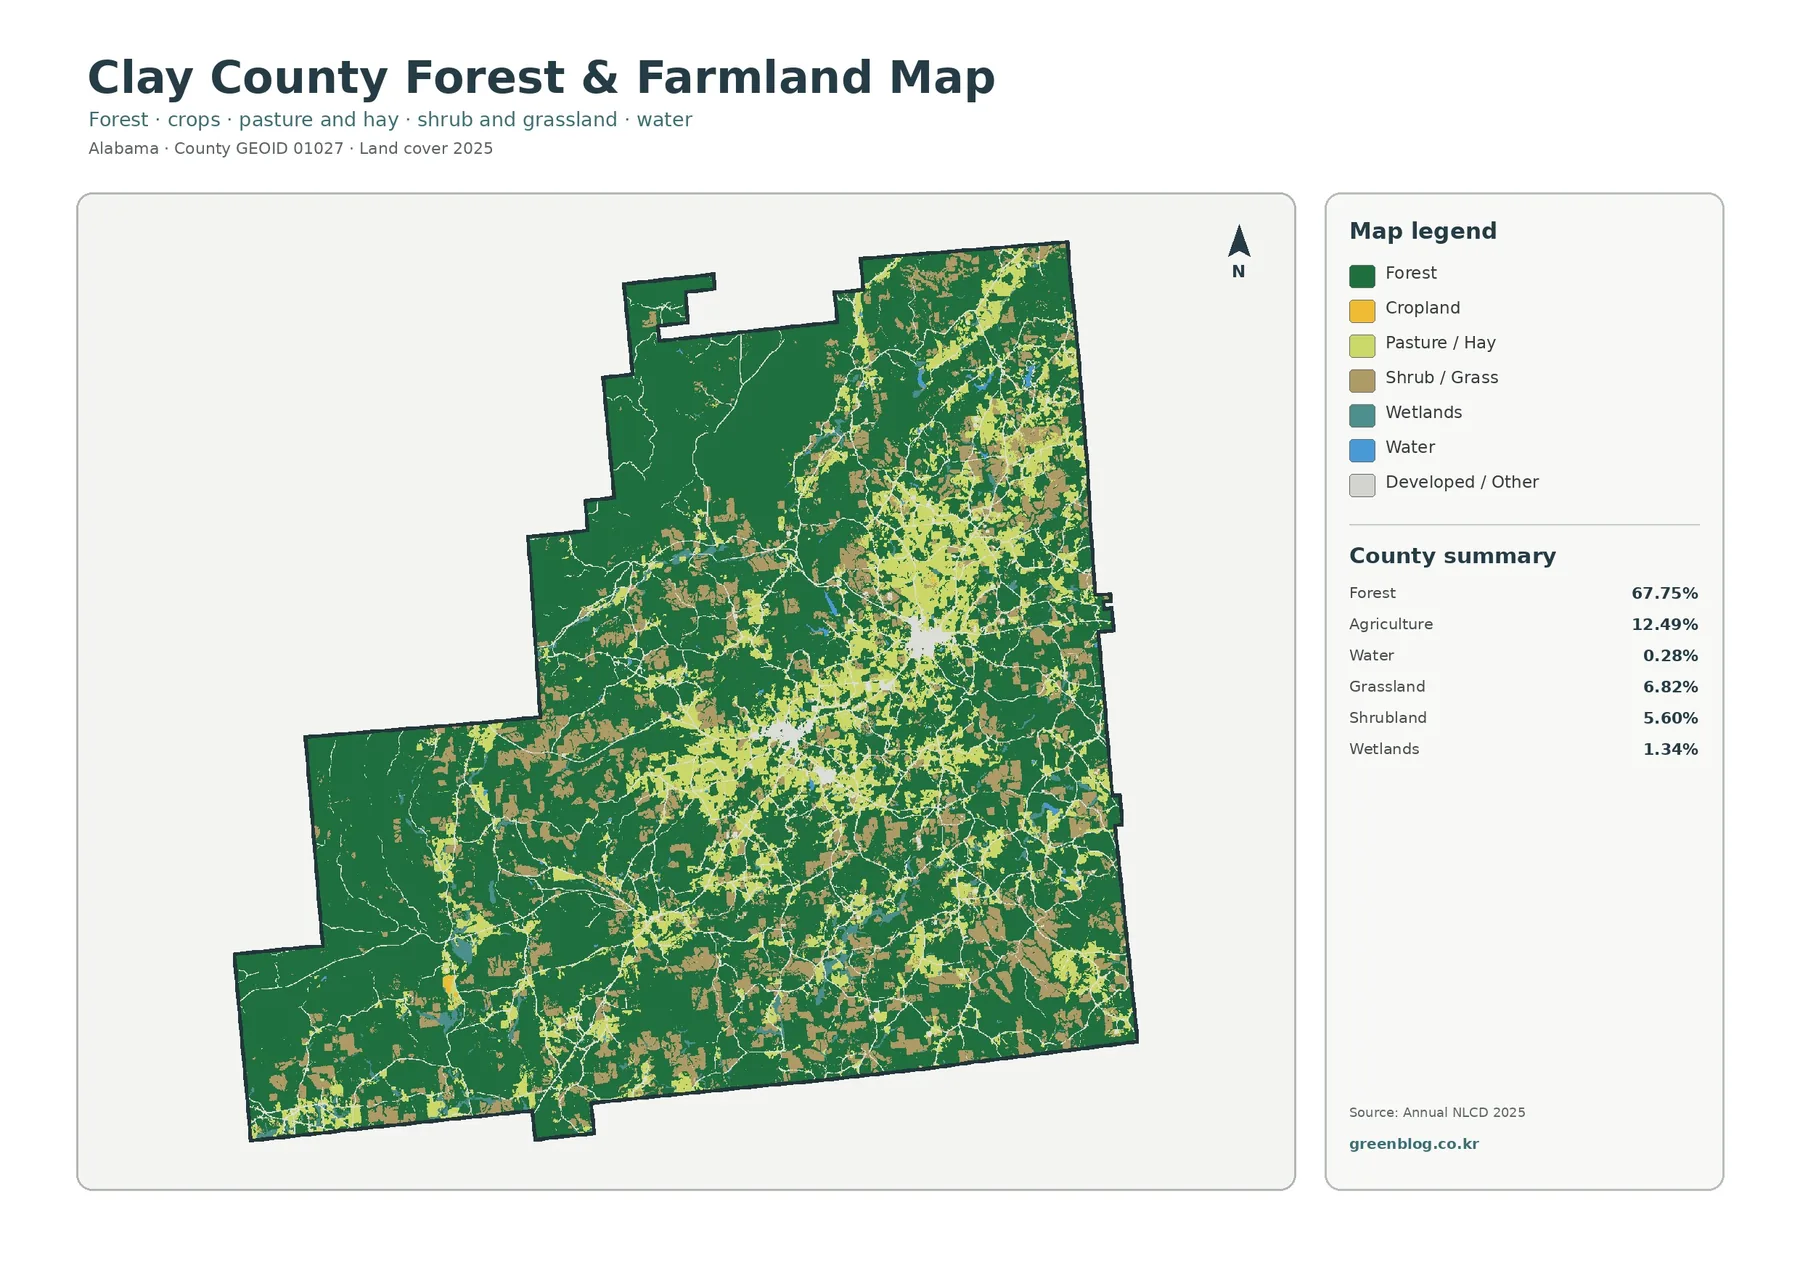
The forest-and-farmland map removes some of the visual competition between classes and makes the contrast between wooded and open ground easier to follow. Forest remains the dominant background across nearly every portion of the county. Agriculture, pasture or hay, and shrub or grass classes are more fragmented and often sit along the edges of larger green areas. For classroom work or a quick county comparison, this version is often easier to read than the full land-cover legend because the major vegetation groups stand out immediately.
The 67.75% forest figure also fits a broader regional context. A USDA Forest Service plan for the National Forests in Alabama identifies Clay County among the counties containing the Shoal Creek and Talladega districts of Talladega National Forest. That official information helps explain why public forest management is relevant to the county, but it is important not to overextend the connection. The green land-cover cells are not an ownership map. Forest-classified land can include federal, state, local, corporate, or private property.
Water and wetlands are minor classes in the county summary but should still be kept separate. Open water is 0.28%, while wetlands account for 1.34%. A wetland is not simply a blue water surface; wet soils and wetland vegetation can be classified separately from open water. On a county where both percentages are small, looking at only the blue cells can understate the amount of land associated with wetter conditions. Even so, this map is not a legal wetland delineation and should not be used as one.
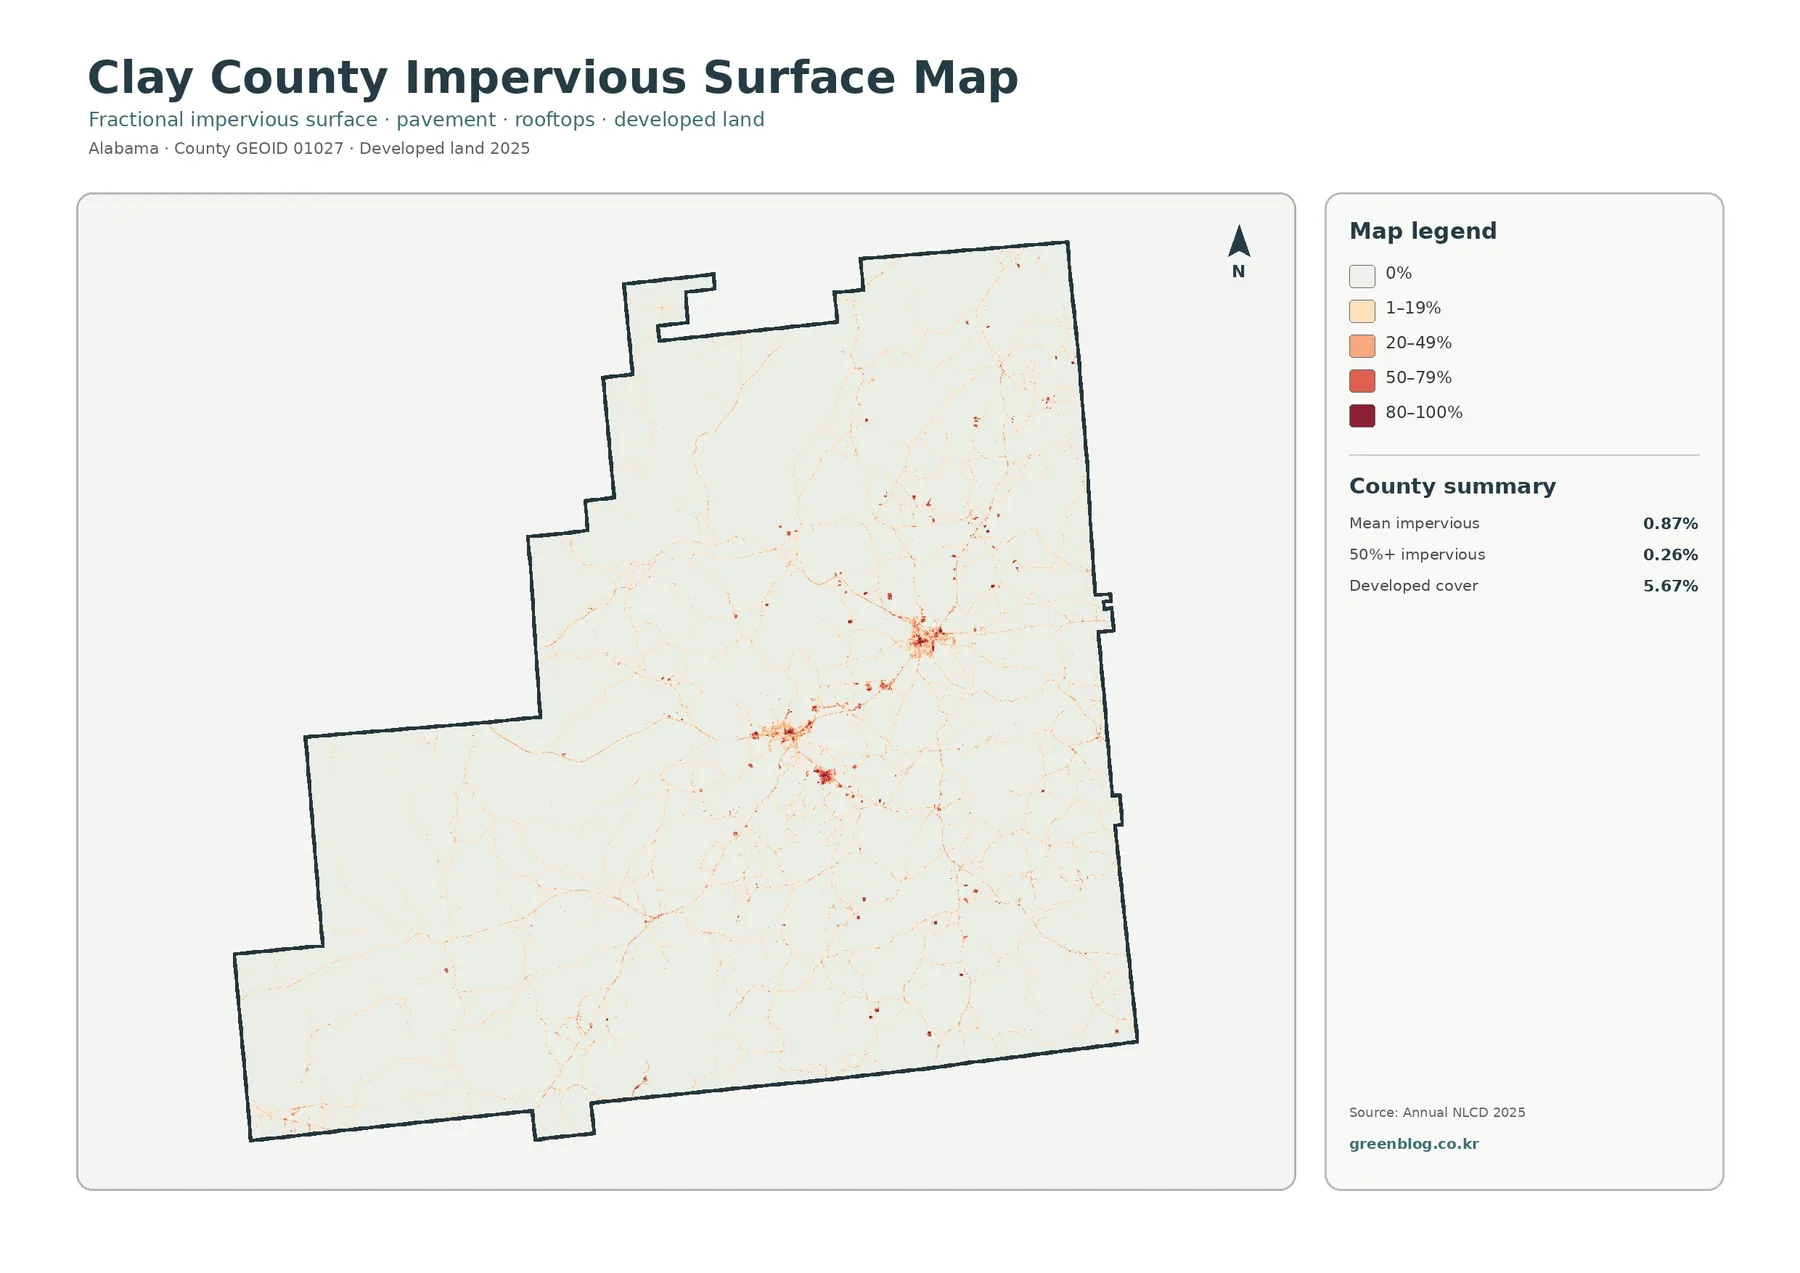
What the 0.87% mean impervious value reveals—and what it does not
Impervious surface means hard material such as pavement and rooftops where rainfall does not readily soak into the ground. Clay County’s mean impervious value is 0.87%, and areas at or above 50% impervious make up 0.26% of the county. These values are much lower than the 5.67% developed-land share because developed land and impervious surface measure different things. A developed cell can still contain lawns, trees, bare soil, and other permeable surfaces in addition to buildings and pavement.
Most of the impervious map is very light. The strongest orange and red concentrations are small and appear mainly around the same central and northeastern clusters that stand out on the general land-cover map. Thin lines connect or extend from those clusters, showing how hard surfaces can follow transportation patterns even when the countywide average remains low. This is why an average should not be treated as a complete description of development: a small amount of highly concentrated pavement can be visually important while contributing little to a countywide mean.
The impervious layer is useful for preparing watershed studies, comparing settlement intensity, or illustrating the difference between a developed class and an actual hard surface. It cannot, by itself, establish flood risk, drainage performance, or water-quality impacts. Those questions require elevation, soils, rainfall, stream networks, drainage infrastructure, and often field observations. The best use of this map is to locate concentrations that may deserve closer study rather than to make a final environmental judgment.
Reading the 35.40% class difference from 1985 to 2025 carefully
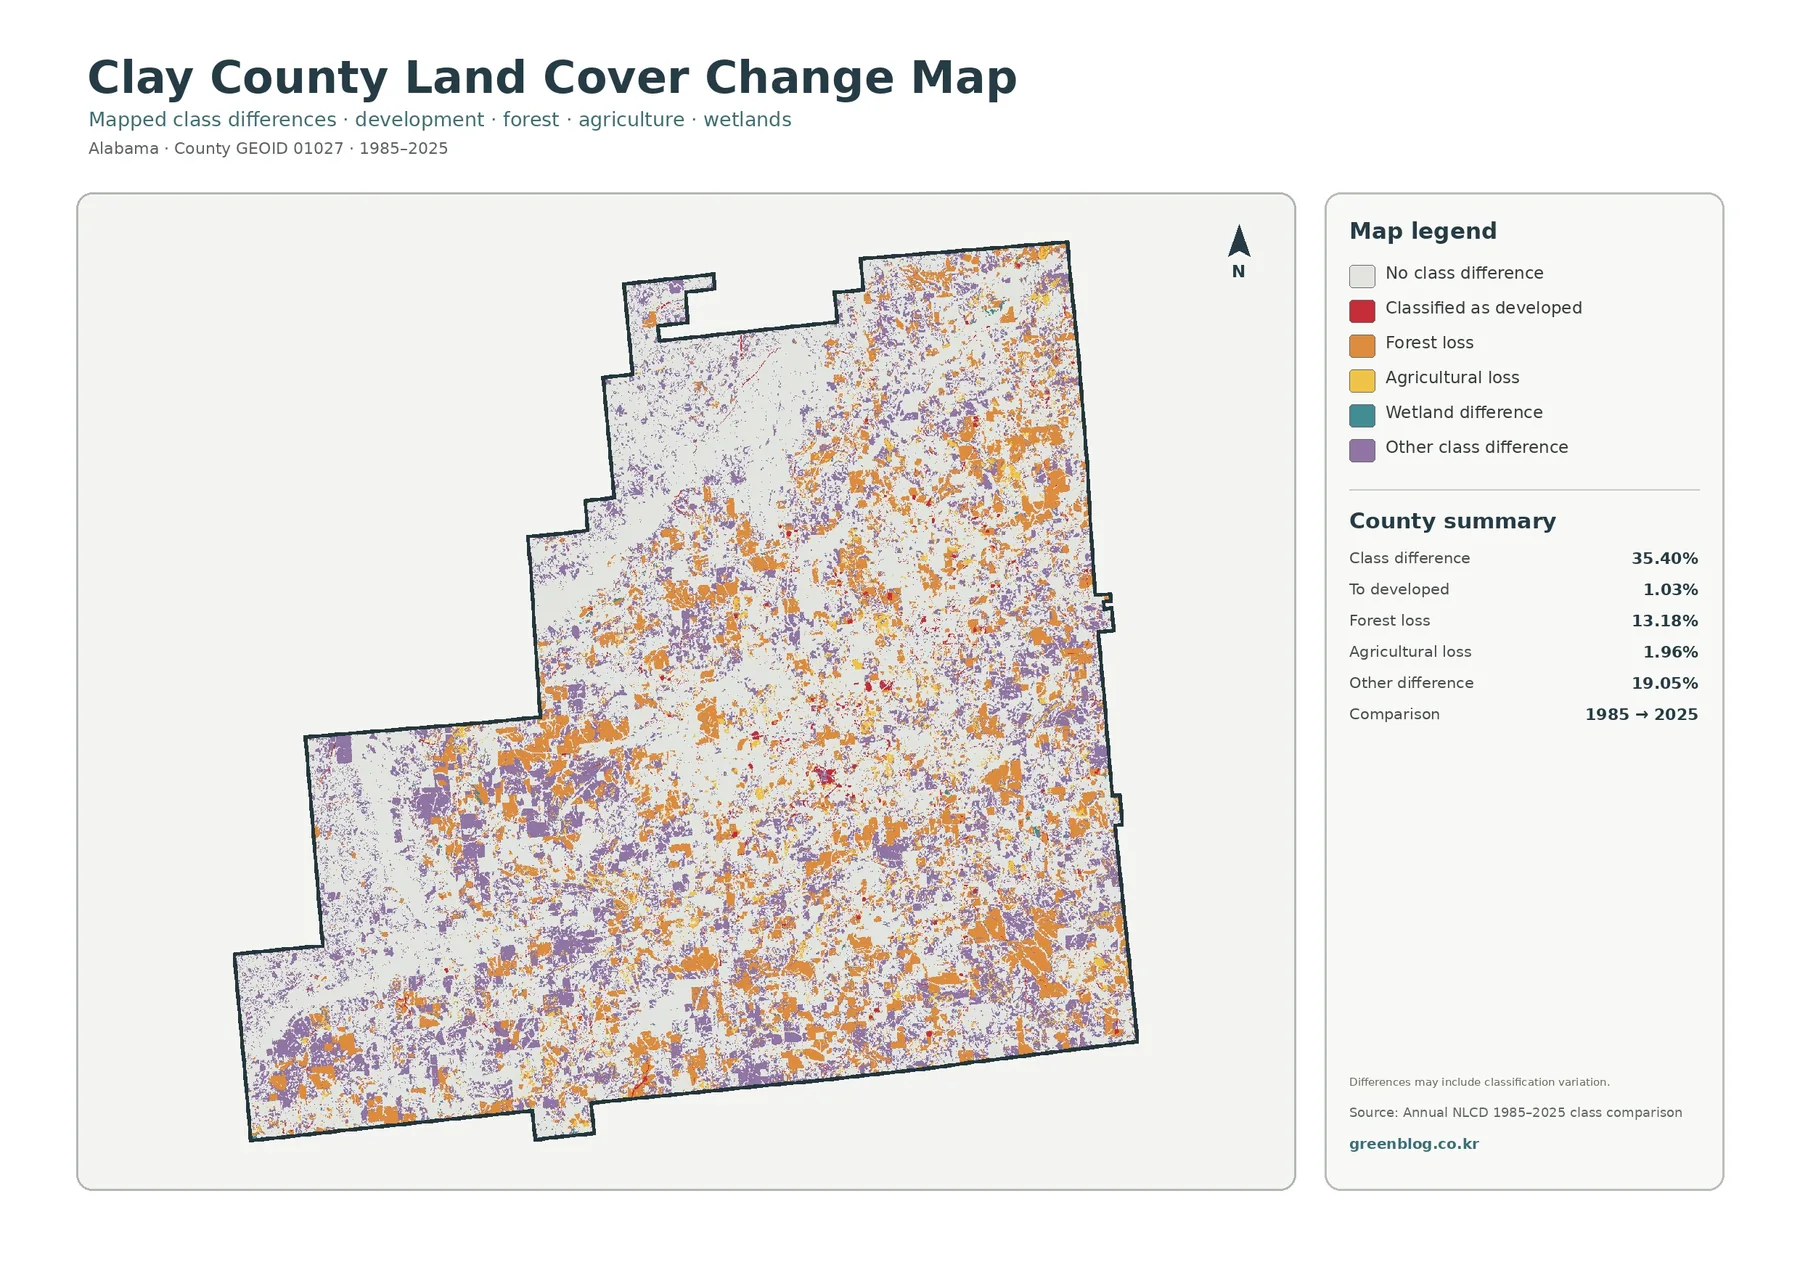
The change map compares land-cover classes at two endpoints, 1985 and 2025. Its summary reports a class difference across 35.40% of Clay County. That number is not a development rate and it is not a single measure of forest removal. The components shown on the map include 1.03% classified as developed, 13.18% forest loss, 1.96% agricultural loss, 19.05% other class difference, plus wetland difference shown as a separate legend category.
Orange forest-loss cells and purple other-difference cells are spread widely across the county rather than confined to one urban edge. Some appear as small speckles, while others form larger patches. Red cells associated with a shift to developed land are more limited and occur around several of the same locations highlighted on the current impervious map. Visually, this makes an important point: most of the mapped class difference cannot be summarized as urban growth.
The 13.18% forest-loss category also needs cautious wording. It indicates cells that were mapped as forest at the earlier endpoint and differently at the later endpoint under the comparison method. It does not tell us, on its own, whether every cell experienced permanent forest conversion. Harvest and regrowth, changes among forest, shrub, and grass classes, agricultural transitions, image conditions, and classification variation can all require additional investigation. The map is most useful for identifying where to look next.
A note on the map warns that class differences may include classification variation. Annual land-cover products use 30-meter raster cells, so mixed surfaces near forest edges, fields, roads, wetlands, and buildings can be generalized into one class. If a specific site matters, a better workflow is to check intermediate Annual NLCD years, historical aerial imagery, and local records rather than assuming that the two endpoints provide a complete history.
A practical way to use all four Clay County maps together
When comparing the four maps, begin with two easy reference areas: the broad forest in the northwest and the more visible developed clusters near the center and northeast. On the general map, identify the current 2025 class first. Next, use the forest-and-farmland view to see whether nearby open land is grouped as agriculture, grass, shrub, wetland, or another broad class. Then move to the impervious layer to see whether hard surfaces are concentrated at the same location. Only after establishing the current pattern should the change map be used to ask whether the endpoint classes differ.
This sequence prevents two common mistakes. A place that is forest in 2025 can still carry a change color if its 1985 classification differed. Likewise, a place with no mapped class difference is not necessarily undeveloped or natural; it simply has the same class at the two comparison endpoints. Current condition and long-term class comparison answer different questions, so keeping them in separate steps produces a clearer explanation.
For county-to-county comparisons, match the indicators and years. Compare Clay County’s 67.75% forest share with another county’s 2025 forest share, not with that county’s historical change percentage. Compare the 0.87% mean impervious value with the same impervious metric elsewhere. If the time window for change is different, note that difference rather than placing the percentages side by side as though they were equivalent.
Download the four original JPG maps
The ZIP download contains four original 2480×1754 JPG files: the 2025 land-cover map, the forest-and-farmland map, the impervious/developed-land map, and the 1985–2025 class-difference map. These are larger than the 1800-pixel-wide WebP previews used in the article. The JPGs are useful for reports, slides, handouts, and comparative layouts because each map keeps its own legend and county summary on the image.
The asset manifest does not mark these JPGs as meeting the package’s A3 high-resolution reference. They can still work well for screens, documents, classroom handouts, and moderate-size printing, but a large poster should be test-printed first. Increasing the displayed size of the JPG does not increase the underlying spatial detail of the land-cover data.
Keep the map type and year in the filename or caption when sharing the files. A generic name such as “Clay County map” can easily cause the 2025 current-cover image to be confused with the 1985–2025 comparison. That distinction matters because 67.75% forest describes a current class share, while 35.40% describes endpoint class differences. Clear labeling makes later reuse much safer.
Limits of a 30-meter land-cover classification
Annual NLCD is raster data: the landscape is divided into cells and each cell receives a representative class. The official classification uses 30-meter spatial resolution. A single cell may contain trees, grass, a narrow road, a building, or a stream edge at the same time, so the final class generalizes that mixture. Zooming in on the image can make the pixels larger on screen, but it does not turn them into parcel boundaries or a site survey.
Land cover is also different from legal land use and ownership. A forest cell does not say who owns the land, whether timber harvest is allowed, whether the site is within a protected area, or whether development is permitted. An agriculture cell is not a tax parcel or zoning designation, and developed cover is not a municipal boundary. Property, permitting, zoning, and ownership questions require current administrative records.
The 2025 map is a snapshot of the classification for that year. Construction, forestry activity, vegetation recovery, and agricultural changes after the observation period may not appear. The 1985–2025 comparison also does not show when an intervening change happened or whether a location changed more than once. With those limits in mind, the maps work best as county-scale reference graphics and as a starting point for more detailed research.
Frequently Asked Questions
What is the dominant 2025 land-cover class in Clay County?
Forest is the dominant class at 67.75%. Agriculture follows at 12.49%, with grassland at 6.82%, developed land at 5.67%, shrubland at 5.60%, wetlands at 1.34%, and open water at 0.28%. The map also shows that the largest forest blocks are not distributed identically across the county.
Why is developed land 5.67% while mean impervious surface is only 0.87%?
Developed land is a broader land-cover category that can include grass, trees, and soil along with buildings and pavement. Impervious surface measures the hard portion more directly. Clay County also has only 0.26% of its area mapped at 50% or more impervious, so concentrated hard surfaces occupy a small share of the county.
Does the 35.40% class difference mean 35.40% of Clay County was developed?
No. The mapped shift to developed is 1.03%. The 35.40% total also includes 13.18% forest loss, 1.96% agricultural loss, 19.05% other class difference, and wetland differences. It is an endpoint classification comparison, not a single development statistic.
Is every forest-colored area part of Talladega National Forest?
No. USDA Forest Service information confirms that Talladega National Forest districts include land in Clay County, but the land-cover map does not display ownership boundaries. Forest-colored cells indicate surface cover, not whether the property is federal, state, local, corporate, or privately owned.
What is included in the download ZIP?
The ZIP includes four 2480×1754 JPG maps: 2025 land cover, forest and farmland, impervious/developed land, and the 1985–2025 class comparison. The package does not mark the source JPGs as meeting its A3 high-resolution reference, so test large-format prints before relying on them for a poster.
Map File Information
Clay County Land Cover Maps 2025 land cover, forest & farmland, impervious/developed land, and 1985–2025 class-difference maps in four original JPG files
- Included Files: Use only the versions confirmed in the article and supplied images
- File Type: Use the confirmed download contents
- Intended Use: Printing, education, presentations, and map-based projects
Related Maps
- Autauga County Alabama Land Cover Map
- Baldwin County Alabama Land Cover Map
- Barbour County Alabama Land Cover Map
Sources and references
- MRLC Annual NLCD Data – official access to Annual NLCD land-cover and related data products.
- USGS Annual NLCD Land Cover Classification – official explanation of land-cover classes and the classification system.
- U.S. Census Bureau TIGER/Line Shapefiles – federal geographic boundary data used for county-level reference.
- USDA Forest Service – National Forests in Alabama Forest Plan – official forest planning material identifying Clay County within the Talladega National Forest district context.
Green Map creates custom-edited map images using open geographic data sources such as geoBoundaries, Natural Earth, OpenStreetMap, and government open data.
These maps are edited visual materials, not raw data files, and are provided for education, documents, presentations, and graphic reference.