Yuma County occupies Arizona’s far southwest corner, where a compact cluster of communities around Yuma contrasts with a much larger expanse of desert to the east and north. This Yuma County Arizona Map page shows Yuma, Somerton, San Luis, Wellton, Interstate 8, Route 95, the Colorado and Gila rivers, desert washes, and the sharp rise from low southwestern terrain into higher mountain country. You can download the matching high-resolution JPG map files together in one ZIP, while the WebP versions on the page let you preview each map before choosing the files you need.
Yuma is the easiest place to begin. Somerton, Gadsden, and San Luis lie nearby to the south and southwest, while Fortuna Foothills and Wellton extend the settled corridor eastward. Interstate 8 continues from this urban area across the county through Tacna and toward Dateland. North and east of that corridor, place labels become much less frequent and drainage lines dominate more of the map. The difference between the populated southwest and the broad desert interior is one of the clearest features visible at county scale.
Table of Contents
Interstate 8 ties the Yuma area to the long eastern side of the county
The general map places Yuma at the center of the busiest group of labels. Somerton and San Luis sit to the southwest, Gadsden is close to the western side, and Fortuna Foothills is immediately east of Yuma. Wellton is farther along the eastbound corridor. Compared with those locations, the northern and eastern parts of the county have far fewer settlement labels, which makes the road system and drainage network more visually prominent.
Interstate 8 is the strongest east-west road reference. It passes the Yuma area, continues by Wellton and Tacna, and reaches the Dateland side of the map. Route 95 is a useful north-south marker near Yuma. Farther north, labels such as Yuma Proving Ground and Martinez Lake help identify the county’s northwestern side, while Dateland and Aztec help orient the long eastern section. Nearby labels outside the boundary, including La Paz Valley and Ehrenberg, give additional regional context.
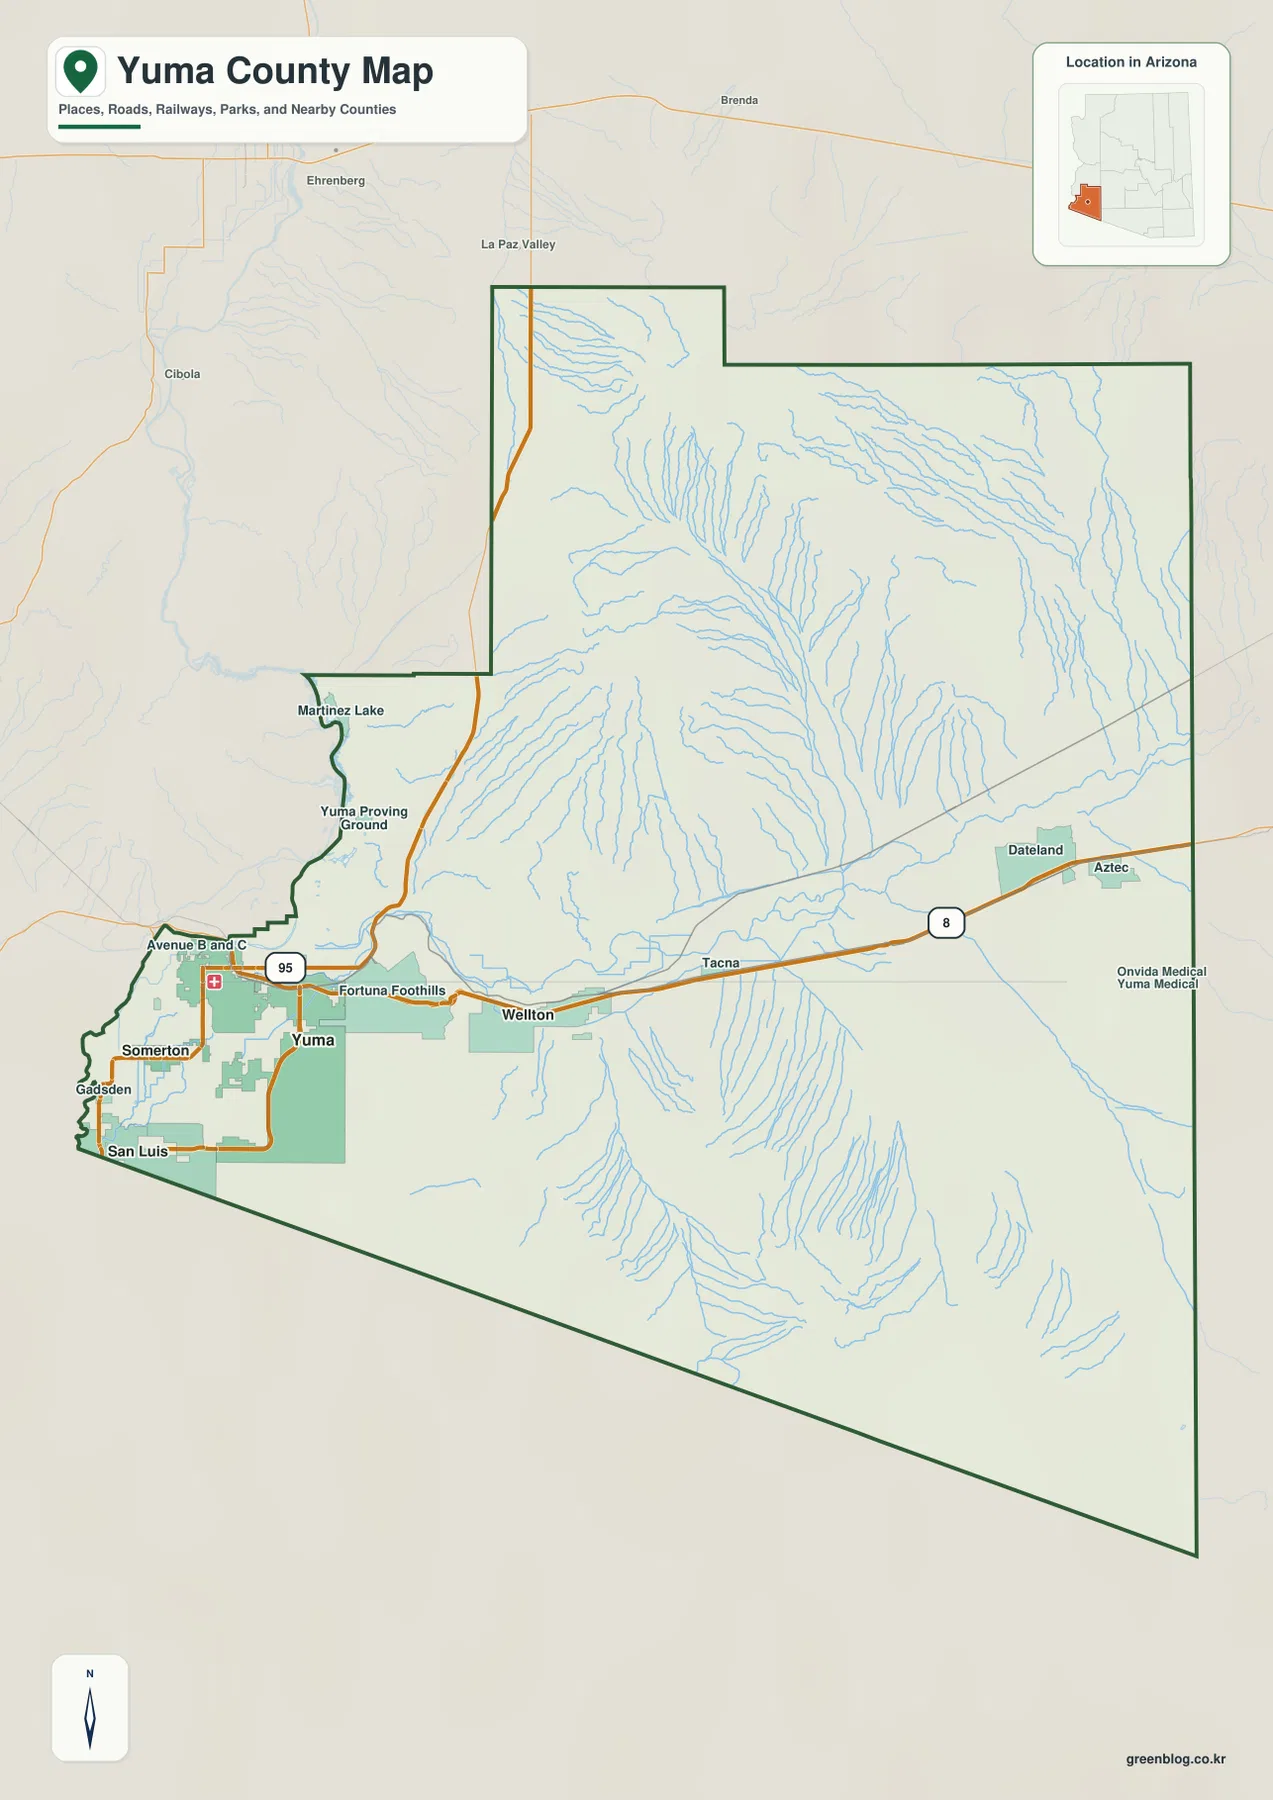
The outline itself is distinctive. The northwestern side steps inward before the county widens again across the north and east. Along the western side, river-related terrain and drainage are close to the boundary, while the southeast stretches across a broad, lightly settled desert. This is a county reference map rather than a live navigation product, so current road conditions, closures, turn-by-turn routing, and exact addresses should be checked with up-to-date transportation sources.
The city markers cluster tightly in the southwest
The ranked city map highlights four places: Yuma, San Luis, Somerton, and Wellton. The printed index values are 100,139 for Yuma, 37,337 for San Luis, 14,574 for Somerton, and 2,527 for Wellton. Those numbers are best treated as the values embedded in the supplied map rather than as guaranteed current population estimates. For geographic use, the relative positions are more important than the ranking itself.
Yuma, Somerton, and San Luis form a compact group near the southwestern edge of the county. Wellton is the only ranked city marker positioned noticeably farther east. No equivalent ranked city point appears across the large central, northern, or far eastern sections. That distribution makes the county’s settlement pattern easy to explain: the principal mapped cities are concentrated near the southwest, while most of the county’s land area lies beyond that cluster.
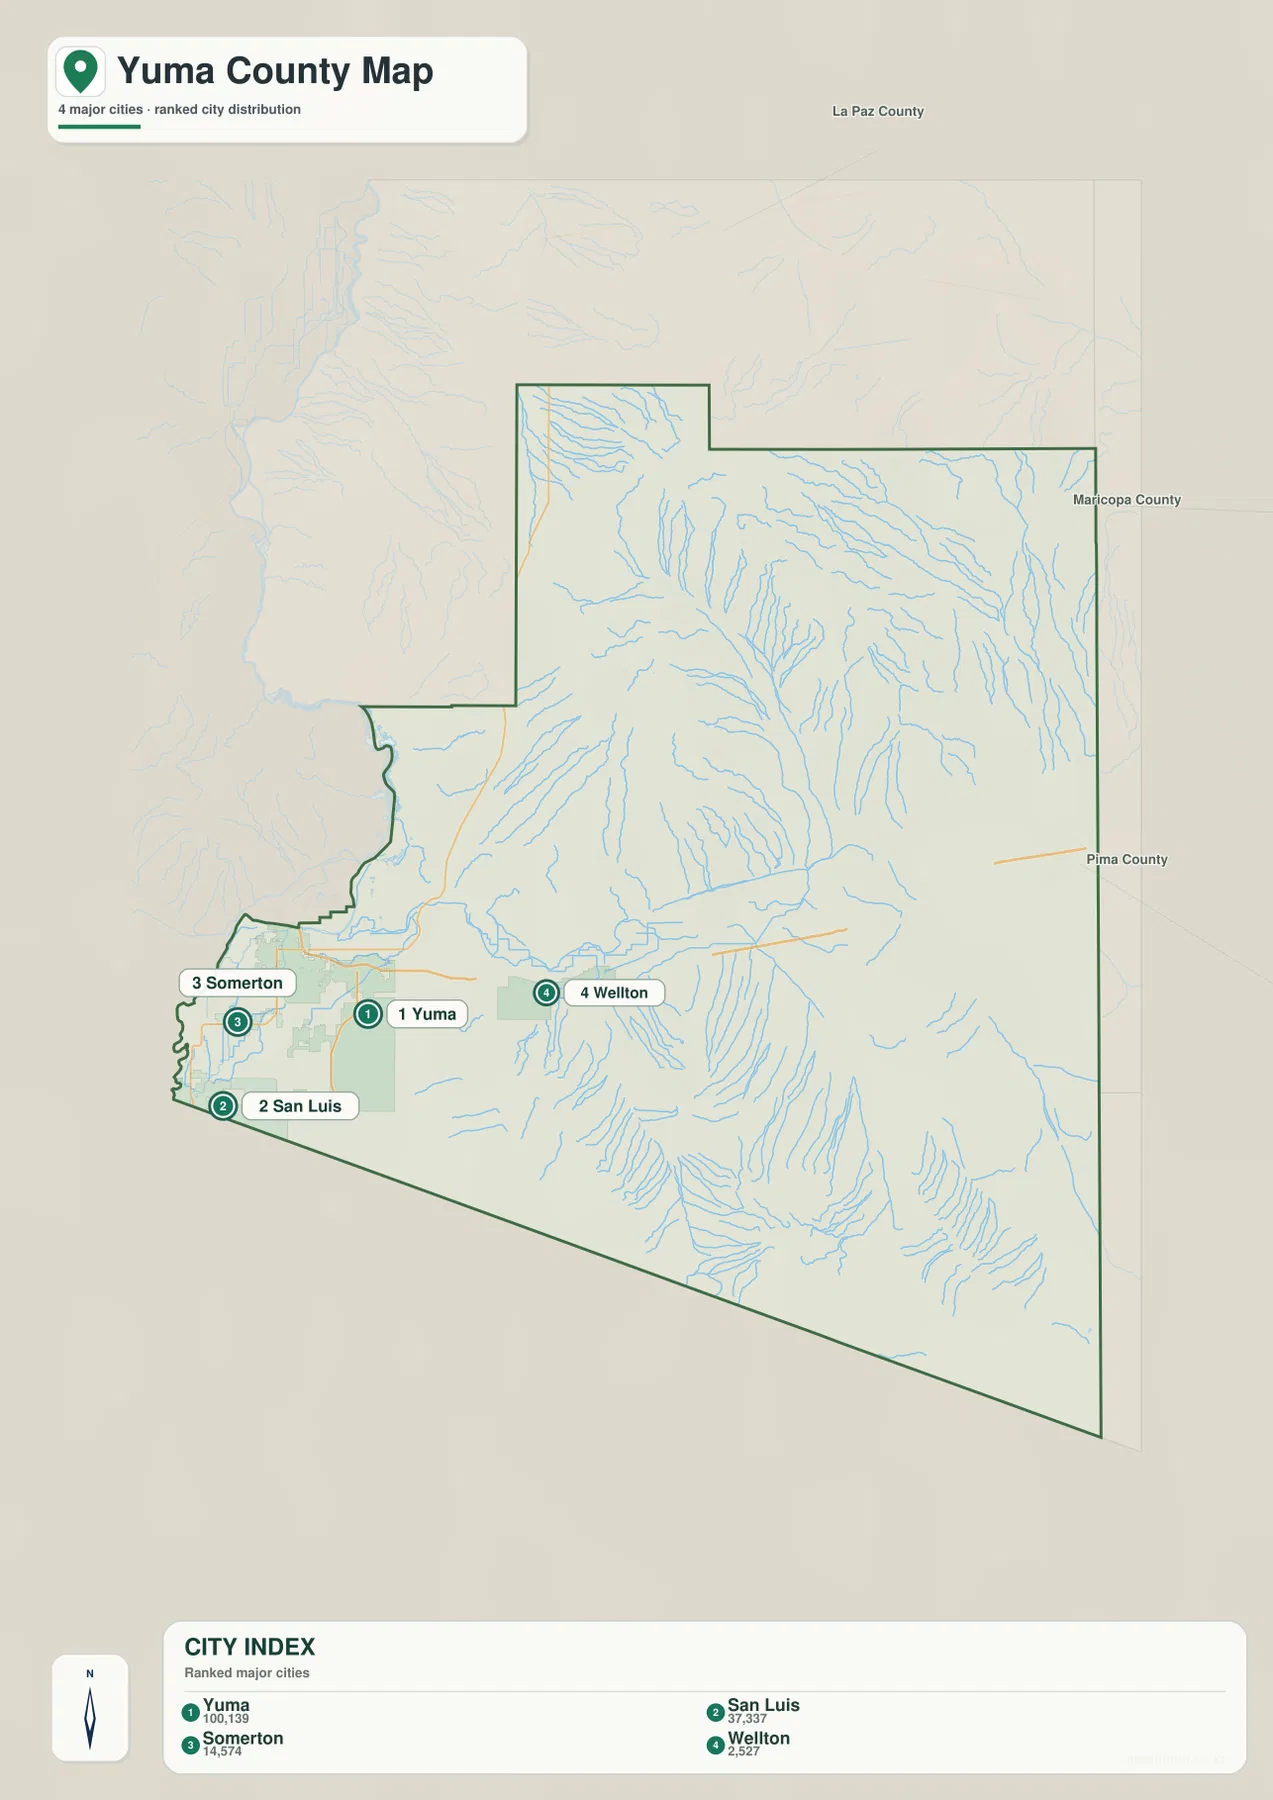
This simplified view works well when a presentation or worksheet needs only the relative location of the major mapped cities. It removes much of the road detail, which keeps the labels easy to read. When the task is to explain how Yuma and Wellton connect, the general county map is a better companion because Interstate 8 provides the missing travel context.
The Colorado and Gila rivers frame a dense network of washes and canals
The terrain-and-water map brings the western Colorado River and the Gila River into focus. The Gila enters from the east, crosses the county through a lower corridor, and continues toward the southwest. The Colorado River runs along the far western side near the low Yuma-area terrain. Between these major waterways, many smaller blue lines descend from ridges and uplands, revealing a much more complex drainage pattern than the road map suggests.
Named features on the supplied image include Red Raven Wash, Hoodoo Wash, Dripping Wash, Gravel Wash, Big Eye Wash, Castle Dome Wash, Mohawk Wash, and San Cristobal Wash. The map also labels Mohawk Canal and the Wellton-Mohawk Main Canal. These names represent different kinds of water features, so they should not all be interpreted as permanent natural streams. In an arid county, a wash may be dry for long periods, while canals are managed water infrastructure rather than natural river channels.
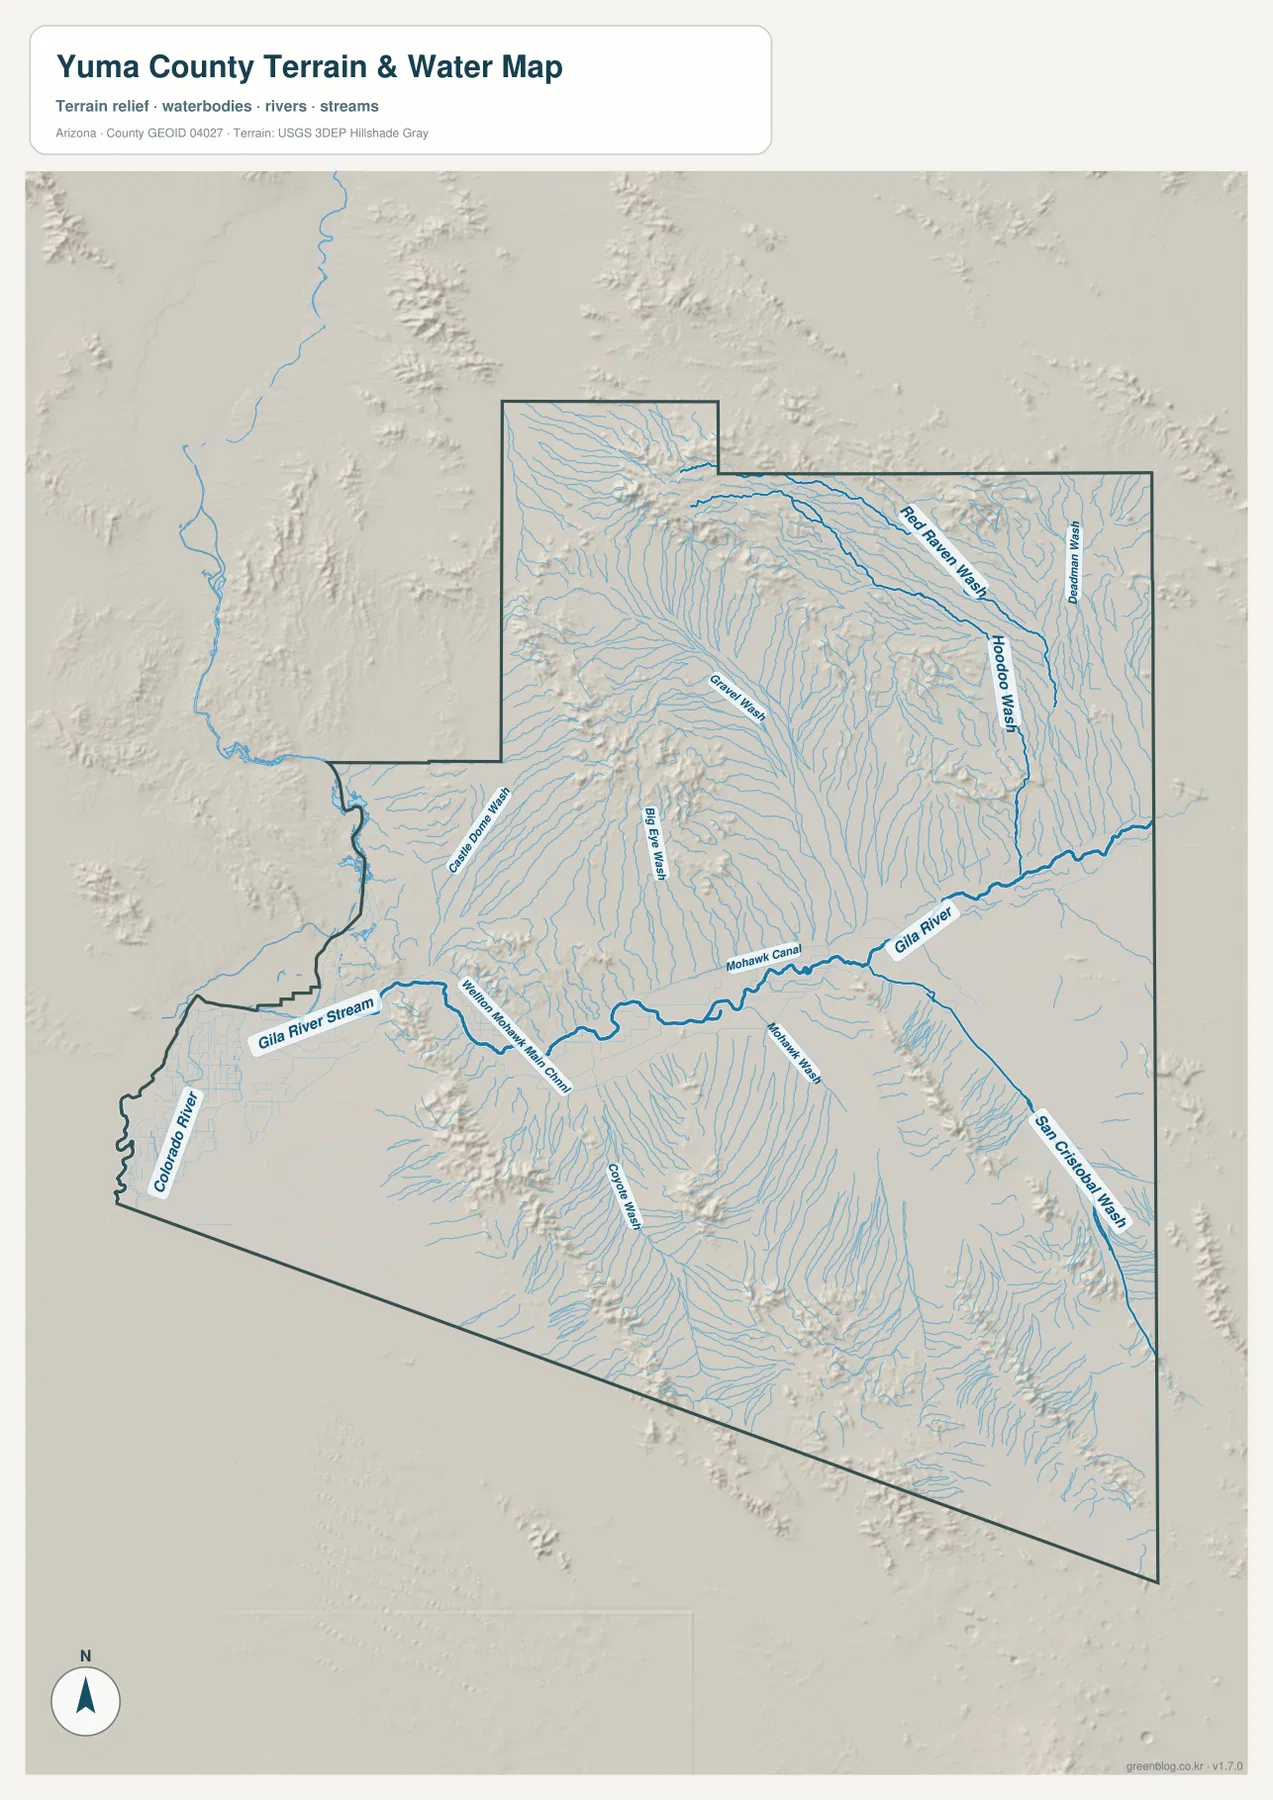
The blue lines are a geographic reference, not a report of current flow, depth, flood probability, or canal operating conditions. A named wash on the map does not imply continuous water. Flood planning, agricultural water management, drainage design, and safety decisions should rely on the current official products intended for those purposes rather than on this county overview.
Low Yuma-area terrain rises toward rugged country in the north
The elevation legend reports an actual range of about 24 to 1,451 meters, with a mean of 261 meters. Dark and medium greens dominate the southwest around the Yuma area, showing that this is among the lowest parts of the county. Much of the central interior also remains relatively low, although isolated ridges and mountain blocks interrupt the broad desert floor.
The strongest high-elevation colors appear in the north and northwest, where brown mountain terrain rises sharply above the surrounding green lowlands. Additional narrow ridges stand out through the west-central and southern interior. When the elevation map is compared with the terrain-and-water view, many washes can be seen descending away from higher ground toward the Gila corridor or the low southwestern edge. Yuma County therefore combines very low desert terrain with localized mountains that climb well above 1,000 meters.
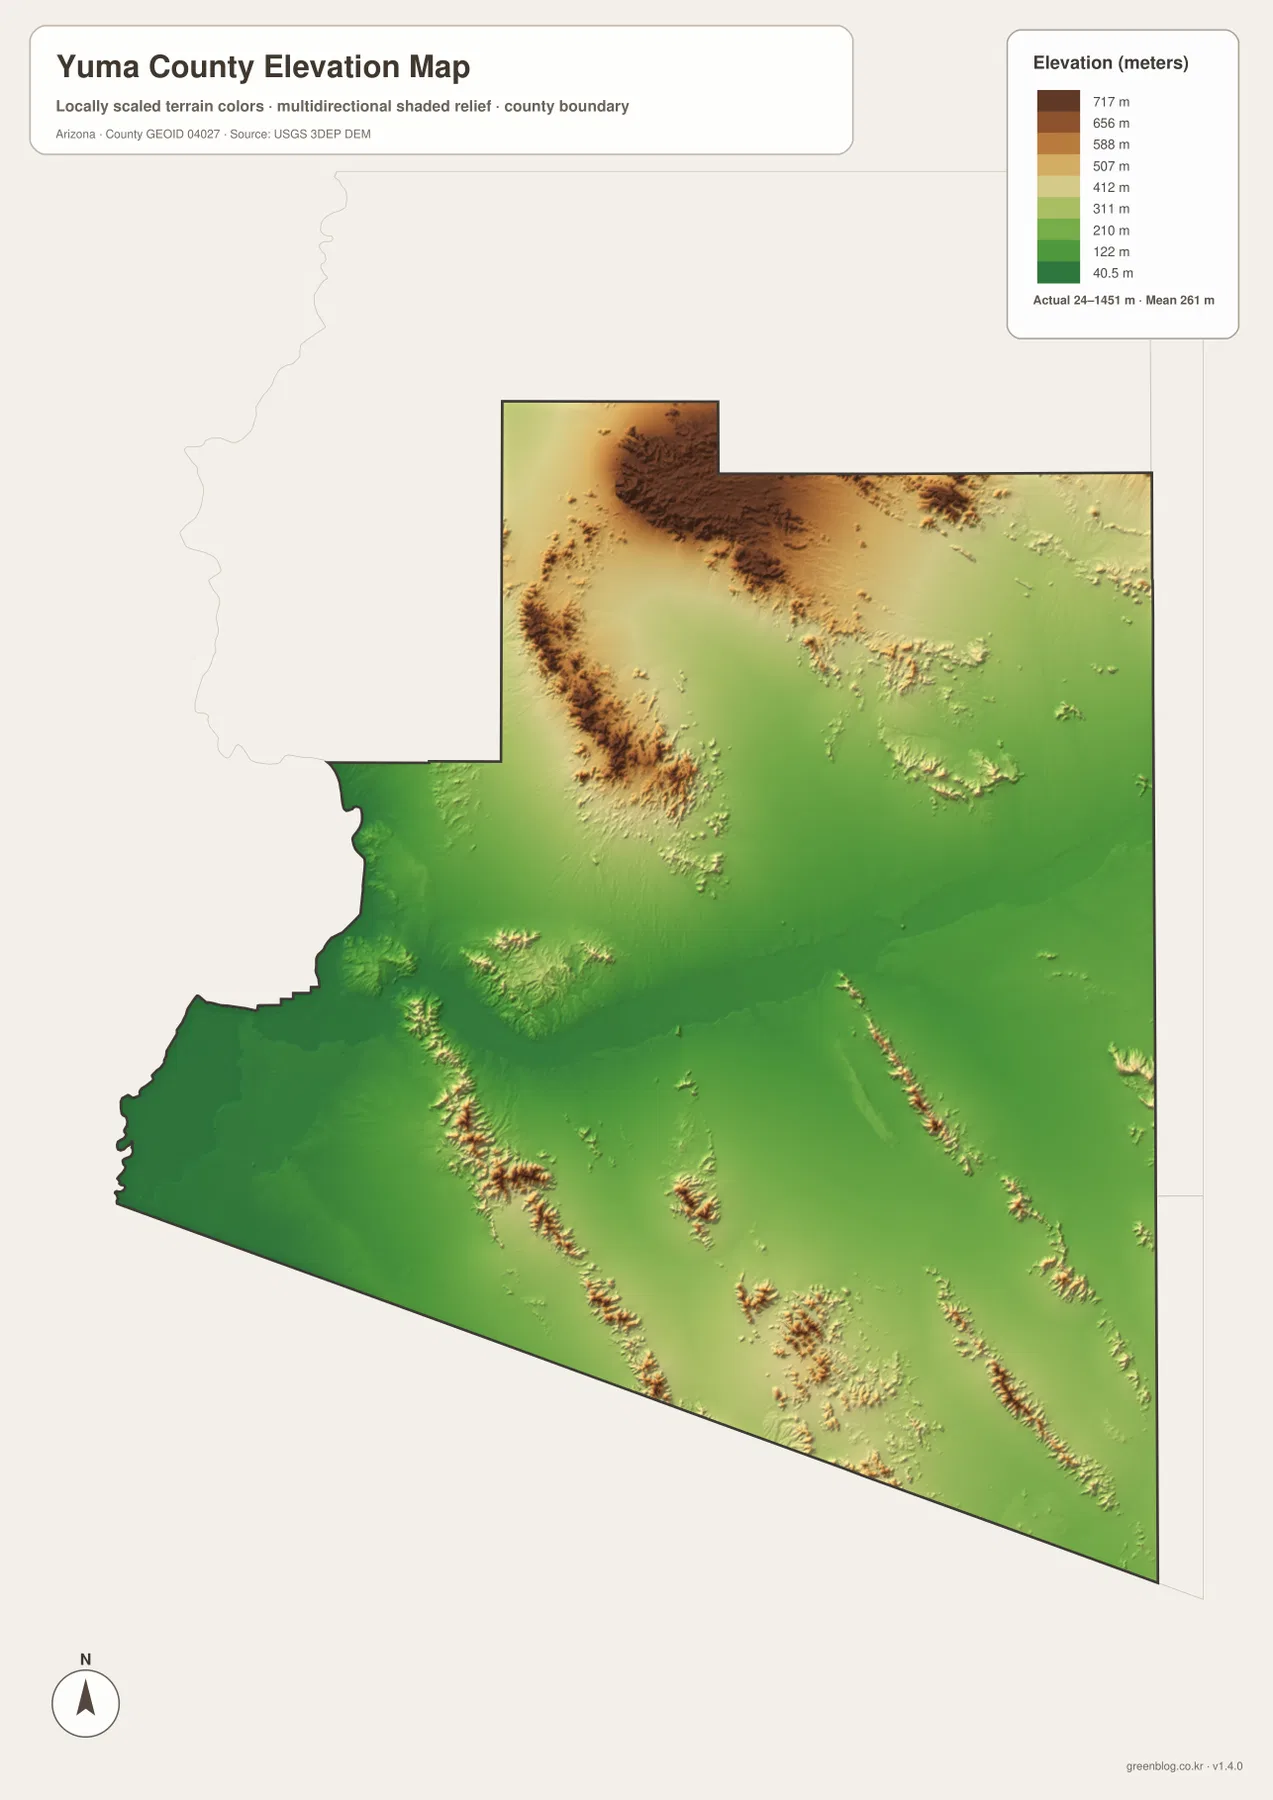
The color bands are designed for broad countywide comparison, not survey-grade measurement. Elevation still varies within each band, and small ridges or gullies can be generalized at this scale. The map is useful for showing which areas are broadly lower or higher, but engineering, construction, drainage design, and parcel-level elevation work should use original USGS data or an appropriate professional survey.
Pick the map that matches the information you need
The general county map is the most practical starting point for roads, place names, and the full outline. The ranked city view is cleaner when the main question is where Yuma, San Luis, Somerton, and Wellton sit relative to one another. The terrain-and-water map is the better choice for the Colorado River, Gila River, washes, and canals, while the elevation map makes the contrast between low southwestern desert and high northern ground immediately visible. Keeping these subjects separate prevents labels from becoming crowded.
The WebP images above are optimized for fast viewing in the article. For printing, presentations, school work, or closer inspection of labels, use the high-resolution JPG files in the ZIP below. The archive contains separate county, city, terrain-and-water, and elevation images. If a map is cropped for a handout, keeping the boundary, north arrow, and legend visible will make the result easier for another reader to interpret.
Use the maps as reference views, not specialized legal or hazard products
The general map does not show every local road, structure, or parcel boundary. Numbers printed in the ranked city index belong to the supplied image and should not automatically be treated as the newest population estimates. The water map does not measure flood risk or current streamflow, and the elevation map does not replace detailed topographic or survey data. Property research, legal boundaries, construction, agricultural water questions, and flood planning all require current authoritative sources designed for those tasks.
The official Yuma County website provides current county government and service information. U.S. Census Bureau TIGER/Line files are an official source for geographic boundary data, while USGS maintains national hydrography and elevation programs. This page has a narrower purpose: to help visitors understand the supplied Yuma County maps quickly and obtain the matching map files without confusing a general reference map with a legal, engineering, or hazard product.
Frequently Asked Questions
Which map is best for comparing Yuma, San Luis, Somerton, and Wellton?
The ranked city map is the simplest choice because it enlarges those four markers and removes much of the road detail. If you also need to see how Yuma and Wellton connect, pair it with the general county map, which shows Interstate 8.
Does every wash shown on the water map carry water year-round?
No. A wash in an arid landscape may be dry for long periods. The map shows the location of named drainage features but does not report present flow, depth, or flood risk. Current hydrologic and flood information should be checked through the relevant official sources.
Can the 24–1,451 meter range be used as an exact elevation for a property?
No. That range describes the countywide elevation surface and is suitable for broad comparison. A specific property, road, or construction site requires original elevation data or survey-grade measurements appropriate to that location.
Map File Information
Download the high-resolution Yuma County JPG files in one ZIP. The county, city, terrain-and-water, and elevation maps are stored as separate files.
- Included Files: county map, city map, terrain-and-water map, elevation map
- File Type: ZIP containing 4 high-resolution JPG files
Related Maps
Sources and reference data
- Official Yuma County website – county government and service information.
- U.S. Census Bureau TIGER/Line Shapefiles – county boundaries and geographic data.
- USGS National Hydrography – river, stream, and hydrographic reference data.
- USGS 3D Elevation Program – elevation data and 3DEP program information.
Green Map creates custom-edited map images using open geographic data sources such as geoBoundaries, Natural Earth, OpenStreetMap, and government open data.
These maps are edited visual materials, not raw data files, and are provided for education, documents, presentations, and graphic reference.