Yavapai County covers a large part of central Arizona, connecting the Prescott area with the Verde Valley and a much broader landscape of mountains, plateaus, river valleys, and lightly settled country. On the supplied maps, Prescott and Prescott Valley form the clearest central reference, Chino Valley lies to the north, and Cottonwood, Camp Verde, and Sedona mark the eastern side. Congress appears far to the southwest, making the county’s scale obvious even before the terrain is considered. This Yavapai County Map page explains the roads, ranked cities, waterways, and elevation shown in the four supplied views, and the matching high-resolution JPG files are available as one ZIP download.
Prescott is a useful place to begin. Route 89 runs north toward Chino Valley and also continues southwest, while Route 69 connects Prescott Valley with Dewey-Humboldt and the southeast. Farther east, Interstate 17 becomes the main north-south reference around Camp Verde, with Routes 169 and 260 branching into the surrounding area. Route 89A links the Cottonwood, Jerome, and Sedona side of the county. Reading the map as a Prescott-centered area and a separate Verde Valley cluster makes the large county easier to understand than trying to follow every road at once.
Table of Contents
Prescott anchors one road network while the Verde Valley forms another
The general county map contains the broadest mix of roads, place labels, streams, and the county boundary. Prescott and Prescott Valley sit near the center of the busiest cluster, and the Yavapai County Courthouse label appears in Prescott. Chino Valley is north of the two cities, with Paulden farther north. Dewey-Humboldt lies southeast of Prescott Valley. The concentration of labels around these communities contrasts with the wider, more sparsely labeled western and northwestern portions of the county.
Travel references change as the map moves east. Route 89A passes through the Jerome and Cottonwood side and continues toward Sedona. Interstate 17 runs north-south near Camp Verde, while Route 260 heads east from that part of the county. Route 169 connects the Prescott Valley side toward I-17. These routes make it possible to see which communities belong to the same broad corridor, although the map does not provide driving time, live road conditions, or turn-by-turn navigation.
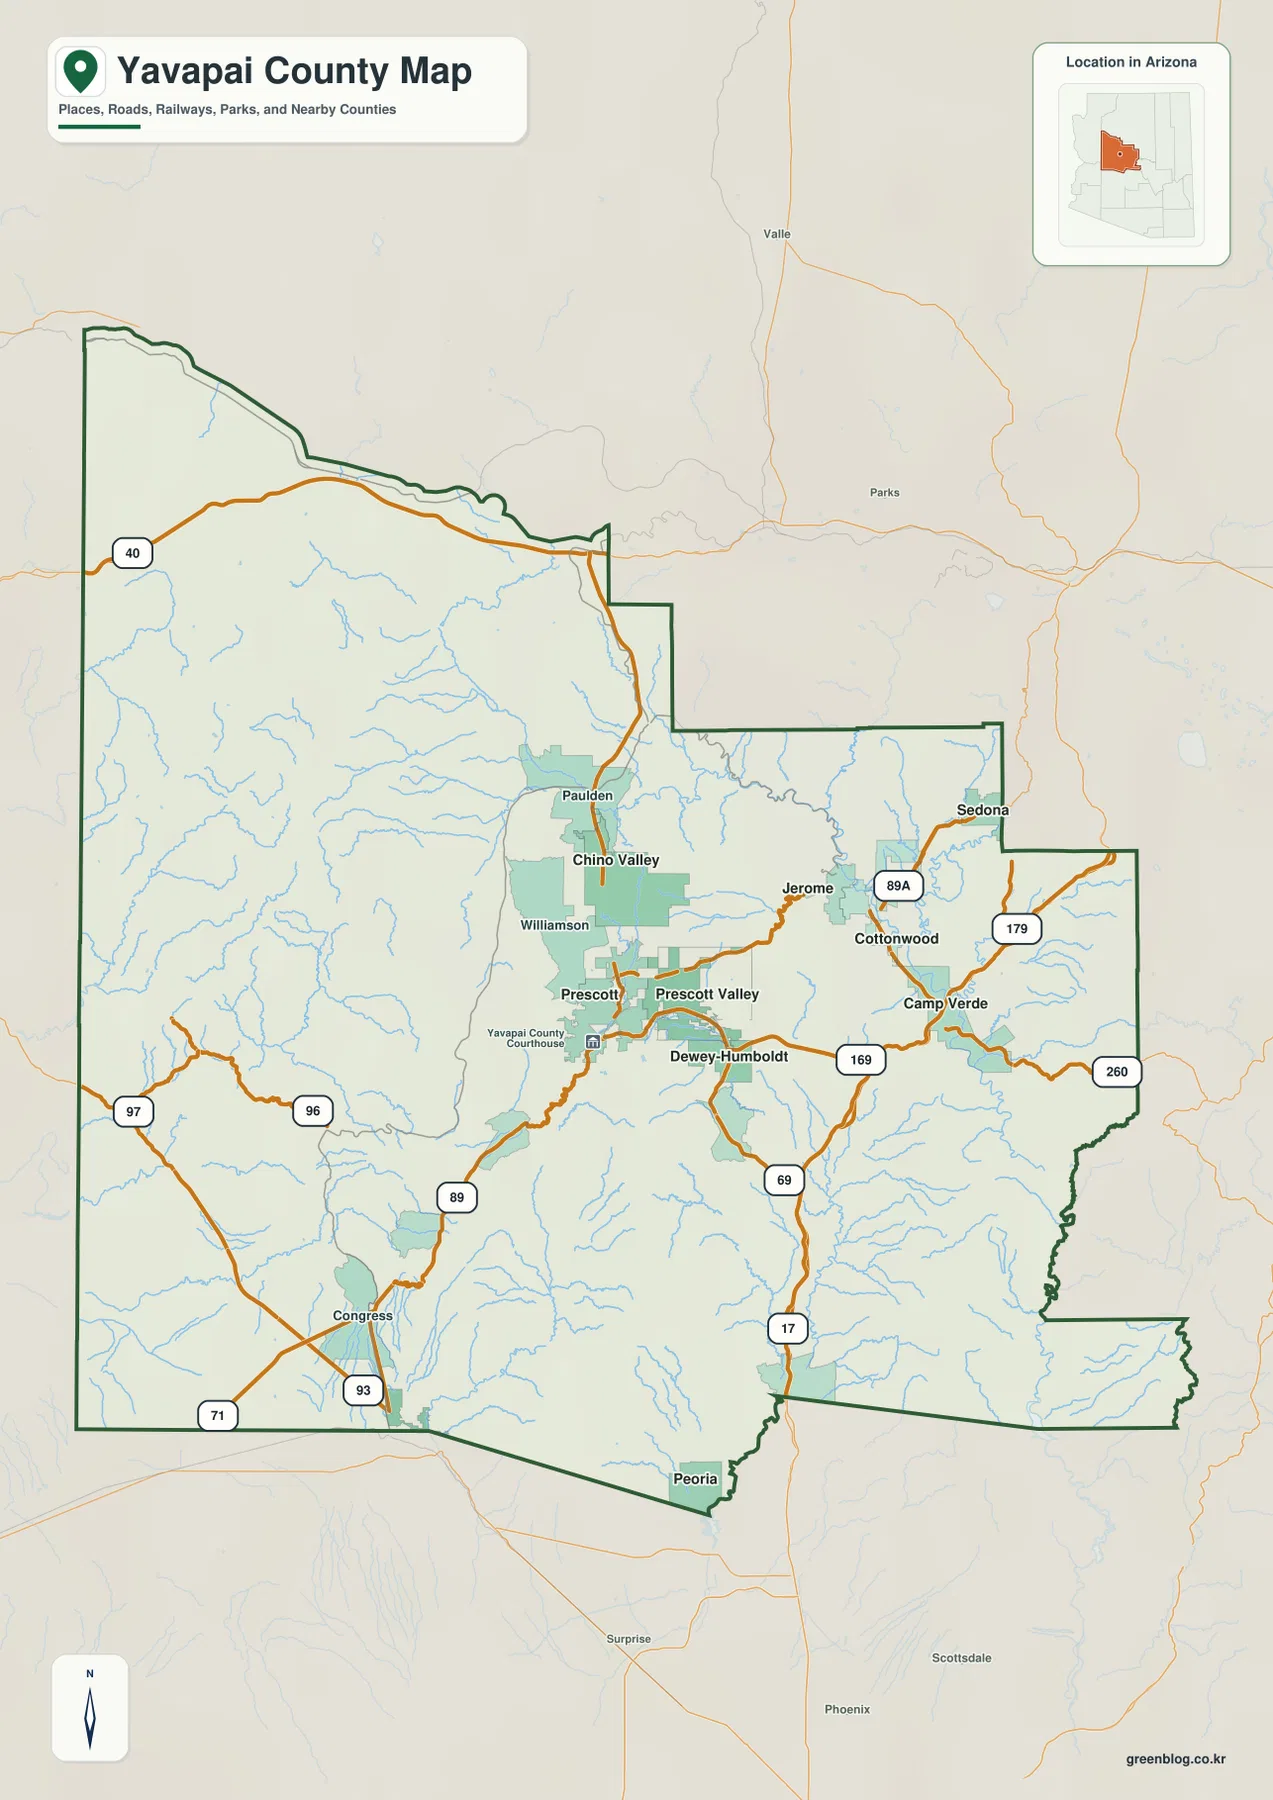
The southwest is organized differently. Congress is the clearest place label there, with Route 93 running nearby and Routes 96, 97, and 71 adding local orientation. Route 40 is visible near the northern edge of the broader map. Those roads help show how far the county extends beyond Prescott and the Verde Valley. This is still a county-scale reference, so smaller roads and access routes are not complete enough for an actual trip or property search.
The ranked city map separates the Prescott cluster from the eastern cities
The city map highlights six ranked places. The printed index lists Prescott Valley at 49,179, Prescott at 47,400, Chino Valley at 13,602, Cottonwood at 12,580, Camp Verde at 12,521, and Sedona at 9,777. These are the values embedded in the supplied map and should not be treated automatically as the latest population estimates. Their main purpose here is to identify the six cities chosen for the ranked city view.
Their positions create two obvious groups. Prescott Valley and Prescott sit close together near the center, with Chino Valley to the north. Cottonwood and Camp Verde are farther east, while Sedona is northeast of Cottonwood. The simplified map leaves out places such as Paulden, Jerome, Dewey-Humboldt, and Congress that appear on the general county map. That makes the city view easier to read, but it also means it should not be mistaken for a complete settlement map.
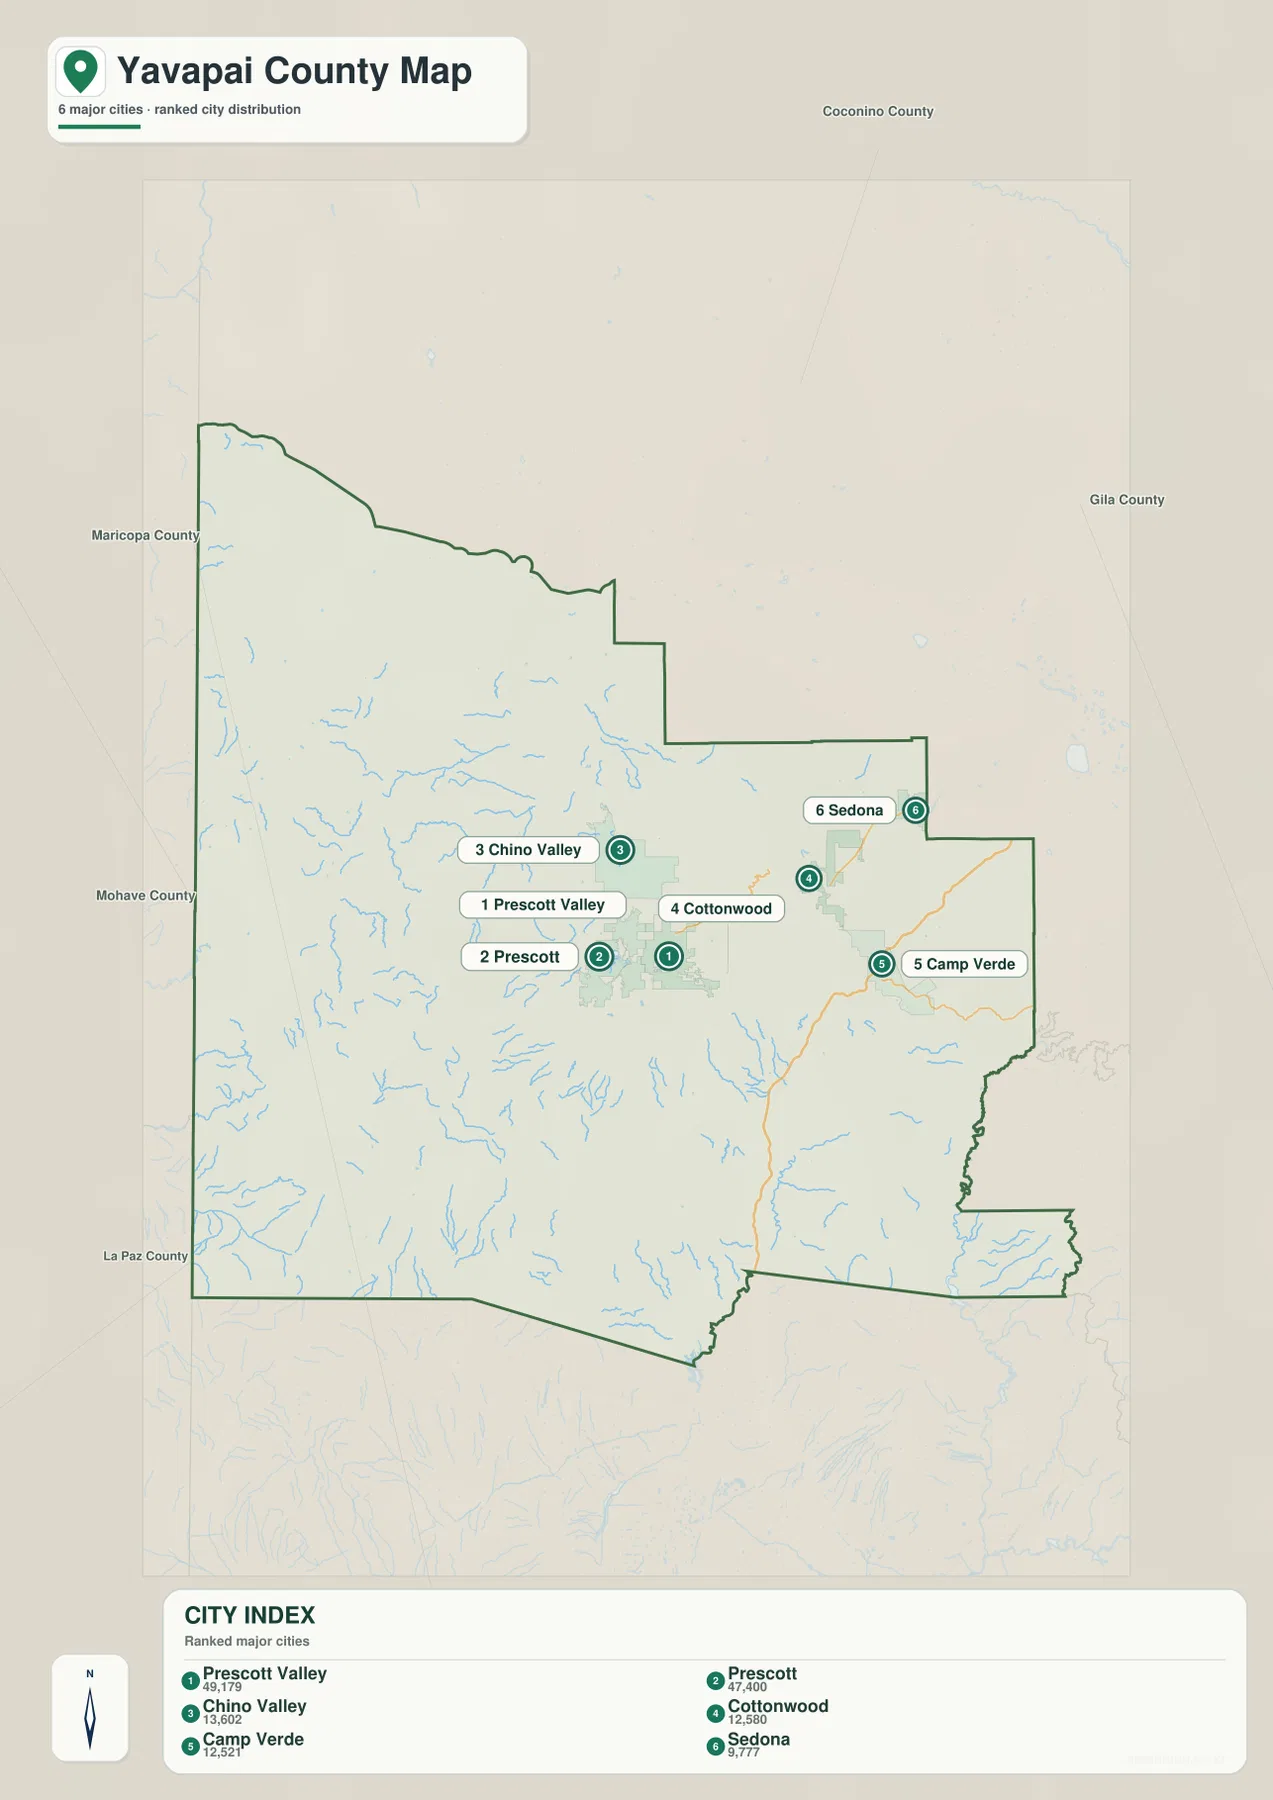
This version works well when a handout or presentation needs city positions without a dense road layer. It makes the gap between the Prescott side and the eastern communities particularly clear. If the question is how those places connect, however, the general county map is a better companion because it restores Route 89A, Route 69, Route 169, and Interstate 17. Using both views keeps the city labels readable without losing the transport context.
Verde River, Prescott lakes, and southern rivers trace the county’s valleys
The terrain-and-water map shifts attention away from cities and onto drainage. Verde River is the strongest named river in the eastern portion of the county, with Pecks Lake marked nearby. Around Prescott, Willow Creek Reservoir and Watson Lake appear close together. Their locations help explain why the water map is useful alongside the city map: the Prescott urban area sits among a more intricate set of uplands, creeks, and small reservoirs than a simple place map can show.
Other large drainage lines occupy different parts of the county. Hassayampa River runs south through the central area, while Agua Fria River and New River are marked in the southeast. In the west, Santa Maria River and South Fork Santa Maria River appear with smaller channels such as Cottonwood Creek and Boulder Creek. Horse Thief Lake is labeled in the southern interior. The overall impression is not one single river basin but several mountain-and-valley systems draining in different directions.
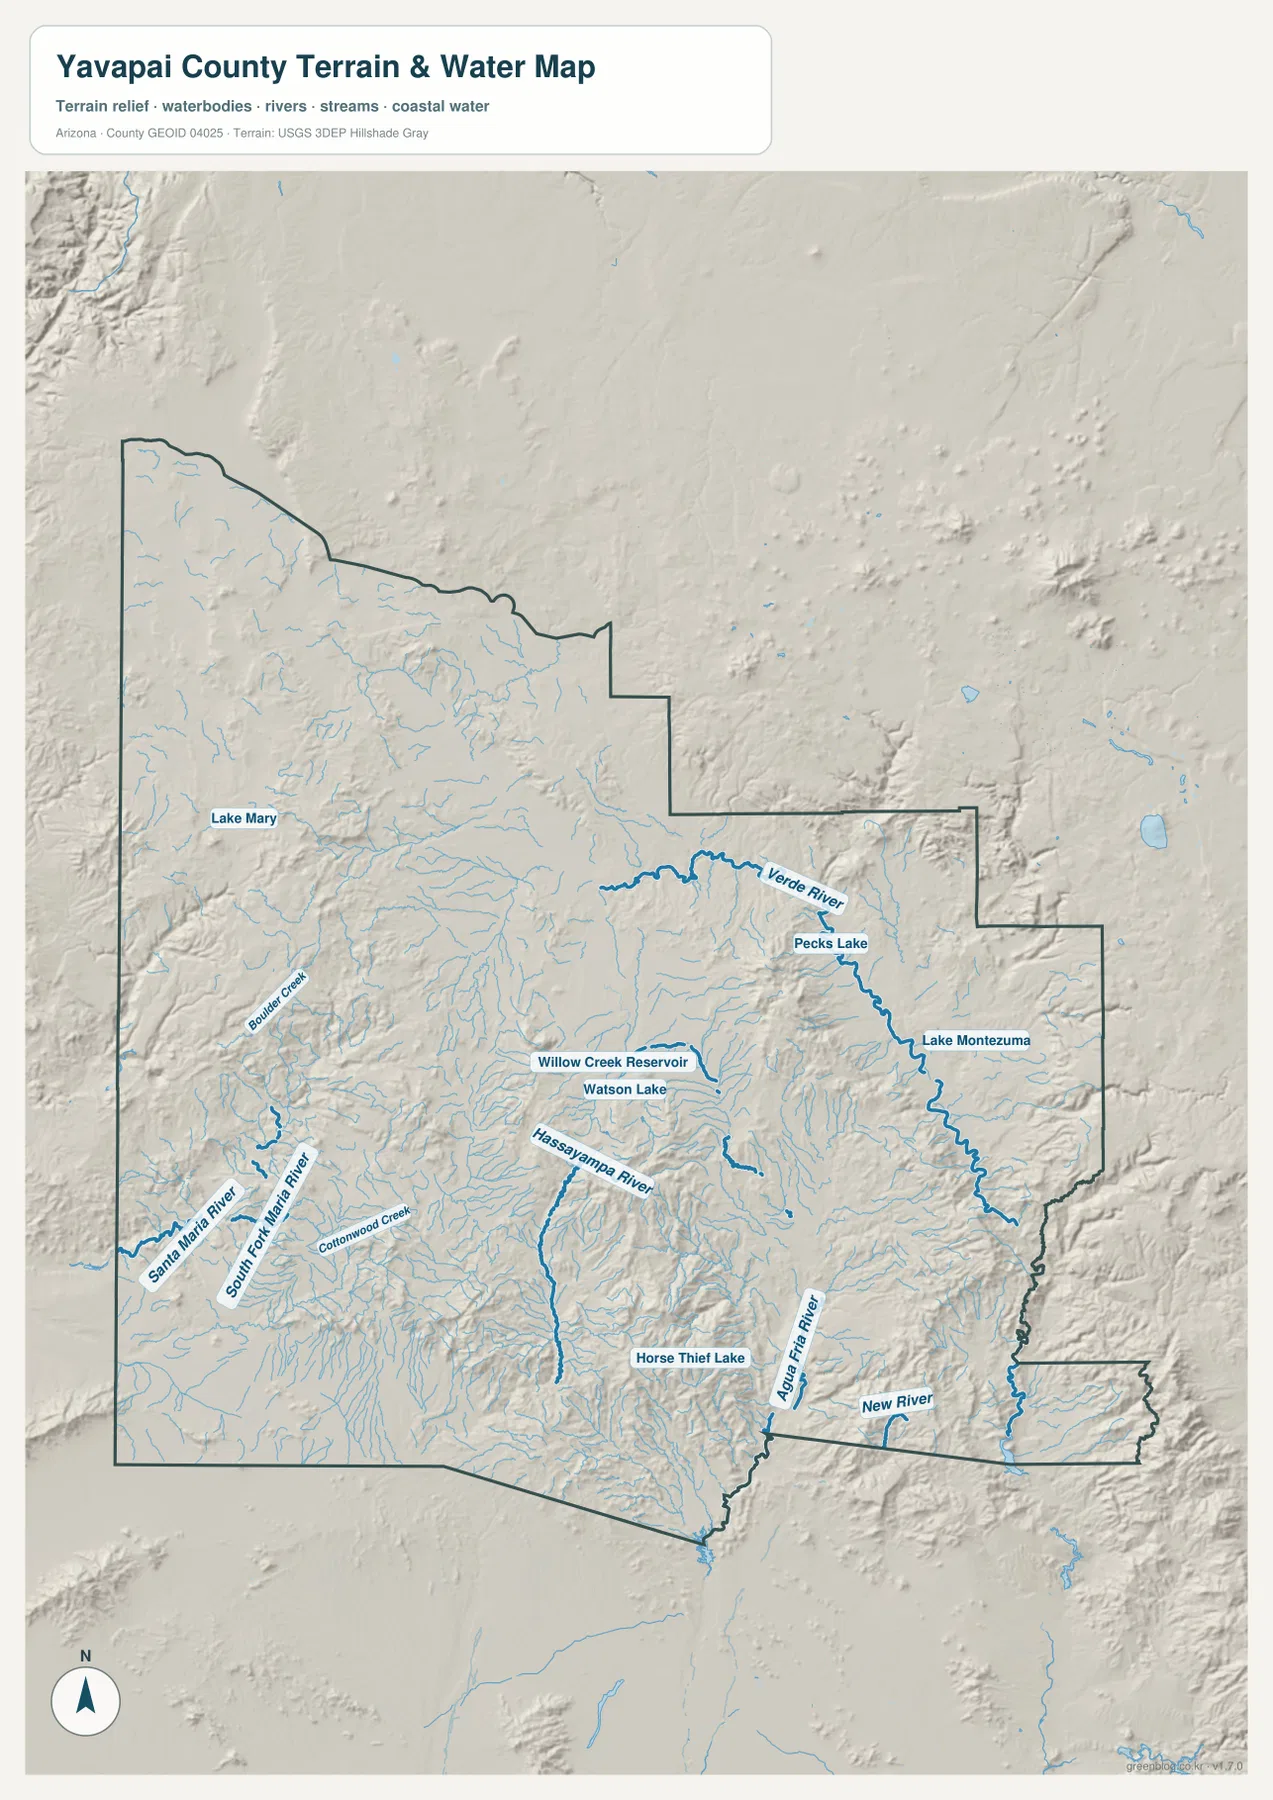
The blue lines are geographic water references, not measurements of current flow, depth, or flood probability. Reservoir and lake outlines also do not report present water levels. The map should not be used for flood planning, legal boundary work, or navigation on its own. Those tasks require current authoritative products from Yavapai County, USGS, or another agency responsible for the specific decision.
Nearly two kilometers of elevation range separate low valleys from high ground
The elevation legend reports an actual county range of about 432 to 2,398 meters, with a mean of 1,360 meters. Green marks lower terrain, while yellow, tan, and brown indicate progressively higher ground. Broad lower areas appear across the southwest and parts of the south. Lower corridors also follow the Verde Valley and portions of the Agua Fria drainage. In contrast, strong brown ridges and mountain blocks are widespread across the northwest and central interior.
Prescott sits in terrain where higher ridges and lower valleys are close together rather than on one broad flat plain. East toward Cottonwood and Camp Verde, the Verde Valley becomes a clearer lower zone before the terrain rises again around Sedona and the county’s eastern edge. Comparing the water and elevation maps makes the relationship easier to see: Verde River, Hassayampa River, and Agua Fria River generally occupy lower cuts between higher areas.
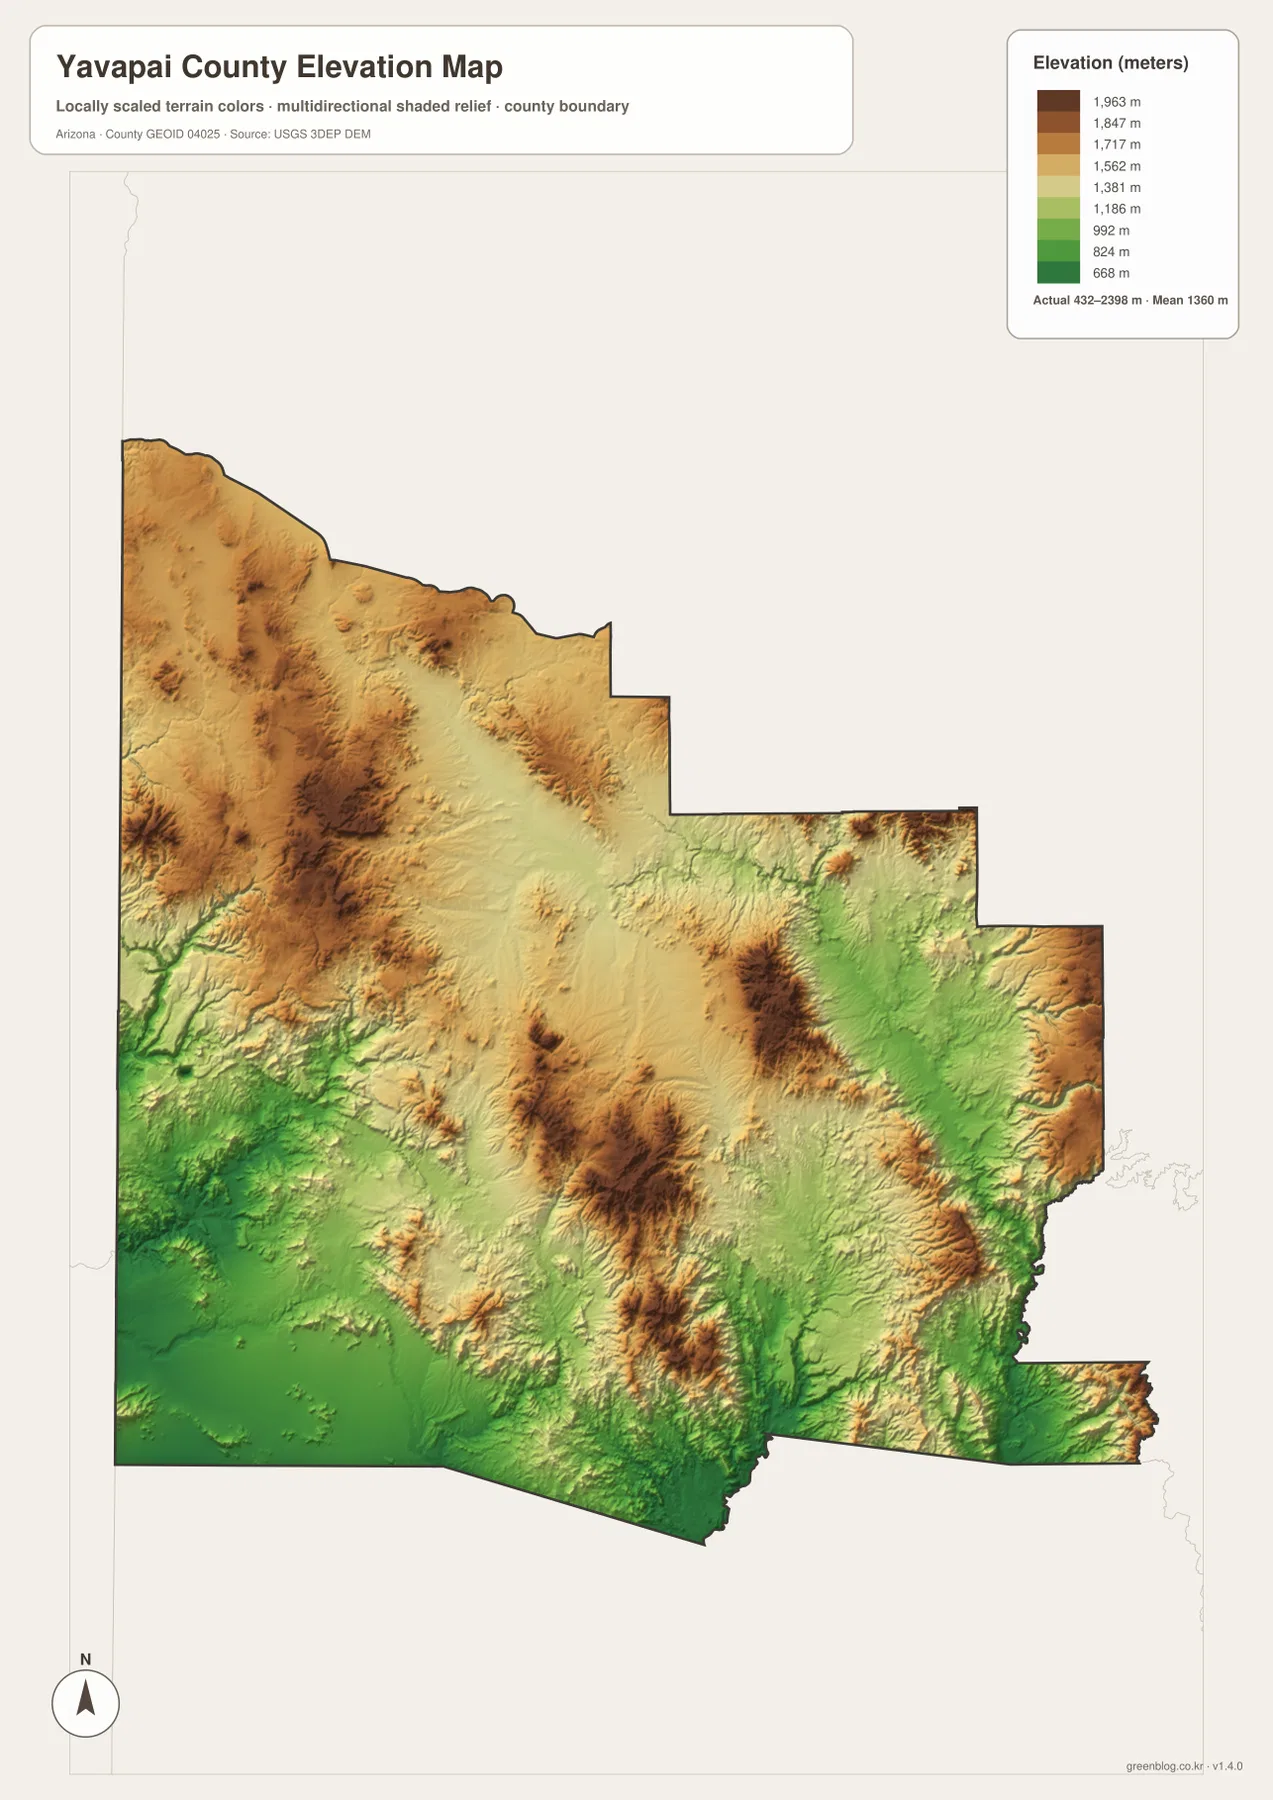
The elevation surface is suitable for countywide comparison, not survey-grade measurement. Actual elevation varies within a single color band, and small ridges or ravines can be generalized at this scale. The image is useful for understanding the large relief differences around Prescott and the Verde Valley. Construction, engineering, precise trail planning, or parcel-level elevation work should use original USGS elevation data or an appropriate professional survey.
Pick the map that keeps the information you need readable
The general county map is the best starting point for roads, the county outline, and a broad set of place names. The city view is cleaner when the main task is comparing Prescott Valley, Prescott, Chino Valley, Cottonwood, Camp Verde, and Sedona. For rivers, reservoirs, and drainage, the terrain-and-water map carries the useful labels, while the elevation view makes the large difference between valleys and mountain blocks much easier to see. Keeping those topics in separate images prevents the map from becoming crowded with unrelated labels.
The WebP images above are sized for quick use on the page. For printing, presentations, or closer reading of labels, download the high-resolution JPG versions from the ZIP below. The archive contains four separate files matching the county, city, terrain-and-water, and elevation views. When cropping or resizing a map for a document, keeping the county boundary, legend, and north arrow visible will help another reader understand the area being shown.
Reference maps and precision data serve different purposes
The supplied maps are county-scale references, so they do not show every local road, building, address, or parcel boundary. Numbers printed in the ranked city index belong to the supplied image and should not automatically be used as the latest population estimates. The water map does not report current streamflow or flood risk, and the elevation surface does not replace a survey. Property research, legal boundaries, building decisions, and hazard planning should always use the current authoritative data created for those tasks.
The official Yavapai County website provides current county services and links to GIS Mapping Applications, making it a useful companion when a location shown here leads to an administrative question. U.S. Census Bureau TIGER/Line files provide geographic boundary data, and USGS maintains national hydrography and elevation programs. This page has a narrower goal: help a visitor understand the supplied Yavapai County maps quickly and obtain the matching map files without confusing a general reference image with legal, engineering, or hazard data.
Frequently Asked Questions
Which map is best for comparing Prescott and Sedona?
Start with the general county map. Prescott is near the central part of the county, while Sedona is in the northeast, with Cottonwood and Route 89A helping show the relationship between them. The ranked city map gives a cleaner position comparison but removes most road detail.
Can I see Verde River and Watson Lake on the same map?
Yes. The terrain-and-water map shows Verde River in the eastern part of the county and Watson Lake near Prescott, along with Willow Creek Reservoir and several other named rivers and creeks. It is a geographic reference and does not report current water levels or flood risk.
Is the 432–2,398 meter range accurate enough for a specific site?
No. The range is useful for comparing broad high and low areas across Yavapai County. A specific parcel, structure, road, or engineering site requires original elevation data or survey-grade measurements appropriate to that location.
Map File Information
Download the high-resolution Yavapai County JPG files in one ZIP. The county, city, terrain-and-water, and elevation maps are stored as separate files.
- Included Files: county map, city map, terrain-and-water map, elevation map
- File Type: ZIP containing 4 high-resolution JPG files
Related Maps
Sources and reference data
- Official Yavapai County website – county services and GIS mapping information.
- U.S. Census Bureau TIGER/Line Shapefiles – county boundaries and geographic data.
- USGS National Hydrography – river, stream, and hydrographic reference data.
- USGS 3D Elevation Program – elevation data and 3DEP program information.
Green Map creates custom-edited map images using open geographic data sources such as geoBoundaries, Natural Earth, OpenStreetMap, and government open data.
These maps are edited visual materials, not raw data files, and are provided for education, documents, presentations, and graphic reference.