Washington State has a strong west-side population concentration, but the map set also reveals several important regional hubs east and south of Puget Sound. Seattle, Bellevue, Kent, Renton, Tacoma, Everett, and Marysville form a long connected settlement system around Puget Sound. Vancouver creates a separate southwestern cluster across the Columbia River from Portland, while Spokane anchors eastern Washington. Yakima and the Tri-Cities stand out in south-central Washington, and Bellingham forms a northern coastal center.
The supplied 2024 ACS 5-year estimates place Washington’s population at 7,816,116. The county-density map reports about 66,455 square miles of land and a statewide average near 118 people per square mile. That average hides a major internal range. King County averages more than 1,080 people per square mile, while Garfield and Ferry counties are close to three. The current population leader and the fastest-growing county during the 2010s are also different, so total population, density, tract-level settlement, and historical change need to remain separate measures.
Table of Contents
Seattle–Tacoma–Everett forms the state’s broadest tract-level density corridor
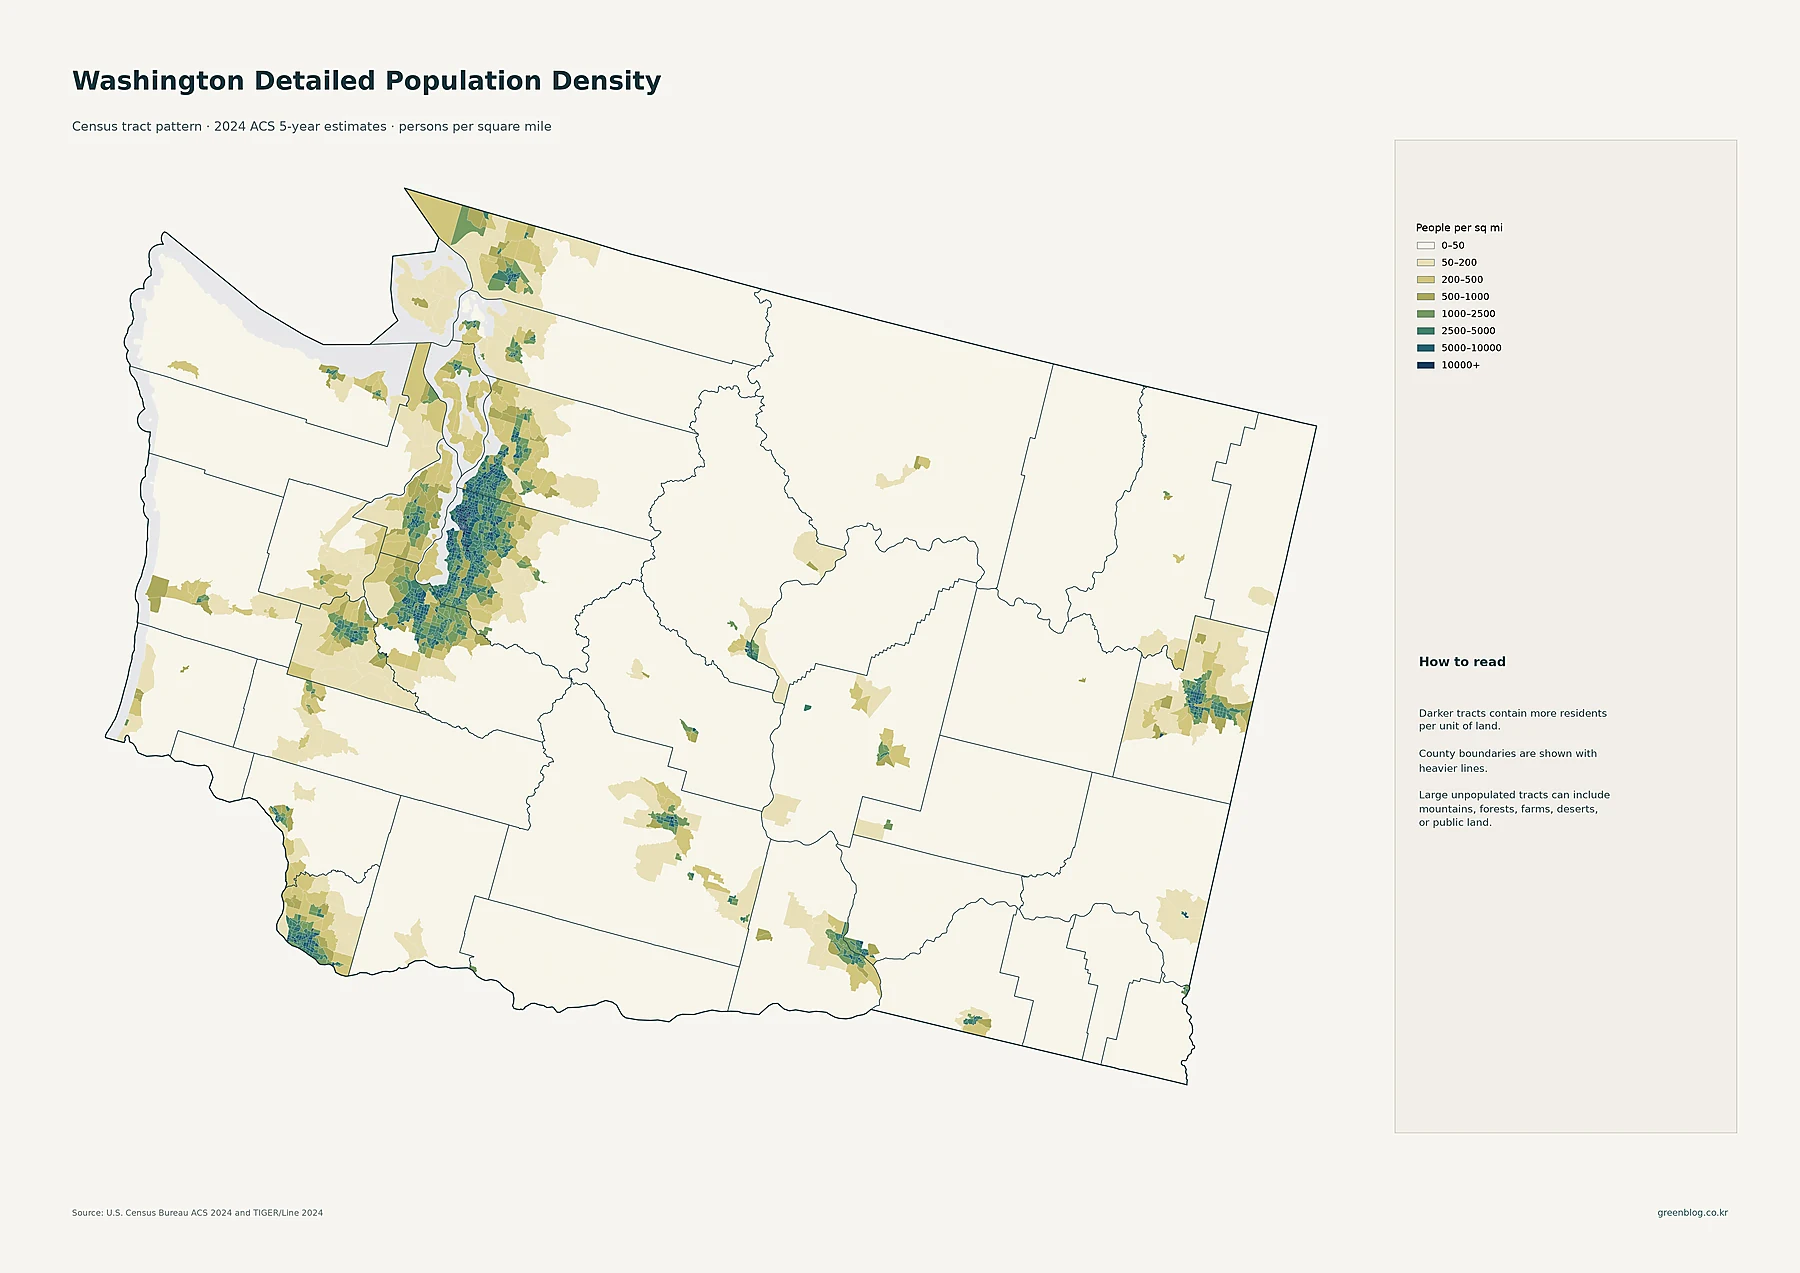
The largest continuous concentration of dark tracts sits around Puget Sound. Seattle is surrounded by dense settlement in King County, with higher-density tracts extending east toward Bellevue, Redmond, and Kirkland and south through Renton, Kent, and Auburn. The pattern continues into Pierce County around Tacoma and South Hill and extends north into Snohomish County around Everett and Marysville.
This corridor crosses several county and city boundaries, making it more useful to think of it as a broad metropolitan settlement system than as a single-city pattern. Kitsap County contains another concentration around the Bremerton area, and Island County has denser settlement along parts of Whidbey Island. Bellingham forms a recognizable cluster in Whatcom County farther north.
Eastern Washington is much more lightly populated overall, but Spokane and Spokane Valley create a major cluster near the Idaho border. Yakima forms another concentration in south-central Washington. The Tri-Cities area around Kennewick, Pasco, and Richland is clearly visible in Benton and Franklin counties. Large parts of the Cascade interior, northern mountains, and eastern rural counties remain in the 0–50 people-per-square-mile class.
Seattle is the largest census place, while Spokane, Tacoma, and Vancouver anchor other regions
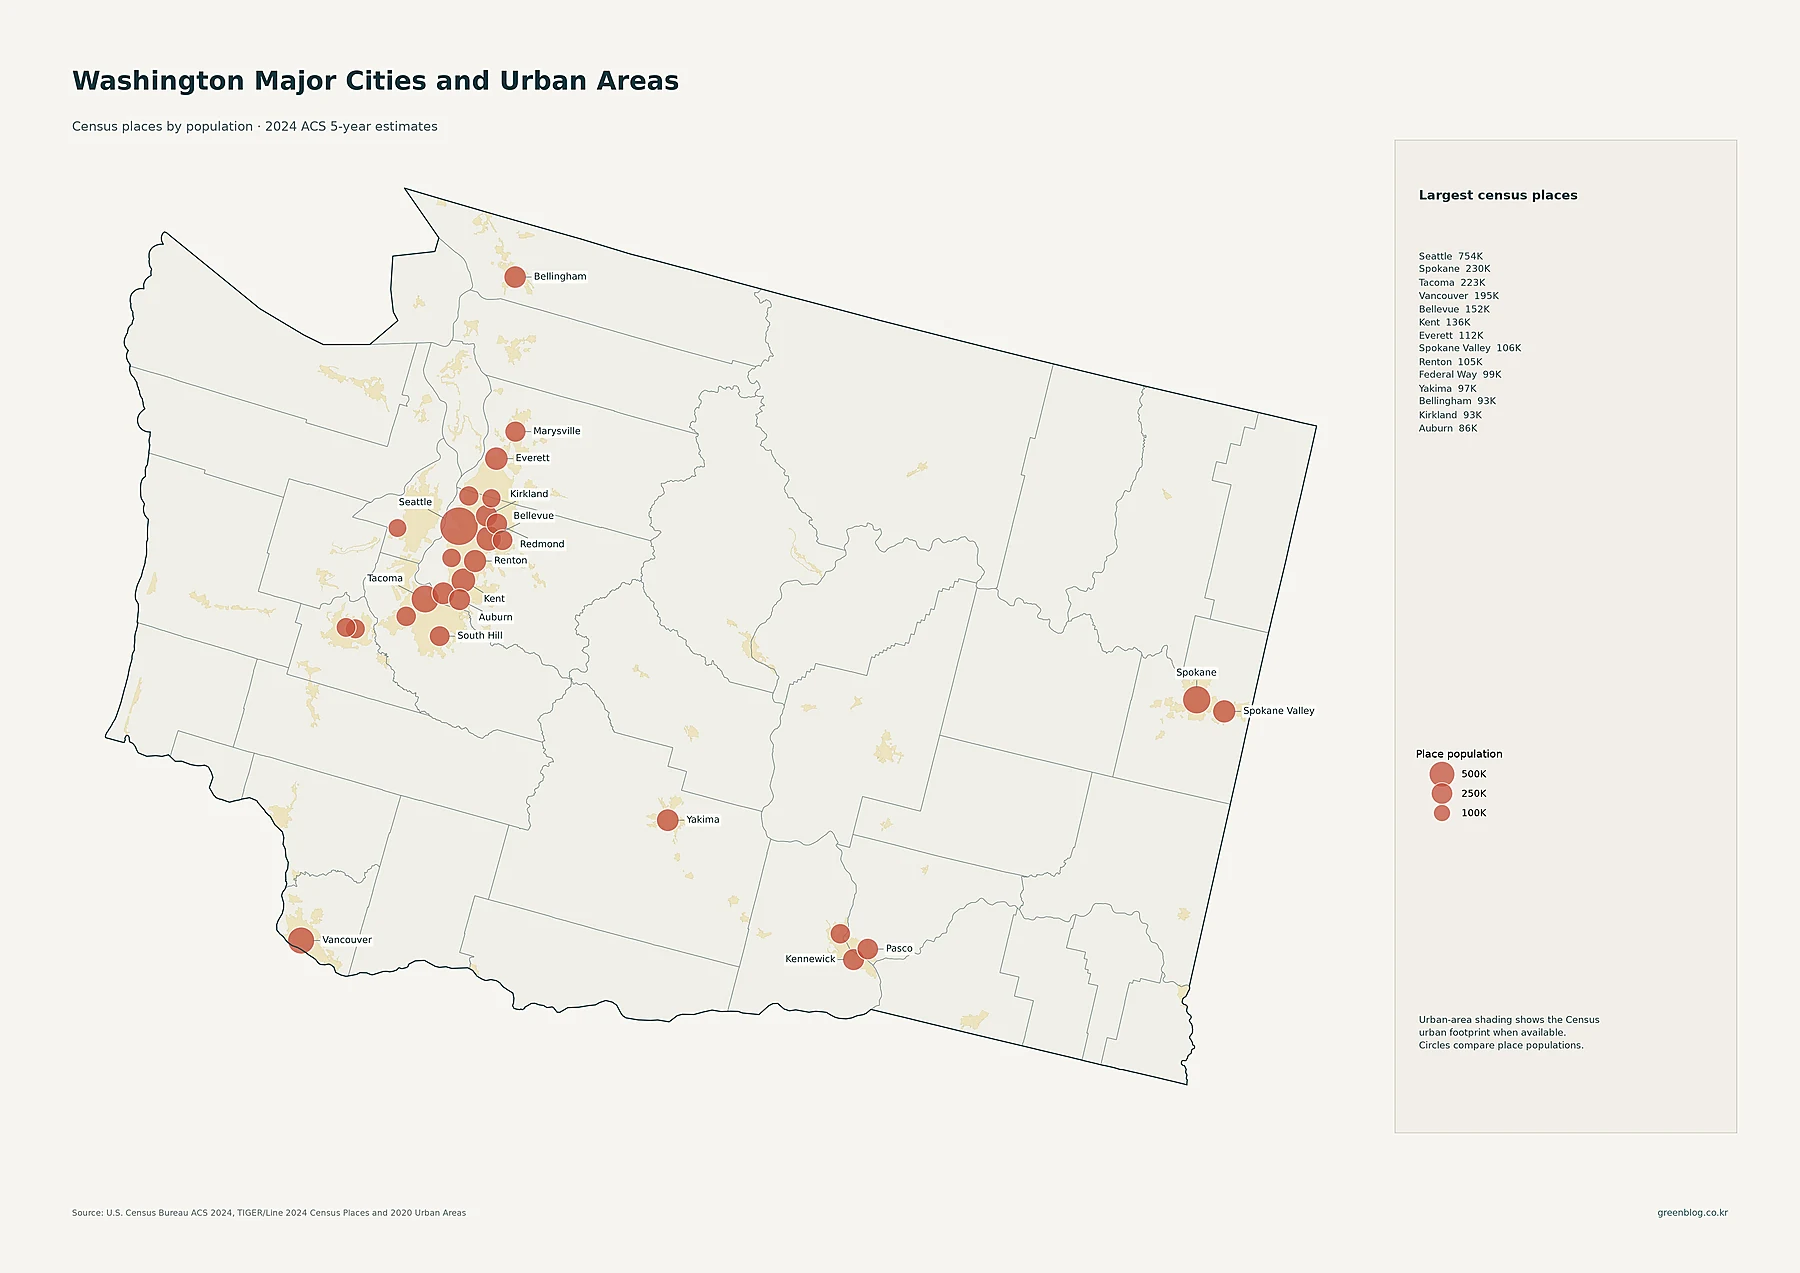
Seattle has 754,195 residents in the supplied census-place data, making it the largest place in the state. Spokane follows with 230,293, Tacoma with 222,758, and Vancouver with 195,300. Bellevue has 151,847 residents, Kent 135,603, Everett 111,845, Spokane Valley 106,365, and Renton 105,317.
Federal Way has 99,493 residents, Yakima 96,961, Bellingham 93,438, and Kirkland 92,621. Auburn has 85,676, Kennewick 85,295, Pasco 79,575, Redmond 77,353, Marysville 73,002, South Hill 68,025, and Sammamish 66,463. The large number of sizable places around Seattle and Tacoma reinforces the tract map’s picture of a broad Puget Sound urban system.
The proportional circles represent total place population, not density. Seattle’s large symbol means it has the largest census-place population. It does not provide a direct people-per-square-mile ranking. Spokane and Vancouver are useful examples of separate regional hubs that have large place populations even though they sit outside the Puget Sound core.
King County has more than 2.28 million residents, far ahead of every other county
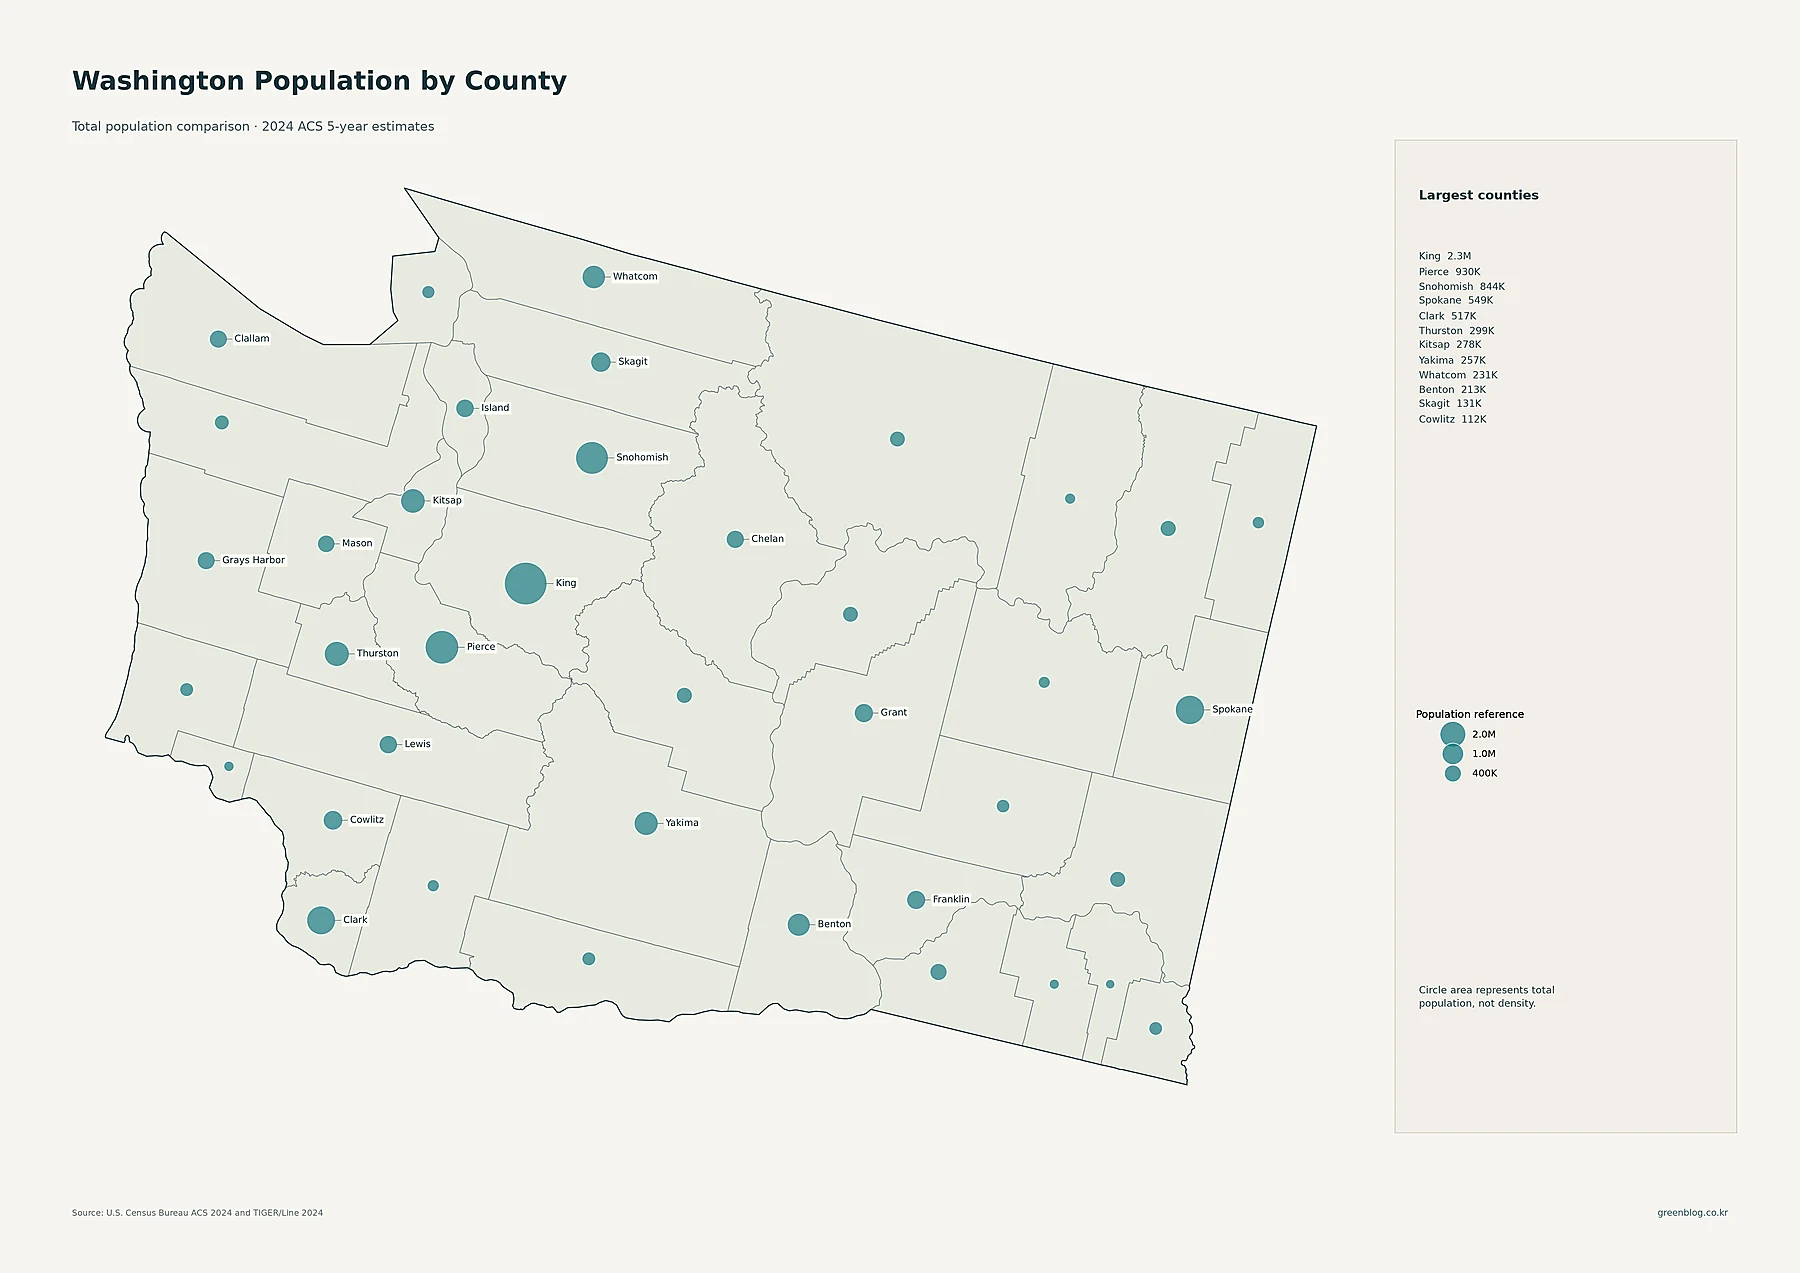
King County has 2,287,171 residents, the largest current county population in Washington. Pierce County is second with 930,319 and Snohomish County has 844,430. Spokane County has 549,056 residents, Clark 516,959, Thurston 299,067, Kitsap 277,881, Yakima 257,152, Whatcom 230,503, and Benton 212,905.
The largest circles reinforce the geographic importance of Puget Sound. King, Pierce, and Snohomish dominate the western metropolitan core. Clark County stands out in the southwest around Vancouver, and Spokane County dominates the eastern side of the state. Yakima, Benton, and Franklin represent major south-central population centers.
At the other end, Garfield County has 2,353 residents, Columbia 4,014, Wahkiakum 4,658, and Ferry 7,387. Washington therefore contains both a county with more than two million people and several counties with only a few thousand. County totals show the scale of population inside boundaries, but density requires land area to be included.
King leads county density, while Clark and Kitsap rank unusually high outside the Seattle core
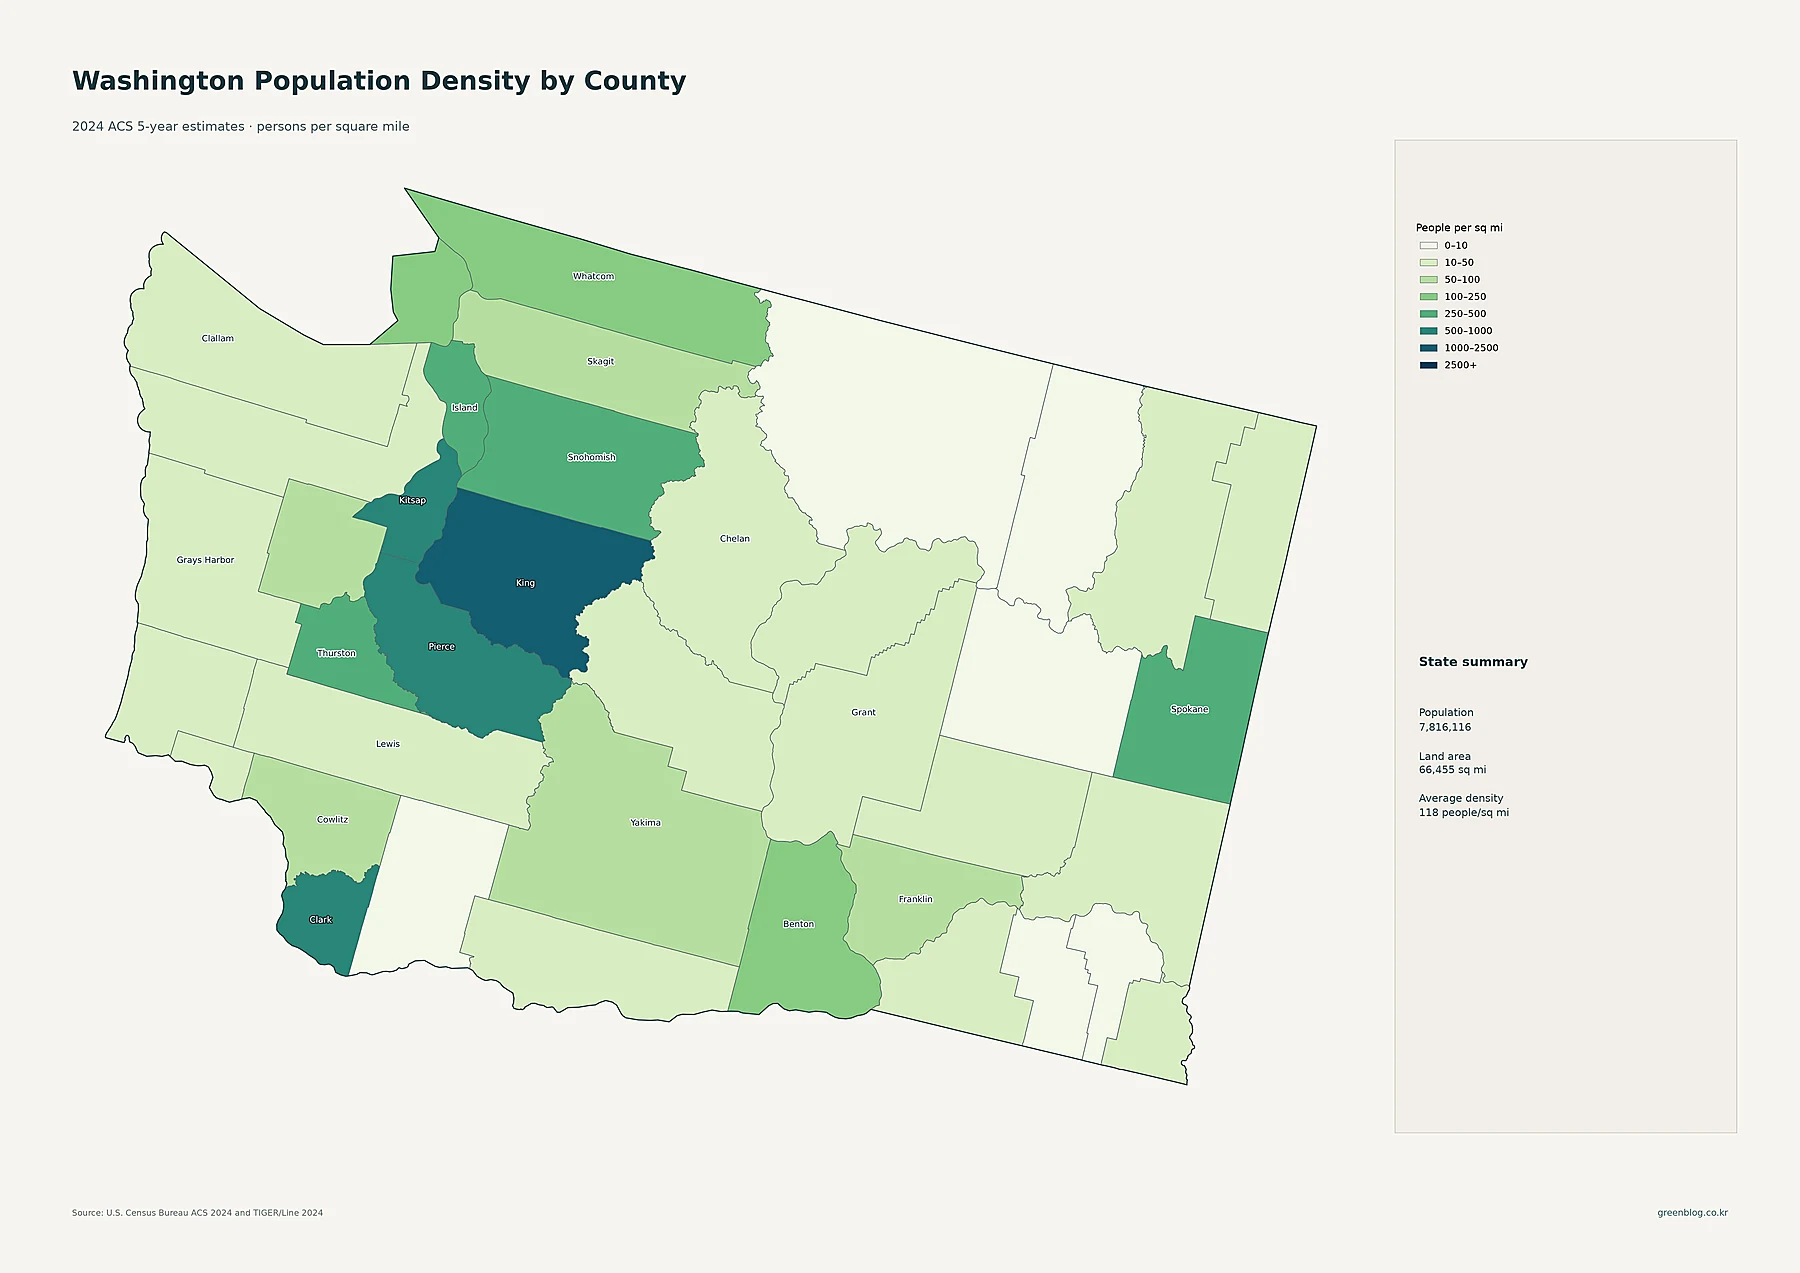
King County has the highest county-average density at about 1,081.0 people per square mile. Clark County is second at about 822.5, followed by Kitsap at 703.3 and Pierce at 557.7. Island County averages about 416.5, Thurston 413.9, Snohomish 404.7, and Spokane 311.2 people per square mile.
Benton County averages about 125.2 people per square mile, Whatcom 109.3, San Juan 106.2, and Cowlitz 98.5. The sparsest county averages are dramatically lower: Garfield is about 3.31, Ferry 3.35, Columbia 4.62, and Lincoln 4.97 people per square mile. Washington’s statewide average of roughly 118 therefore compresses a very large west-east and metropolitan-rural contrast.
Clark County is especially instructive because it ranks fifth in total county population but second in density. Vancouver and surrounding settlement occupy a relatively compact part of the county. By contrast, large inland counties can contain substantial towns while still having low countywide density because much of their land remains sparsely populated.
| Measure | Leading area | Value in supplied data |
|---|---|---|
| State population | Washington | 7,816,116 |
| Largest place population | Seattle | 754,195 |
| Largest county population | King County | 2,287,171 |
| Highest county density | King County | about 1,081.0/sq mi |
| Fastest 2010–2020 growth | Franklin County | +23.8% |
| Largest 2010–2020 decline | Ferry County | -4.9% |
Franklin County led 2010–2020 growth, with strong gains around Vancouver and Puget Sound
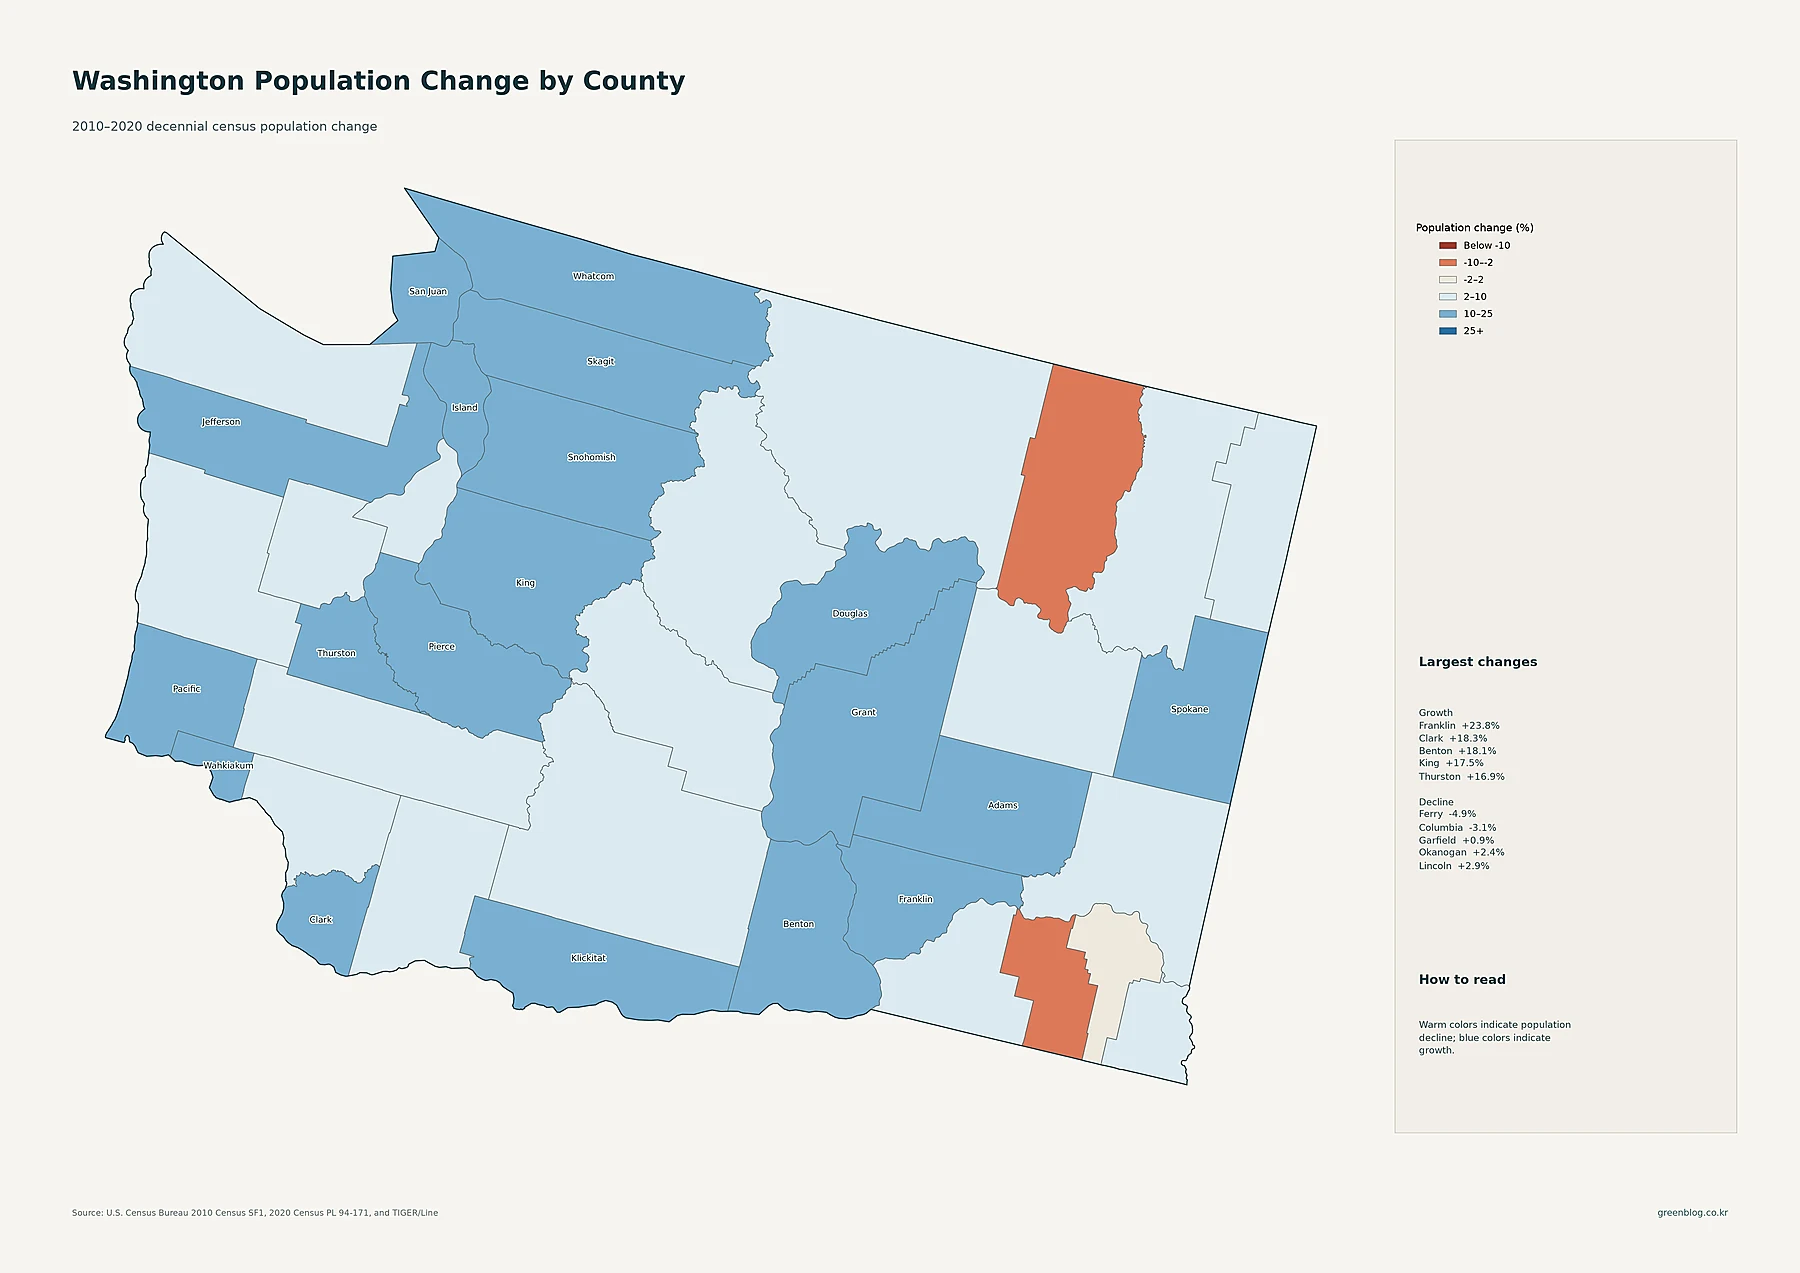
Franklin County recorded the fastest percentage increase in the supplied decade data. Its population rose from 78,163 in 2010 to 96,749 in 2020, a gain of about 23.8%. Clark County grew 18.3%, Benton 18.1%, King 17.5%, Thurston 16.9%, Snohomish 16.1%, Pierce 15.8%, and Spokane 14.5%.
The geography of growth is broader than the Seattle metro alone. Franklin and Benton stand out around the Tri-Cities. Clark grew strongly around Vancouver. Puget Sound counties including King, Pierce, Snohomish, and Thurston all posted double-digit gains. Whatcom and San Juan each grew about 12.8%, and Grant County increased 11.2%.
Only a small number of counties declined. Ferry County fell from 7,551 residents in 2010 to 7,178 in 2020, a decrease of about 4.9%. Columbia County declined about 3.1%. Garfield grew only 0.9%, Okanogan 2.4%, and Lincoln 2.9%. The change map therefore shows broad statewide growth with a few exceptions in the northeast and southeast.
These percentages belong specifically to the 2010–2020 decennial-census period. They should not be described as changes in the 2024 ACS estimate. King County remains the current population and density leader, but Franklin County grew faster in percentage terms during the 2010s.
Washington combines a dominant Puget Sound core with several independent growth centers
The five maps make Puget Sound the clearest current population core. Seattle is the largest census place, and King County leads both county population and county-average density. Pierce, Snohomish, Kitsap, and Thurston extend the western concentration, while Bellingham adds another northern coastal hub. Vancouver and Spokane anchor opposite corners of the state outside that main system.
The historical map adds a second layer. Franklin and Benton grew rapidly around the Tri-Cities, Clark expanded strongly around Vancouver, and the major Puget Sound counties also posted large gains. Ferry and Columbia moved in the opposite direction. Keeping place totals, county totals, county density, tract-level density, and historical population change separate gives the clearest view of where Washington residents live and how those patterns shifted during the 2010s.
Download the Washington population map collection
The ZIP includes detailed census-tract density, major cities and urban areas, county population totals, 2010–2020 county population change, and county population density.
FAQ
Which Washington county has the largest population?
King County is the largest in the supplied 2024 ACS 5-year estimates, with 2,287,171 residents. Pierce County has 930,319 and Snohomish County 844,430.
Which Washington county has the highest population density?
King County has the highest county-average density at about 1,081.0 people per square mile. Clark County is about 822.5 and Kitsap County about 703.3 people per square mile.
Which Washington county grew fastest from 2010 to 2020?
Franklin County grew about 23.8%, followed by Clark at 18.3%, Benton at 18.1%, and King at 17.5%. These percentages compare the 2010 and 2020 decennial censuses.
Related Maps
Sources
- U.S. Census Bureau — American Community Survey (ACS): 2024 5-year population and density estimates
- U.S. Census Bureau — TIGER/Line Shapefiles: 2024 state, county, census tract, and census place boundaries
- U.S. Census Bureau — Decennial Census: 2010 and 2020 county population comparison
Green Map creates custom-edited map images using open geographic data sources such as geoBoundaries, Natural Earth, OpenStreetMap, and government open data. These maps are edited visual materials, not raw data files, and are provided for education, documents, presentations, and graphic reference.