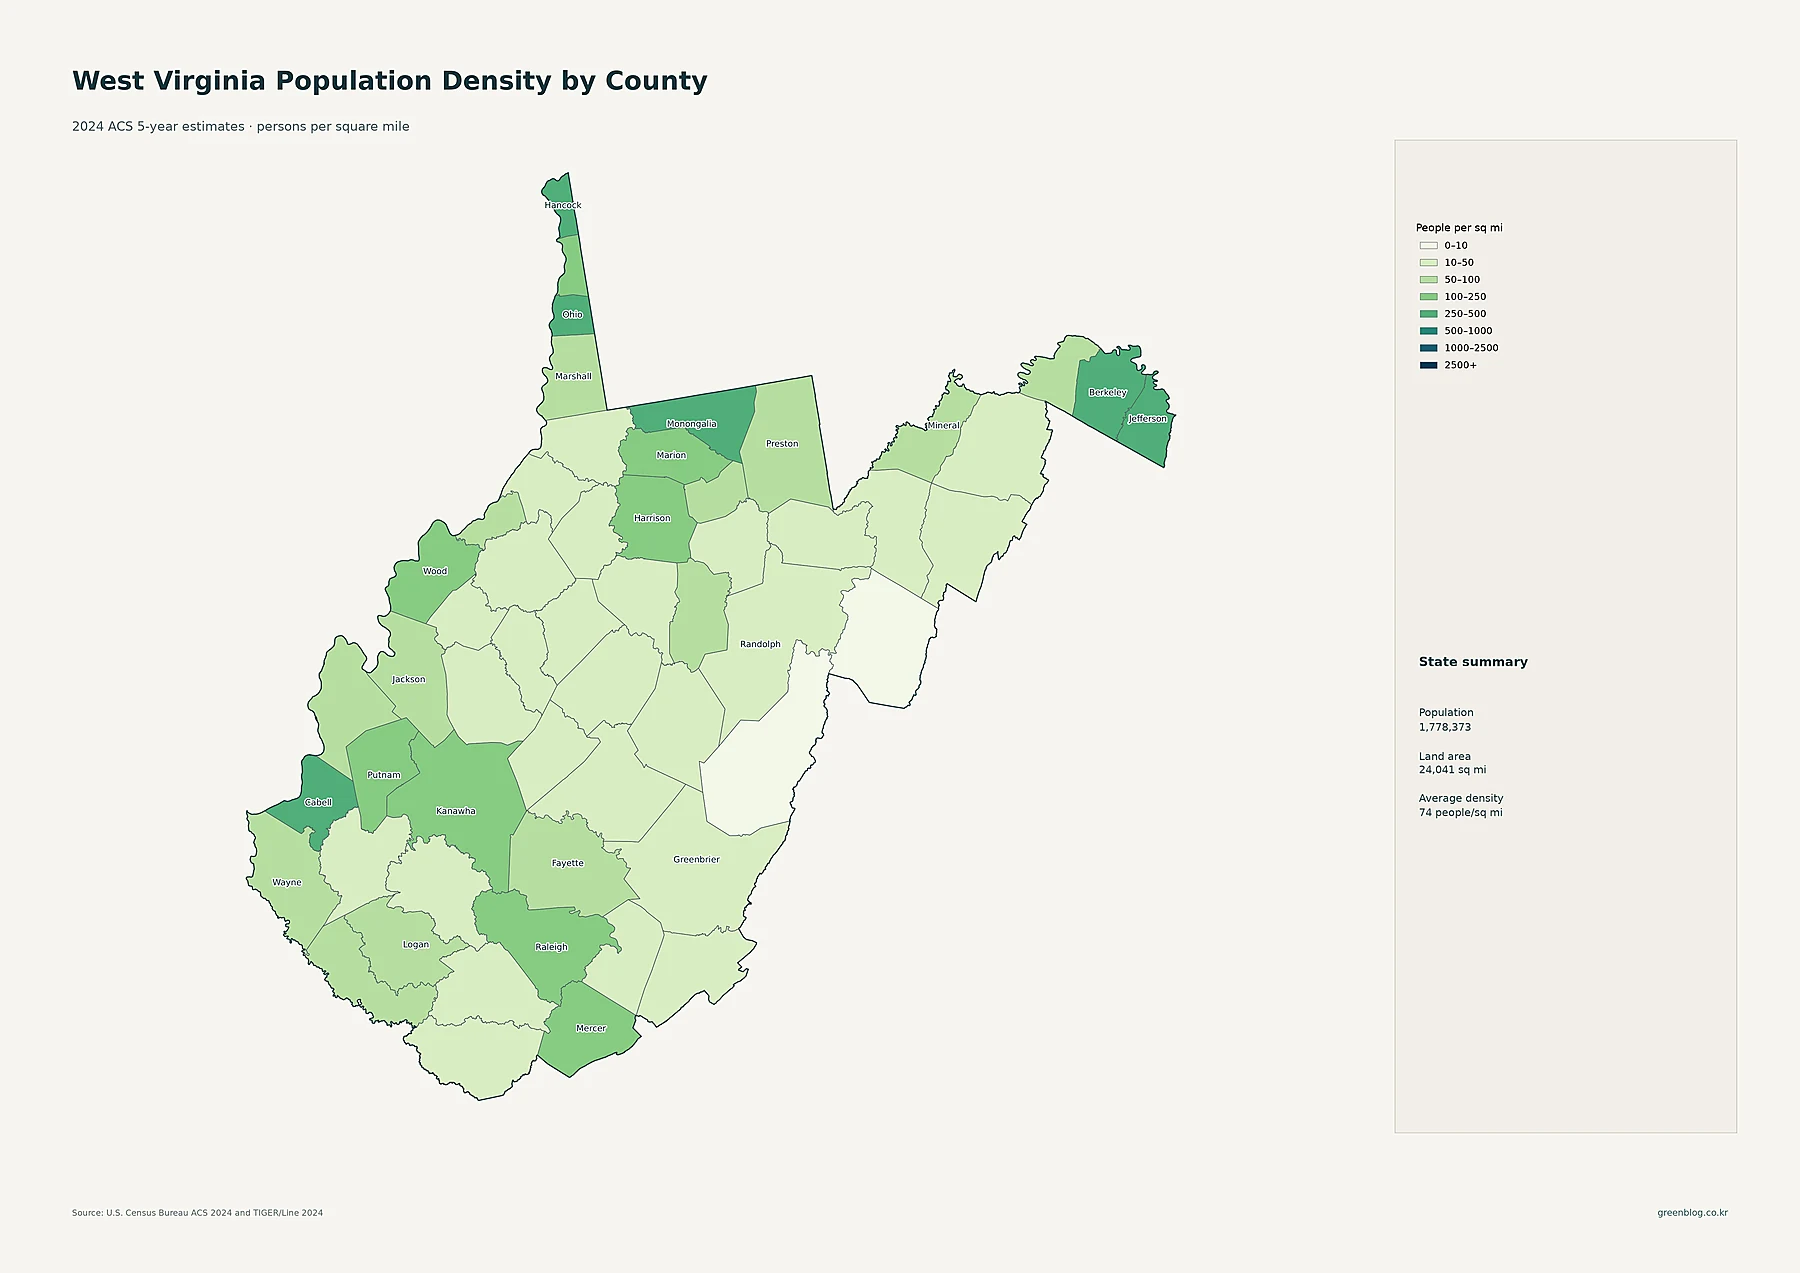
West Virginia looks broadly sparse when reduced to a statewide average, but the detailed maps tell a much more uneven story. The 2024 ACS 5-year estimates in this map set put the state population at 1,778,373. The county-density map reports 24,041 square miles of land and an average density of about 74 people per square mile. That average hides a wide county range: Berkeley County is a little above 403 people per square mile, while Pocahontas and Pendleton are both below 9.
The five maps are designed to answer different questions. The census-tract map shows where density rises within county boundaries. The cities map compares the population of Census places and overlays urban-area shading. The county population map compares total residents, while the county density map adjusts population for land area. Finally, the 2010–2020 change map shows where county populations grew or declined between the two decennial censuses. Reading them together avoids a common mistake: treating population size, density, and growth as interchangeable measures.
Table of Contents
Detailed density reveals clusters that county averages hide
The most detailed map uses 2024 ACS 5-year estimates at the census-tract level. Its legend ranges from 0–50 people per square mile through 10,000 or more. Darker tracts indicate more residents per unit of land, and heavier outlines mark county boundaries. This makes it possible to see a dense pocket inside a county that would otherwise appear only as a single countywide average.
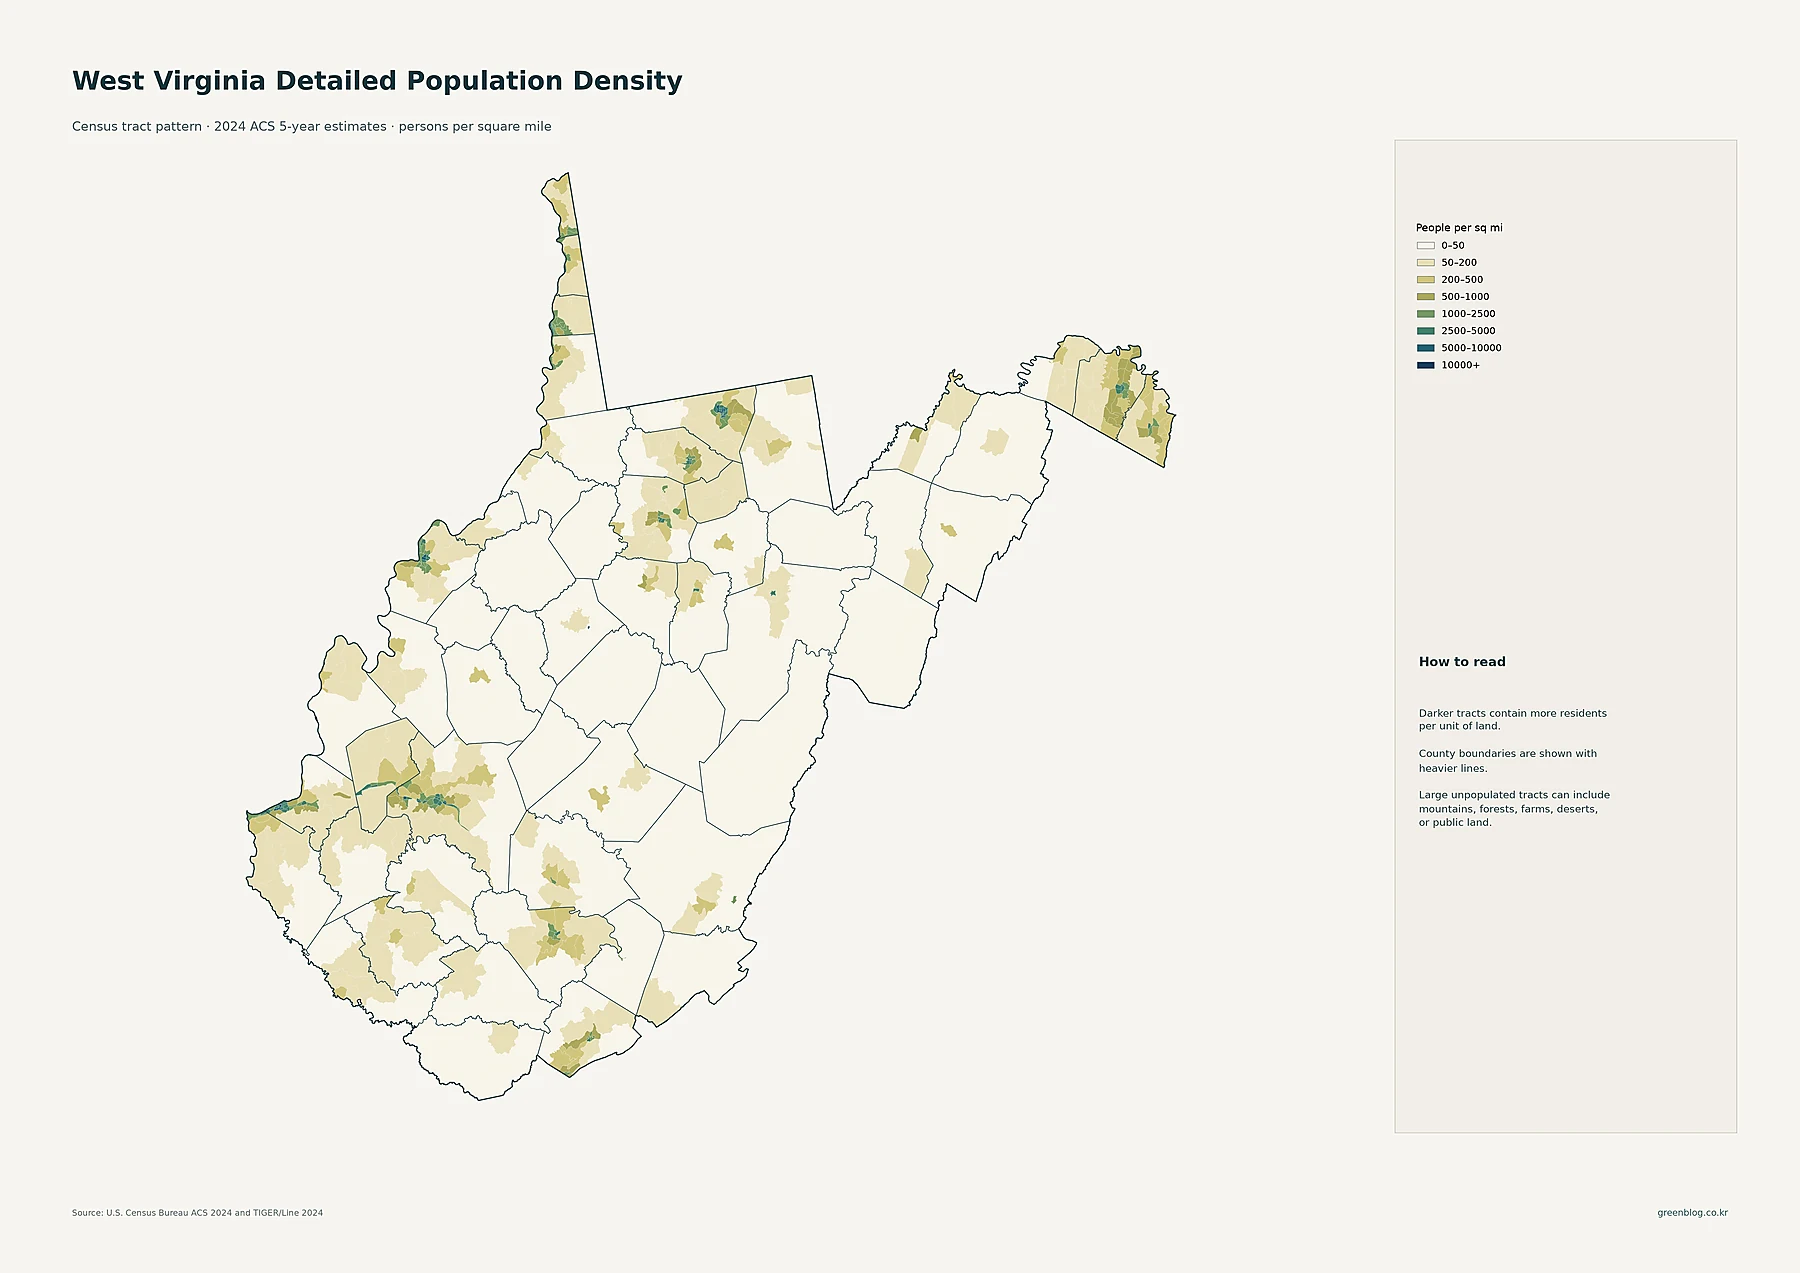
The strongest concentrations appear around several separate population centers rather than in one continuous metro area. The Charleston–Huntington part of the southwest contains multiple darker tracts. Other clusters are visible around Morgantown in the north-central part of the state, Parkersburg along the western edge, Wheeling and Weirton in the Northern Panhandle, and Martinsburg in the Eastern Panhandle. Large sections of the central and eastern mountain counties remain very lightly shaded. The pattern also shows why a county label alone can be misleading: settlement can be concentrated in a small portion of a county while the surrounding land remains sparsely populated.
Major places form several distinct urban clusters
On the major-cities map, circle size represents the population of a Census place, not density. Charleston is the largest place in the supplied 2024 ACS file at 47,421 residents, closely followed by Huntington at 45,787. Morgantown has 30,236, Parkersburg 29,240, and Wheeling 26,350. The next group includes Martinsburg at 18,904, Weirton at 18,647, Fairmont at 18,221, Beckley at 16,818, and Clarksburg at 15,549.
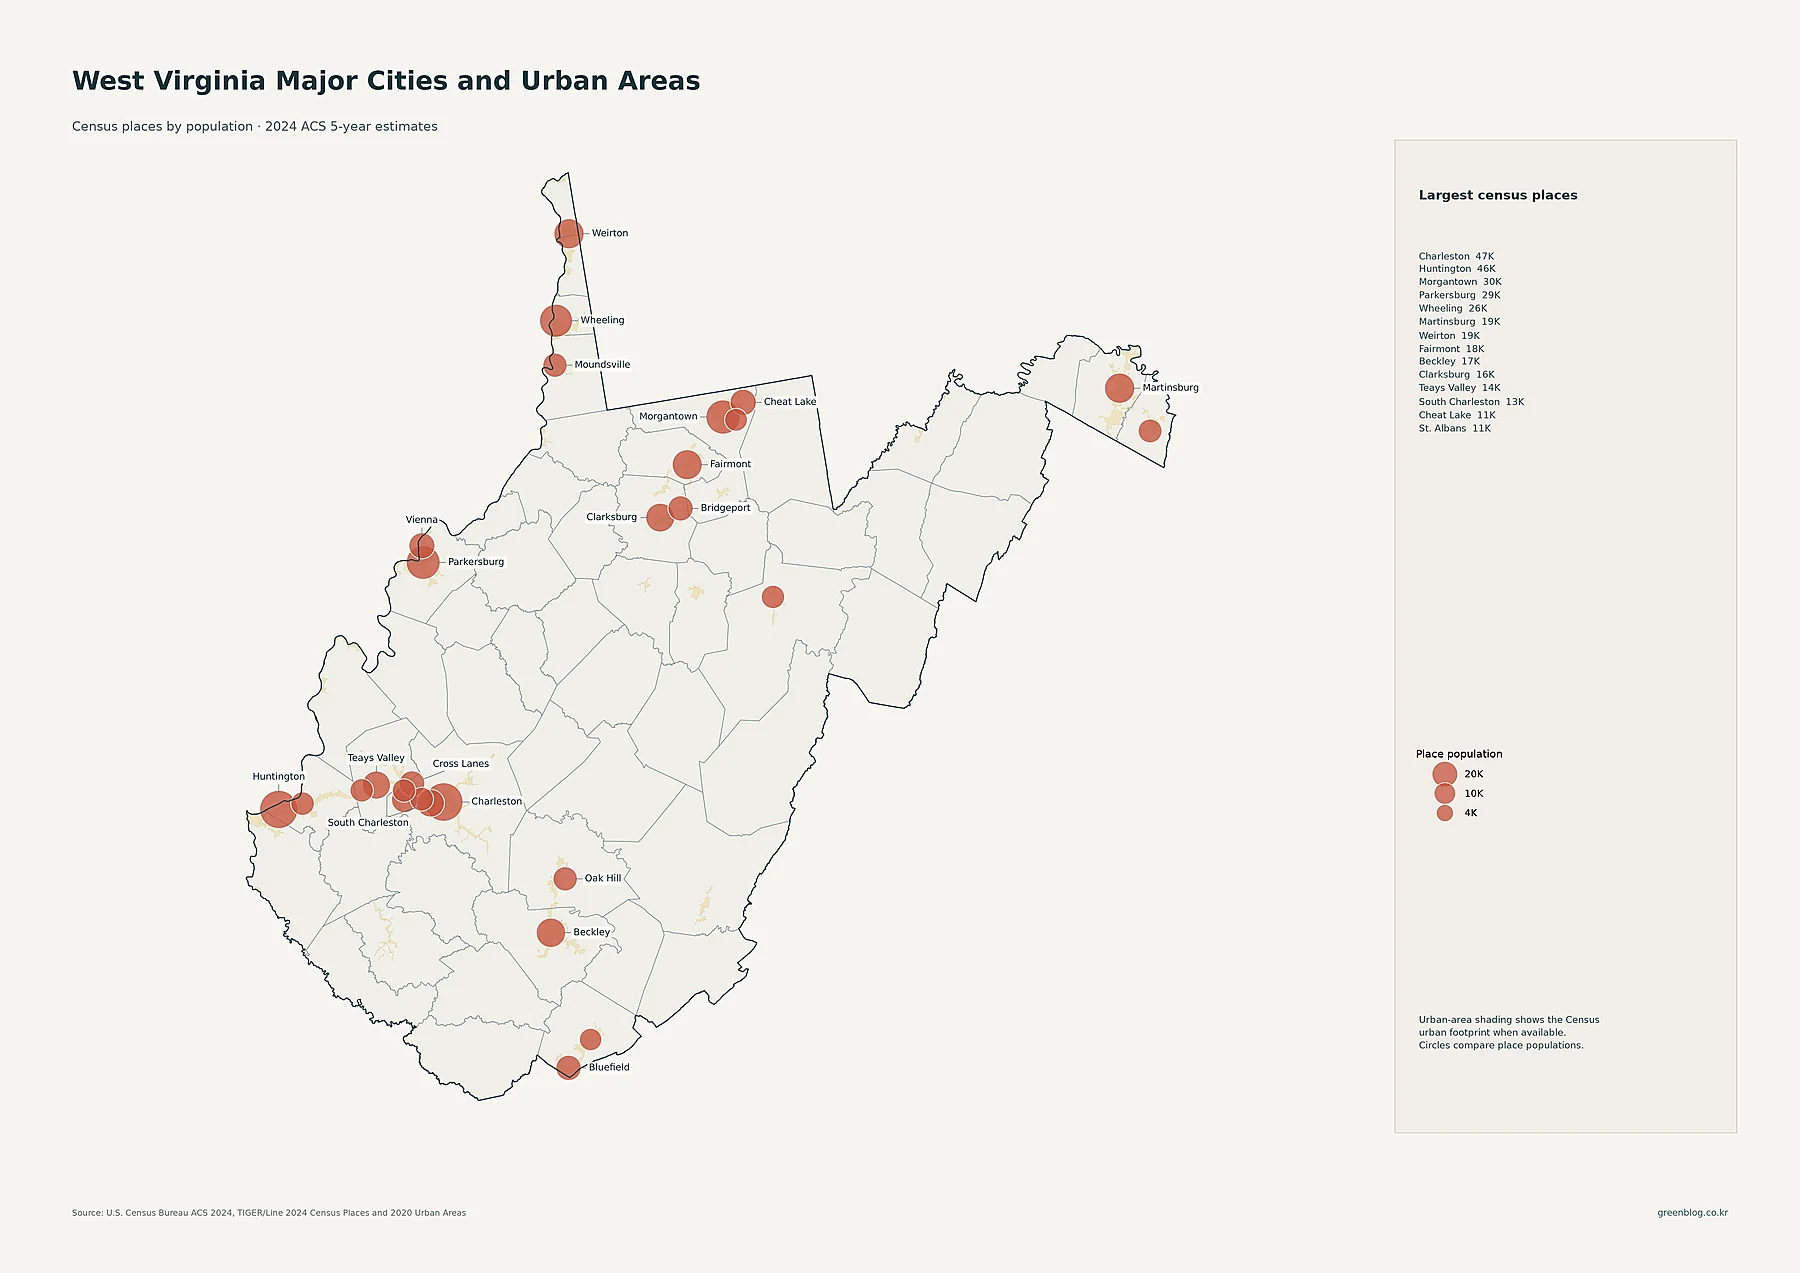
The map makes the state’s multi-center pattern easy to see. Charleston is surrounded by other sizable places such as South Charleston, Cross Lanes, St. Albans, and Teays Valley, while Huntington anchors another large circle near the western border. In north-central West Virginia, Morgantown, Cheat Lake, Fairmont, Clarksburg, and Bridgeport appear as a chain of populated places. Wheeling and Weirton stand out in the narrow Northern Panhandle. Martinsburg is the clearest large place in the Eastern Panhandle. These city locations line up with many of the darker areas on the tract-density map.
The biggest county is not the densest county
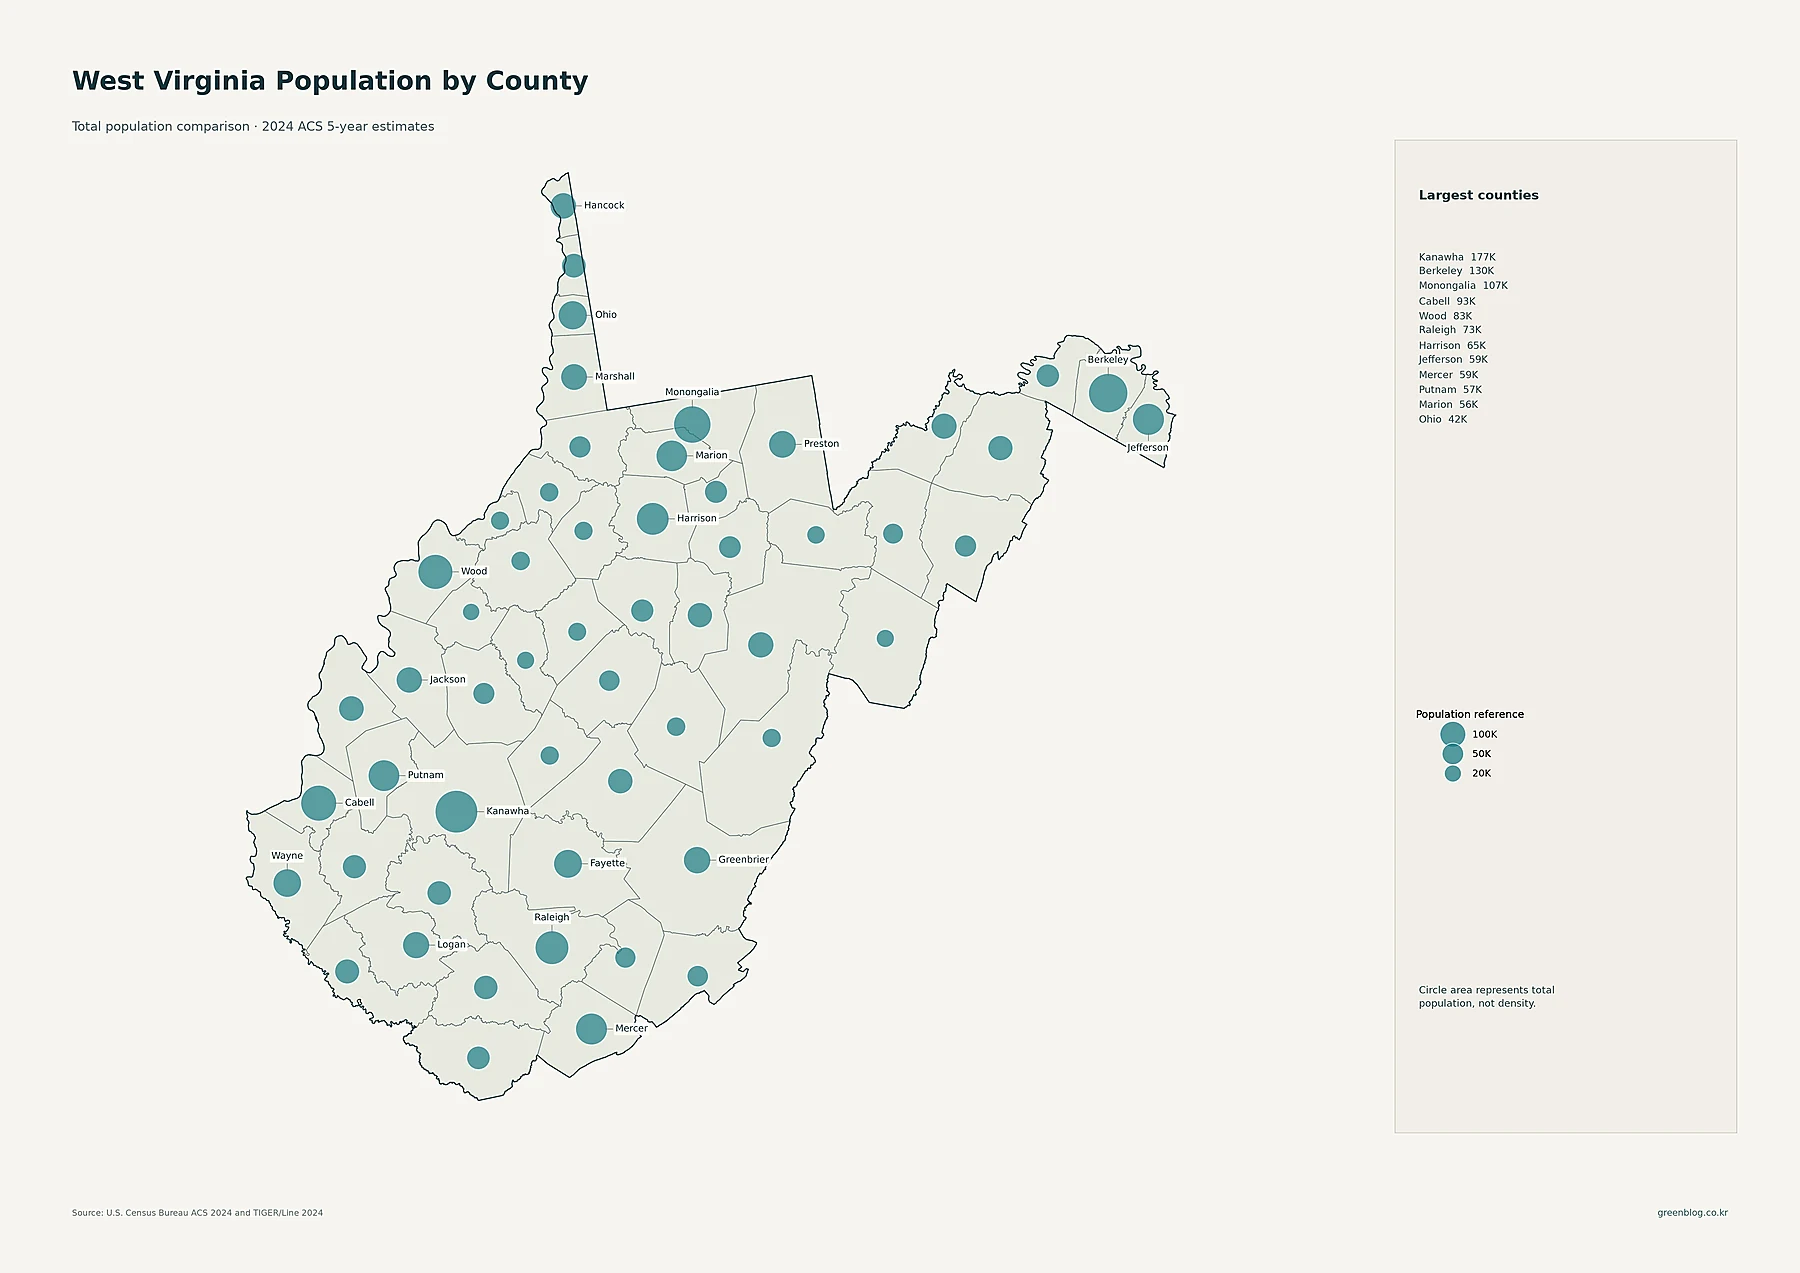
Kanawha County has the largest 2024 ACS population in the supplied county file, at 176,537. Berkeley follows with 129,514, Monongalia with 107,163, Cabell with 92,739, and Wood with 83,407. Raleigh has 73,195 residents, Harrison 64,984, Jefferson 59,260, Mercer 58,563, and Putnam 57,177. On the map, the proportional circles emphasize those differences in total population.
Density produces a different ranking because land area matters. Berkeley leads at about 403.3 people per square mile. Ohio County is close behind at 392.9, followed by Hancock at 344.2, Cabell at 330.0, Monongalia at 297.6, and Jefferson at 283.1. Wood is about 227.6 and Kanawha about 195.8. At the opposite end, Pocahontas is about 8.3 people per square mile and Pendleton about 8.7. Webster, Tucker, and Ritchie are also below 20. A county can therefore have a modest total population but a relatively high density if its land area is small, or a larger total population but a lower density if residents are spread across more land.
| County | 2024 ACS population | People/sq mi | 2010–2020 change |
|---|---|---|---|
| Kanawha | 176,537 | 195.8 | -6.4% |
| Berkeley | 129,514 | 403.3 | +17.2% |
| Monongalia | 107,163 | 297.6 | +10.0% |
| Cabell | 92,739 | 330.0 | -2.0% |
| Jefferson | 59,260 | 283.1 | +7.9% |
| Pendleton | 6,043 | 8.7 | -20.2% |
Growth from 2010 to 2020 was concentrated in a small set of counties
The population-change map switches to decennial census counts, comparing 2010 with 2020. Warm colors indicate decline and blue shades indicate growth. Much of West Virginia is shown in decline, while the most visible growth is concentrated in Berkeley and Jefferson in the Eastern Panhandle and Monongalia in north-central West Virginia.
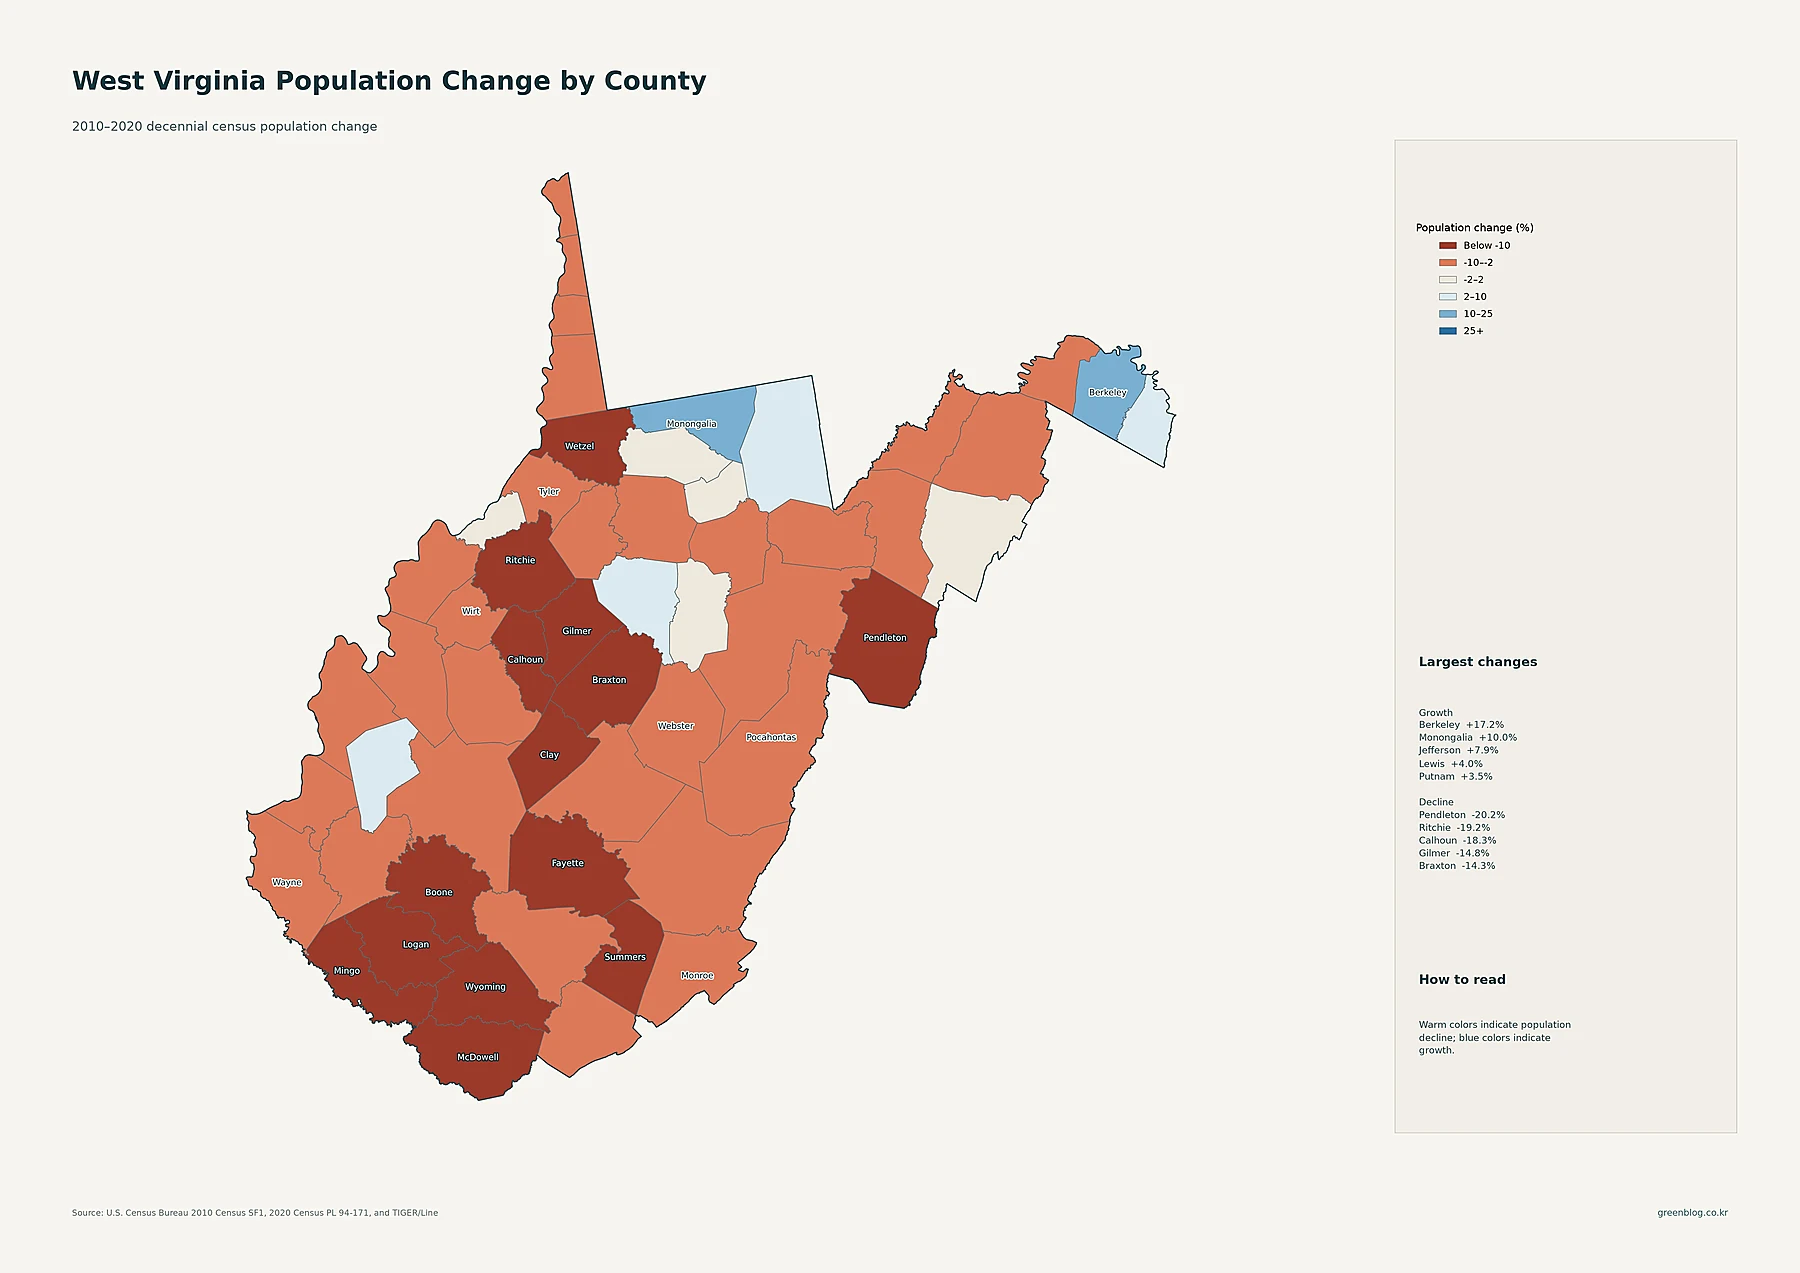
Berkeley recorded the strongest increase in the supplied data, rising from 104,169 people in 2010 to 122,076 in 2020, a gain of 17.2%. Monongalia increased 10.0%, Jefferson 7.9%, Lewis 4.0%, and Putnam 3.5%. Preston and Hardy also posted small gains. The other end of the scale is much steeper: Pendleton declined 20.2%, Ritchie 19.2%, Calhoun 18.3%, Gilmer 14.8%, Braxton 14.3%, Clay 14.2%, and Summers 14.1%. McDowell fell 13.6% and Mingo 12.2%.
The map does not by itself establish why any county grew or declined, so it is better used as a geographic comparison than as a causal explanation. What it does show clearly is that the counties with positive change were a minority. It also highlights an overlap between current concentration and past growth: Berkeley, Monongalia, and Jefferson are relatively dense in the 2024 ACS map and also gained population between 2010 and 2020. In contrast, several very sparse counties—including Pendleton, Ritchie, and Calhoun—experienced some of the largest proportional declines.
A practical way to read the West Virginia population maps
- Use the tract map for local concentration. It is the best view for seeing where settlement clusters inside a county.
- Use the circle maps for population size. A large circle means more residents, not more residents per square mile.
- Use the county density map for area-adjusted comparison. This is where compact counties such as Berkeley and Ohio rise in the ranking.
- Keep the dates separate. The distribution maps use 2024 ACS 5-year estimates; the change map compares the 2010 and 2020 decennial censuses.
Taken together, the maps show why a single statewide density number is not enough to describe West Virginia. The state contains several substantial population centers, from Charleston and Huntington to Morgantown, Parkersburg, Wheeling, and Martinsburg. It also contains broad low-density areas, especially across the central and eastern mountains. County totals add another layer: Kanawha remains the largest county by population, yet Berkeley is much denser and was the fastest-growing county in the 2010–2020 comparison. That combination of separate urban clusters, sparse interior counties, and uneven change is the main pattern readers should carry away from the map set.
Download the complete map set
The ZIP package combines the detailed census-tract density map, major cities and urban areas, county population, 2010–2020 county change, and county population density. Each map can also be opened from its image above.
Frequently asked questions
Which West Virginia county has the highest population density?
Berkeley County ranks highest in the supplied 2024 ACS data at about 403.3 people per square mile. Ohio County is next at about 392.9, followed by Hancock County at about 344.2.
Why is Kanawha the largest county by population but not the densest?
Total population counts residents, while density divides population by land area. Kanawha has the largest population in this dataset at 176,537, but its density is about 195.8 people per square mile. Smaller, more compact counties can have higher density with fewer total residents.
Can I compare the 2010–2020 change percentages directly with the 2024 ACS population?
They should not be treated as the same reference period. The change percentages compare the 2010 and 2020 decennial census counts. The current distribution and density maps use 2024 ACS 5-year estimates, which are survey-based estimates for a later period.
Related Maps
Sources
- U.S. Census Bureau — American Community Survey Data: source family for the 2024 ACS 5-year population estimates used in the current-distribution maps.
- U.S. Census Bureau — 2024 TIGER/Line Shapefiles: geographic boundaries used for counties, tracts, places, and related map layers.
- U.S. Census Bureau — 2010 Census Summary File 1: 2010 population source used for the decennial comparison.
- U.S. Census Bureau — 2020 Census P.L. 94-171 Redistricting File: 2020 population source used for the decennial comparison.
Data note: Values follow the source and date printed on each map. ACS figures are estimates, while the 2010–2020 change layer uses decennial census counts.
Green Map creates custom-edited map images using open geographic data sources such as geoBoundaries, Natural Earth, OpenStreetMap, and government open data. These maps are edited visual materials, not raw data files, and are provided for education, documents, presentations, and graphic reference.