Prairie County has a distinctly agricultural 2025 land-cover pattern, but the county is not one uninterrupted block of fields. Agriculture accounts for 61.76% of the mapped area, while wetlands make up 21.01%. Forest, open water, and small developed areas break up the farm belt, especially through the middle and eastern portions of the county. The four maps on this page separate those patterns so the broad cover, farm-and-forest contrast, hard-surface footprint, and 1985–2025 class differences can be examined without treating them as the same kind of information.
The previews help read the county on screen, and the four JPG maps are available together in one download near the end of the page. Land cover describes what is on the ground or at the surface—such as crops, forest, wetlands, water, or developed cover. It does not establish zoning, ownership, parcel boundaries, or whether a site can legally be developed.
Table of Contents
A working landscape where fields share the county with extensive wetlands
The clearest fact in the 2025 summary is the size of the agricultural class: 61.76%. Wetlands are a substantial second category at 21.01%, followed by forest at 7.41%, water at 4.96%, and developed land at 4.10%. Grassland at 0.33% and shrubland at 0.25% are present, but neither forms a major countywide cover. Those shares match the visual impression of the map. Large yellow agricultural blocks dominate the outline, yet teal wetland zones and blue water repeatedly interrupt them instead of appearing only at one edge.
Prairie County is associated with Arkansas’s Grand Prairie region, and the Association of Arkansas Counties identifies Des Arc and DeValls Bluff as its two county seats. That local context helps explain why it is useful to distinguish a broad agricultural landscape from a few compact settlement areas. Still, the supplied land-cover maps do not label those towns or show parcel lines. The safest reading is to use the county information as background while keeping specific spatial observations tied to the map itself.
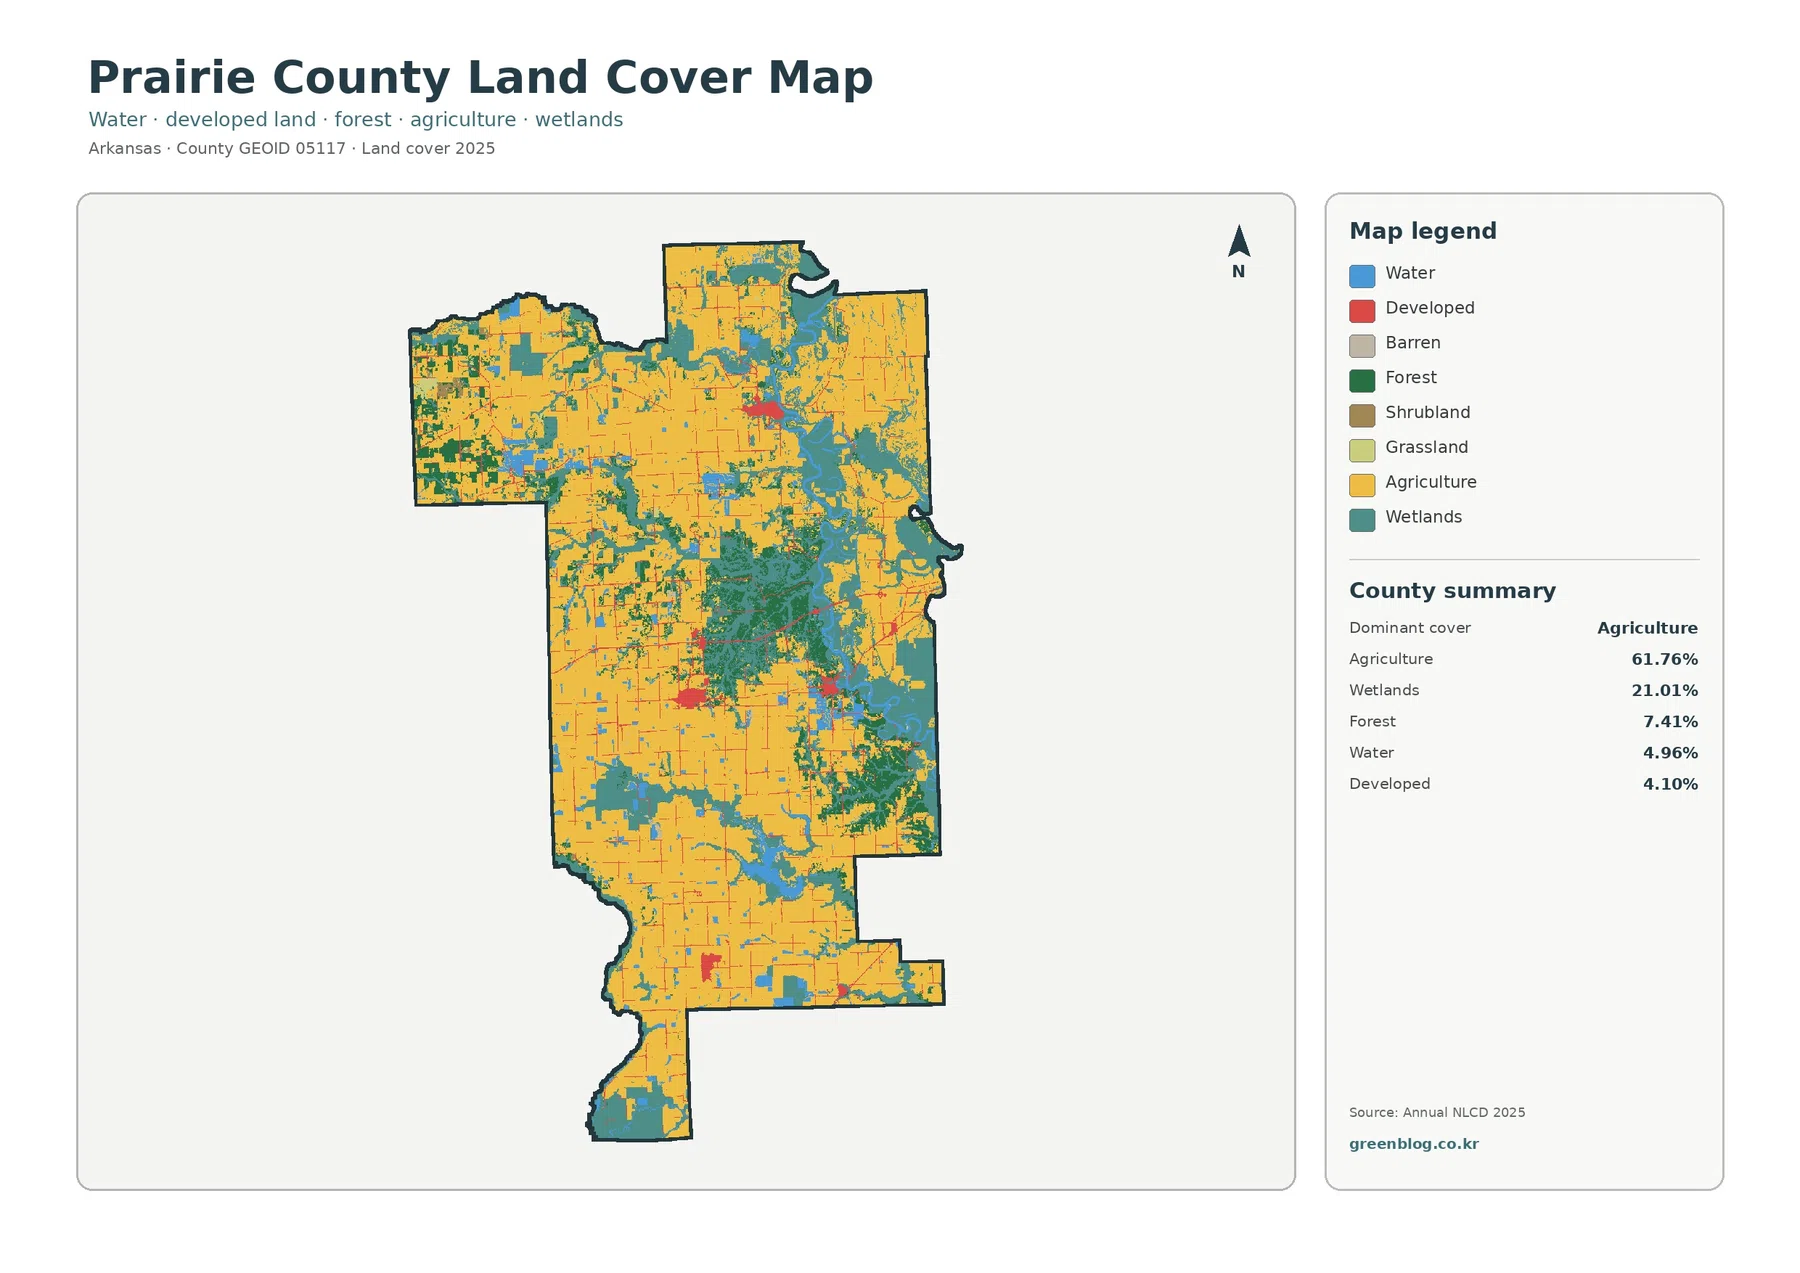
The general cover map shows that the farm belt is repeatedly cut by wet ground and water
Across much of the north and south, agriculture appears as broad connected areas. The middle and eastern side of the county look more mixed. Wetland patches become wider and more frequent there, and several water features sit among or beside them. The northwest also contains a more varied mixture of fields, forest, wetlands, and water than the large agricultural blocks farther south. This variation matters because a countywide percentage alone cannot show where the less common classes are concentrated.
The 21.01% wetland share should not be confused with the 4.96% open-water class. A wetland cell may represent a vegetated or seasonally wet surface rather than open blue water. On this map, viewing those two classes together helps locate the wetter parts of Prairie County, but keeping them separate prevents the common mistake of treating all wetland acreage as a lake, pond, river, or permanently open channel.
Forest is much smaller in total area than agriculture or wetlands, yet it is not merely a random scatter of isolated pixels. Green cover forms more noticeable blocks through the central portion and parts of the east, with smaller wooded pieces in the northwest. That is why “7.41% forest” is more useful when paired with the image: the number says forest is a minority class, while the map shows that some of that minority is spatially concentrated.
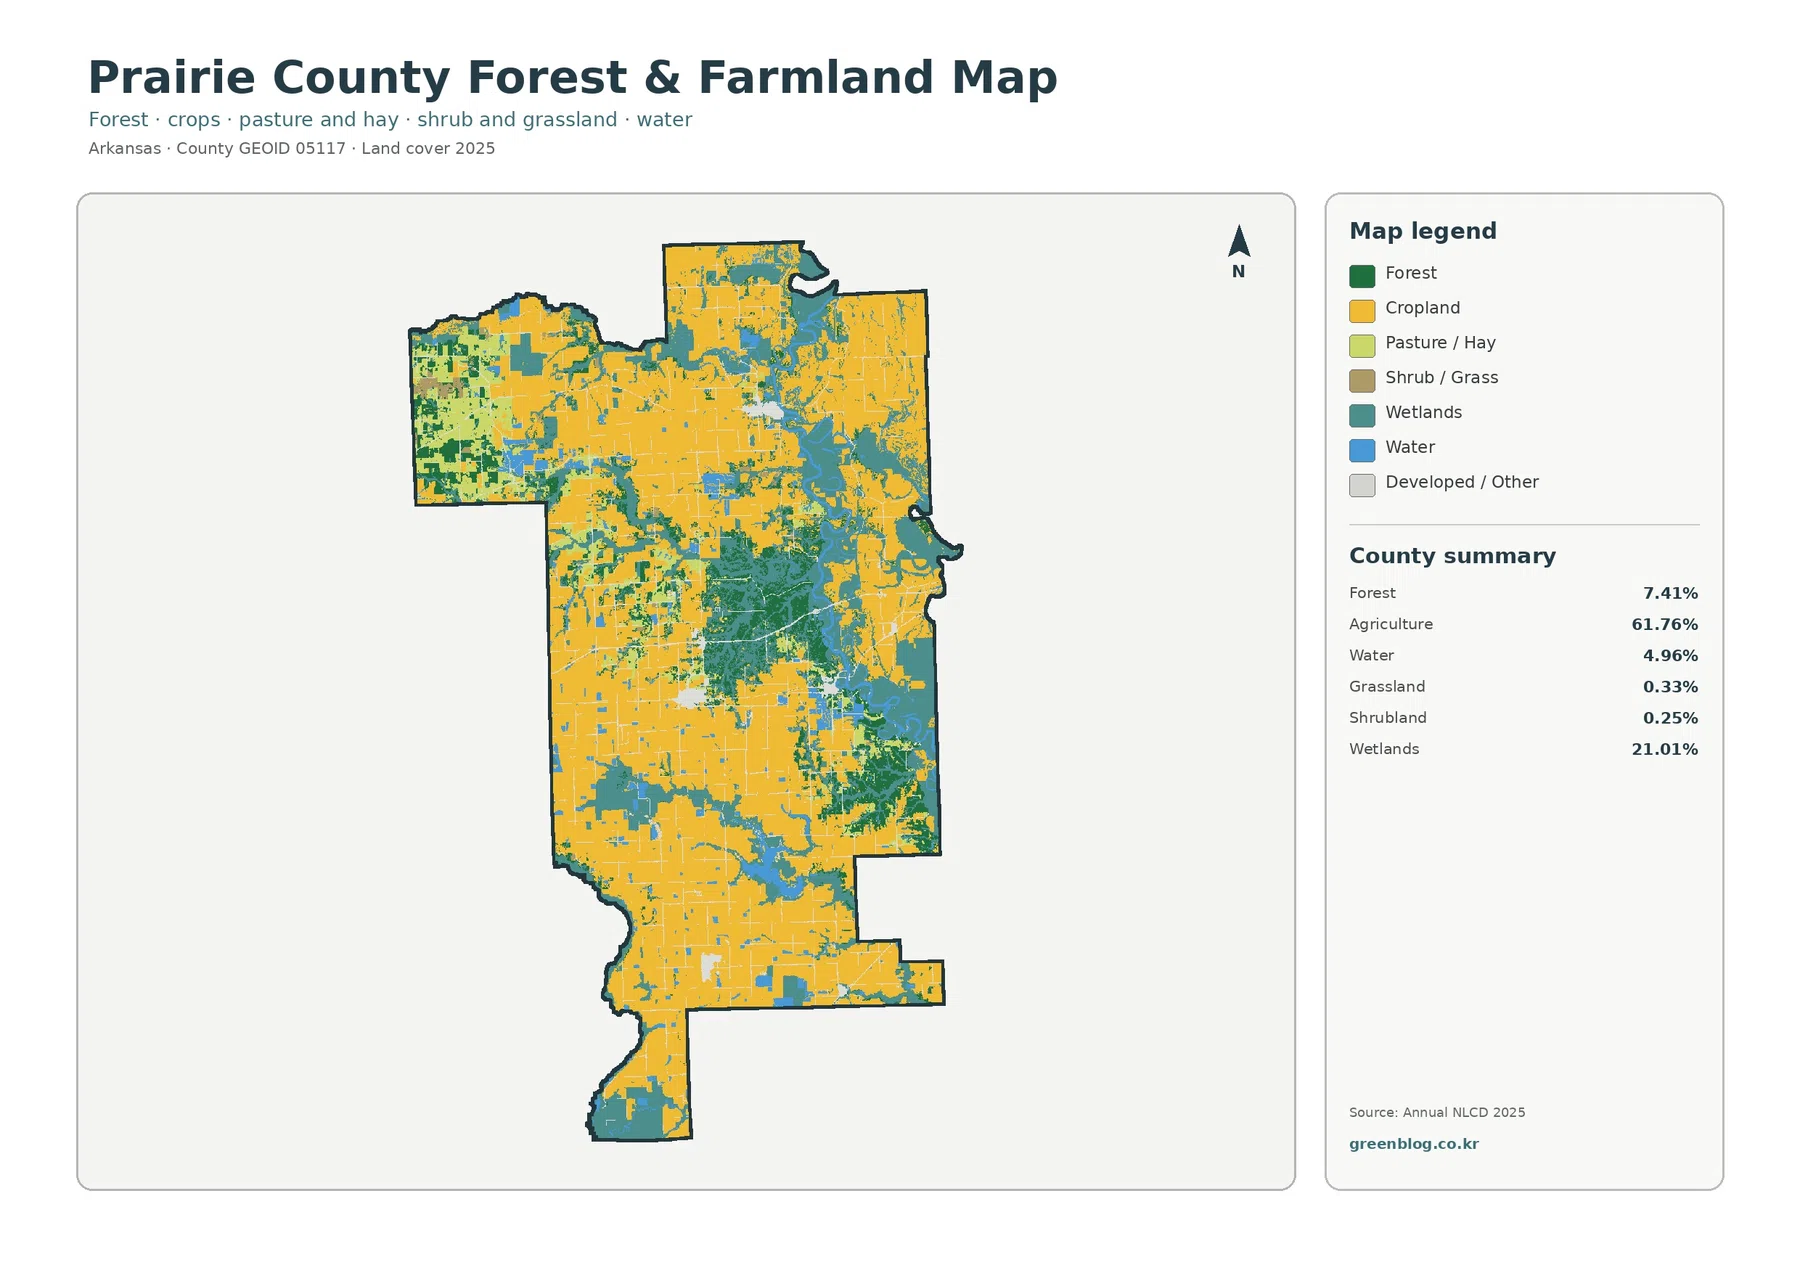
Separating forest and farmland makes the central green blocks easier to see
The forest-and-farmland version strips away some of the visual competition in the full legend. Cropland dominates as a bright background across much of the county, while forest and wetlands become more obvious as contrasting patches. In the middle of the map, green forest forms a larger contiguous area than a quick glance at the 7.41% statistic might suggest. Wetlands surround or intersect parts of that green area, and farm cover resumes around those patches.
The northwest is especially useful for seeing smaller transitions. Agricultural fields remain common, but the cover is more broken by forest, wetland, water, and limited grass or pasture colors. Farther south, the agricultural blocks become broader and more continuous. Those internal differences help a reader compare sections of the county instead of assuming that one dominant class looks the same everywhere.
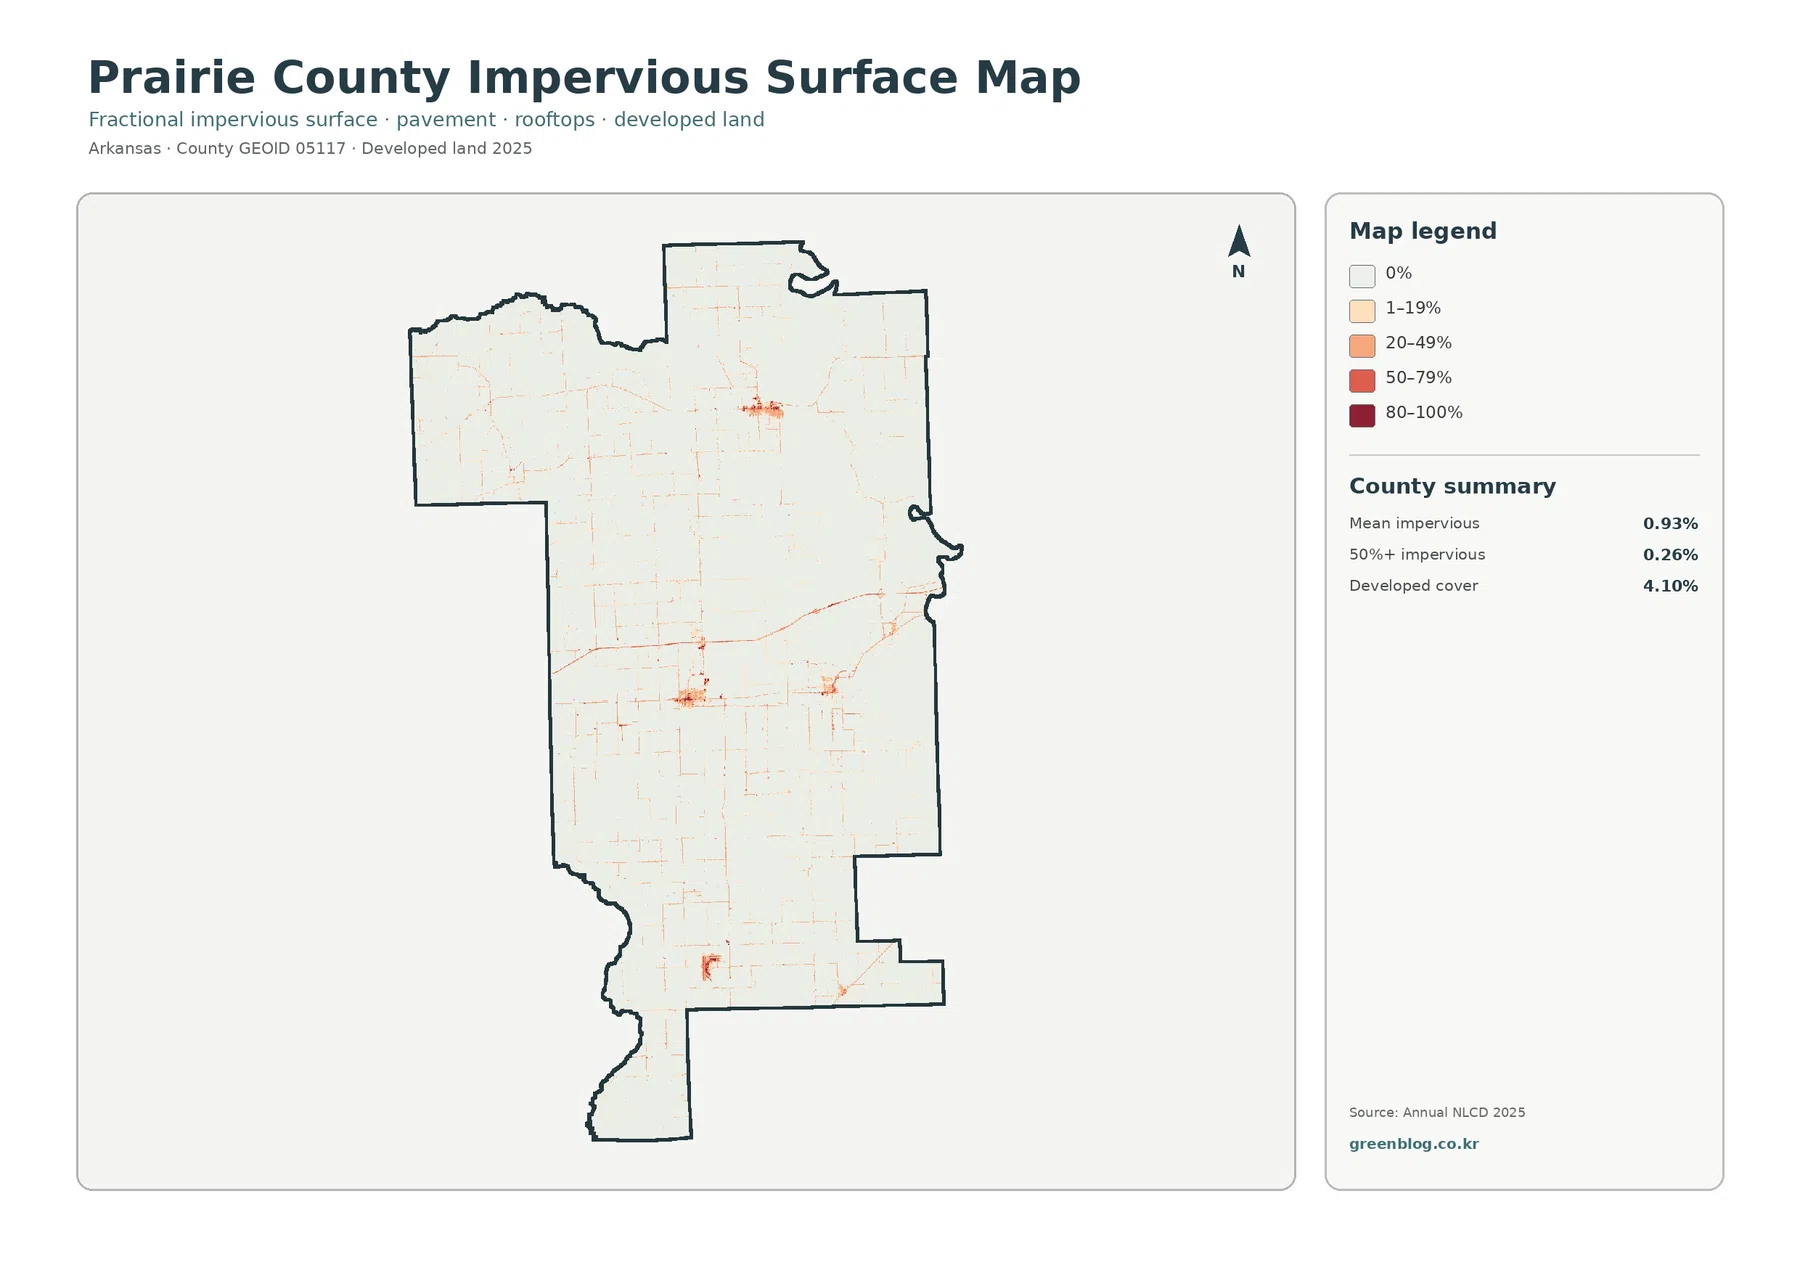
Hard surfaces stay sparse: mean impervious cover is only 0.93%
The impervious-surface map looks almost empty compared with the full land-cover map, and that is an important result rather than missing information. Mean impervious cover is 0.93%, while only 0.26% of the county falls in the 50%-or-higher impervious category. The strongest orange and red marks occur in a handful of compact clusters and along narrow road-like lines. Most of the agricultural and wetland landscape remains in the zero or low-impervious classes.
Developed cover is 4.10% in the general land-cover summary, which is larger than the 0.93% mean impervious value. Those numbers measure different things. A developed land-cover class can contain vegetation, lawns, roadside edges, or low-density built areas in addition to roofs and pavement. Fractional impervious data focuses on the share of a cell covered by hard, water-shedding surfaces. Prairie County is a good example of why the two layers should be read together instead of used interchangeably.
Several compact clusters are visible in the northern and southern portions of the county, with thin connections extending along transportation routes. The map itself does not label settlements, so assigning every cluster to a named town would go beyond the supplied image. The county profile confirms Des Arc and DeValls Bluff as administrative centers, but a road or municipal basemap should be used if the purpose is to identify a particular red patch by name.
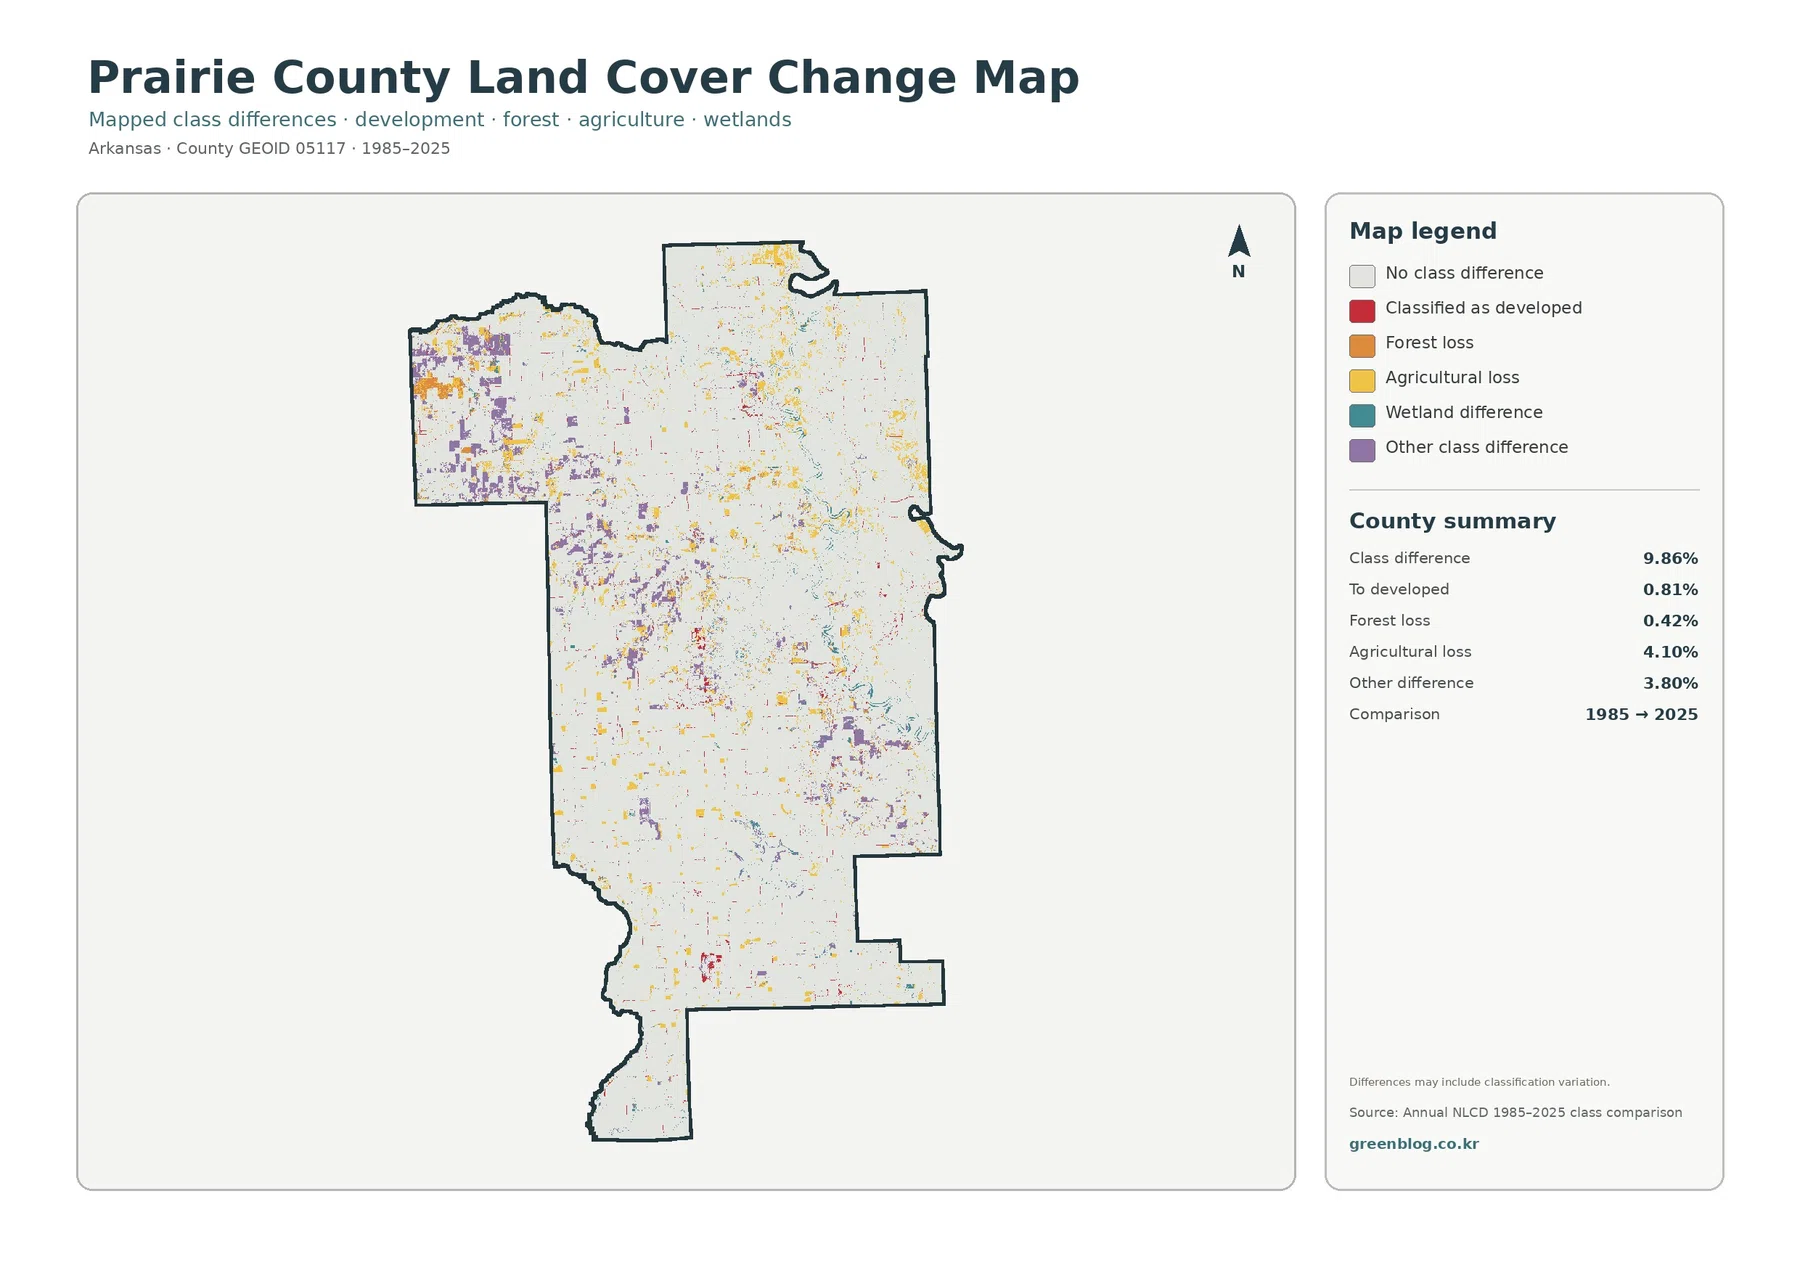
The 1985–2025 comparison marks class differences on 9.86% of the county
The change map has a different purpose from the 2025 cover maps. It compares broad mapped classes between 1985 and 2025 and highlights cells that differ. The county summary reports class differences on 9.86% of the area. Agricultural loss is the largest named component at 4.10%, “other difference” accounts for 3.80%, cells classified as developed account for 0.81%, and forest loss is 0.42%. The remaining majority of the map is shown as no class difference.
Change cells are scattered rather than forming one single countywide conversion front. The northwest and west-central areas contain noticeable groups of purple and yellow marks, while smaller patches occur elsewhere. That pattern suggests where a reader may want to compare the two dates more closely, but the map should not be used to declare a parcel-level history. It is a screening view of classification differences at the raster-cell scale.
The map also includes an important warning: differences may include classification variation. Satellite classifications from different dates can disagree because of seasonal conditions, sensor inputs, processing, mixed pixels, or boundaries between classes, even when the underlying land has not undergone a simple legal or physical conversion. For that reason, 9.86% is not a development growth rate, and the 4.10% agricultural-loss class should not be treated as a direct measure of farms permanently removed from production.
Map File Information
Frequently Asked Questions
What is the dominant land cover in Prairie County, Arkansas?
Agriculture is the largest 2025 class at 61.76%. Wetlands are second at 21.01%, followed by forest at 7.41%, water at 4.96%, and developed cover at 4.10%.
Why does the impervious map look much emptier than the general land-cover map?
Prairie County has a mean impervious value of only 0.93%, and just 0.26% of the county is in the 50%-or-higher impervious category. Most farm and wetland areas therefore remain pale while hard surfaces cluster around small settlements and roads.
Does the 9.86% change value mean Prairie County developed by 9.86% since 1985?
No. The 9.86% figure is the share of cells with a broad mapped class difference between 1985 and 2025. The map warns that classification variation can be included, so the value is not a direct development-growth rate.
Map File Information
Included files: Prairie County general land cover, forest and farmland, impervious/developed land, and 1985–2025 land-cover change maps — four JPG files total.
- Included Files: Use only the versions confirmed in the article and supplied images
- File Type: Use the confirmed download contents
- Intended Use: Printing, education, presentations, and map-based projects
Related Maps
- A Craighead County Arkansas Land Cover Map
- Arkansas County Arkansas Land Cover Map
- Ashley County Arkansas Land Cover Map
Sources and references
- MRLC Annual NLCD Data – source portal for land-cover and change products
- USGS Annual NLCD Land Cover Classification – class definitions and interpretation
- U.S. Census Bureau TIGER/Line Shapefiles – county boundary reference
- Association of Arkansas Counties – Prairie County – county seats and local profile
- U.S. Census Bureau QuickFacts – Prairie County, Arkansas – official county statistics
Green Map creates custom-edited map images using open geographic data sources such as geoBoundaries, Natural Earth, OpenStreetMap, and government open data.
These maps are edited visual materials, not raw data files, and are provided for education, documents, presentations, and graphic reference.