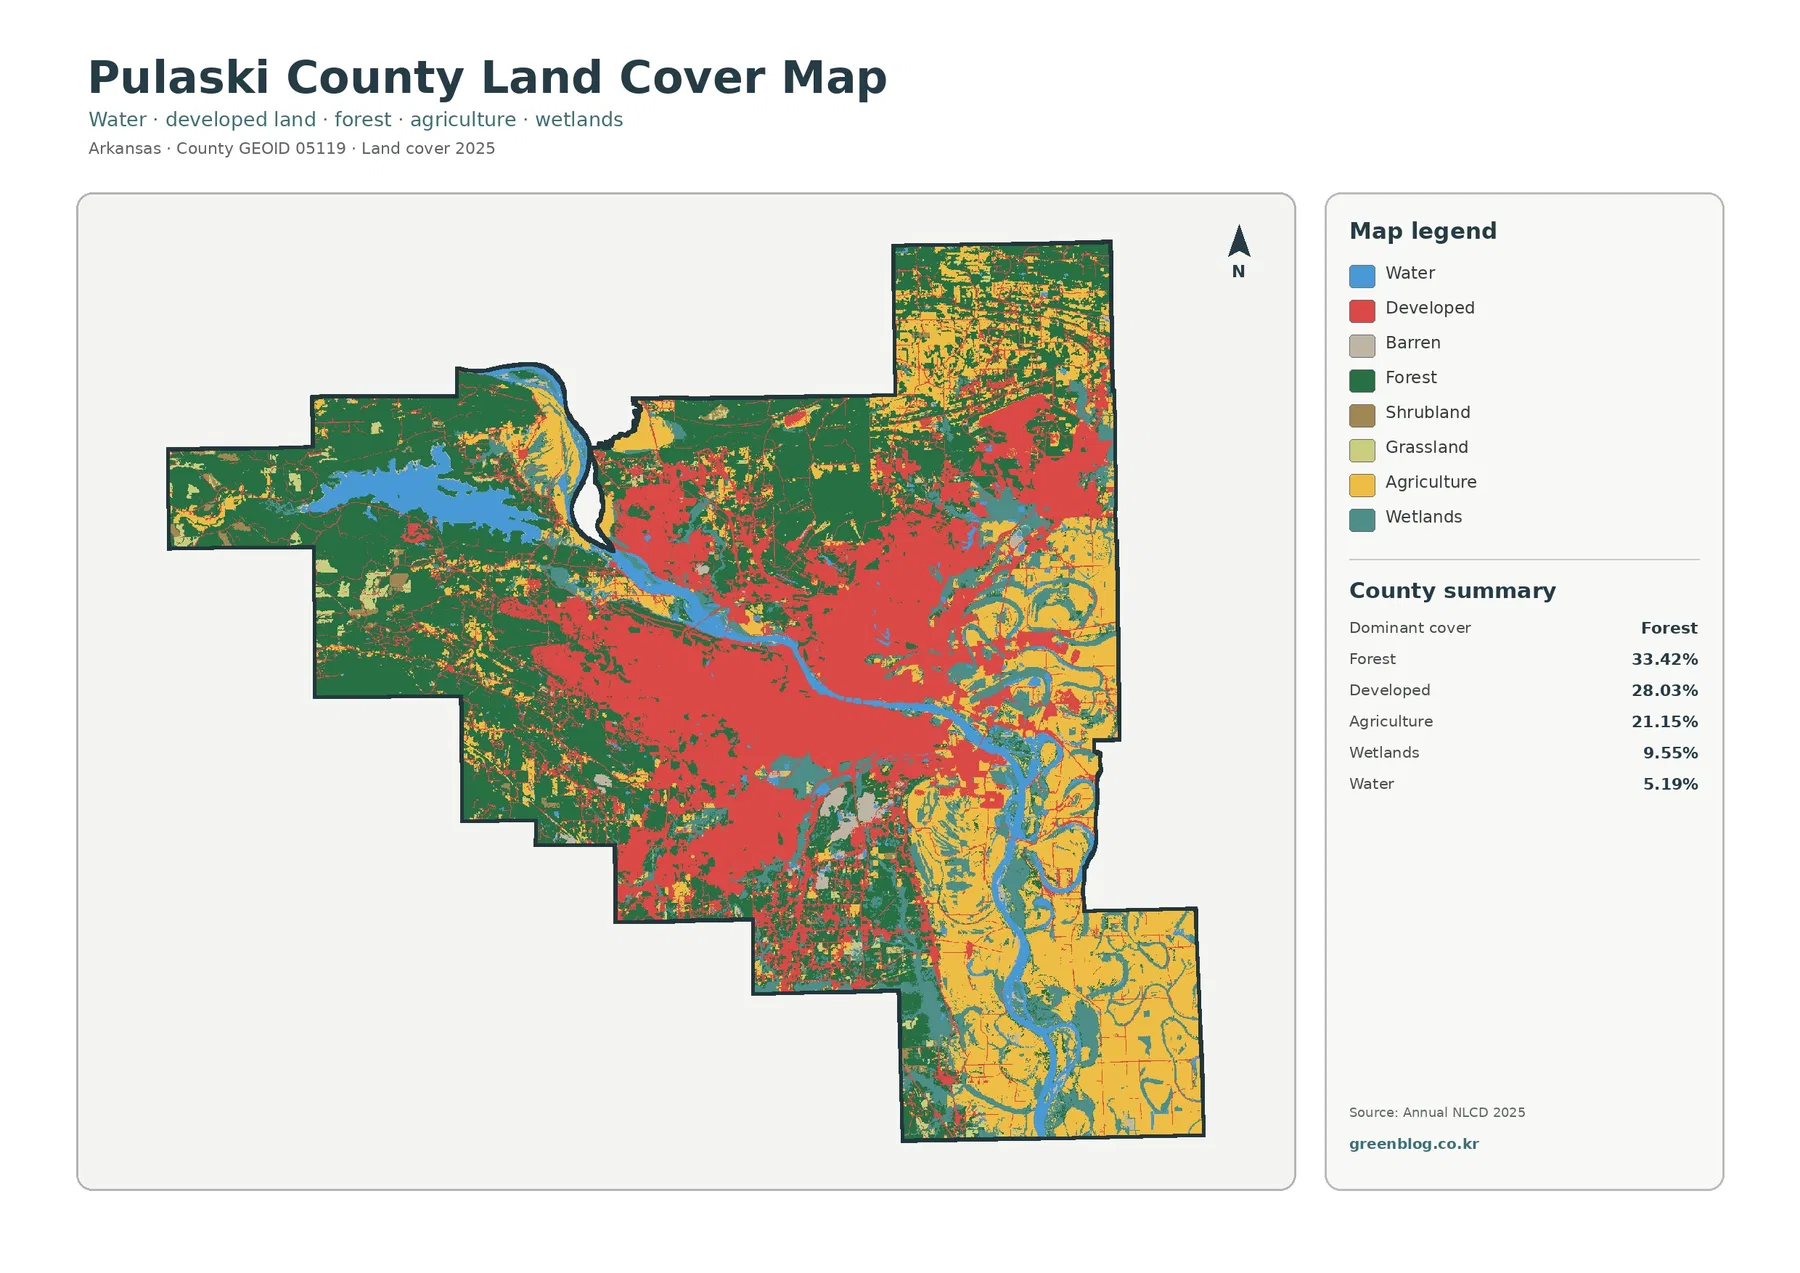
Pulaski County has one of the most mixed land-cover profiles in this Arkansas series. The 2025 summary is led by forest at 33.42%, but developed land is close behind at 28.03%, with agriculture at 21.15%. A broad urban core occupies the center of the county, forest and open water dominate much of the west, and farm-wetland patterns become more prominent toward the east and southeast. The four maps on this page separate those patterns into current land cover, forest and farmland, impervious surface, and a 1985–2025 class comparison.
Preview images are provided throughout the article, and the four original JPG maps are available together in the download section. These are land-cover maps, not zoning or parcel maps: they classify what the ground surface appears to be covered by, such as forest, agriculture, water, wetlands, or developed cover. They can help with county-scale comparison, classroom work, presentations, and environmental context, but they do not establish property ownership, legal land use, survey boundaries, or development rights.
Table of Contents
A metropolitan center breaks up what would otherwise be a forest-and-farm county
Pulaski County does not have a single class that overwhelms the map. Forest covers 33.42% of the 2025 classification, developed land accounts for 28.03%, agriculture for 21.15%, wetlands for 9.55%, and water for 5.19%. The forest-and-farmland summary adds 1.18% grassland and 0.68% shrubland. That balance matters because the county combines a large urban area with substantial forest, agricultural ground, river corridors, wetlands, and reservoirs. Reading only the dominant class would miss most of what makes the county distinctive.
The most obvious visual feature is the broad developed area in the middle of the county. It spans both sides of the Arkansas River and corresponds to the Little Rock–North Little Rock urban area. Red developed cover is not confined to one compact center; it extends outward in several directions and is interspersed with forest, water, and lower-density land. West of the urban area, green forest becomes much more continuous. East and southeast of the center, yellow agriculture and blue-green wetland patterns occupy larger blocks.
Water helps organize several of those contrasts. The Arkansas River crosses the central part of the county, while a large body of water is visible to the west amid extensive forest. Pulaski County Planning and Development maintains a dedicated set of Lake Maumelle Watershed regulations and planning materials, providing useful local context for that western water-and-forest landscape. The land-cover image itself does not label every lake, tributary, or drainage channel, so named hydrologic interpretation should be paired with a dedicated water or road basemap when exact locations matter.
Forest and farmland become easier to compare when the urban colors are muted
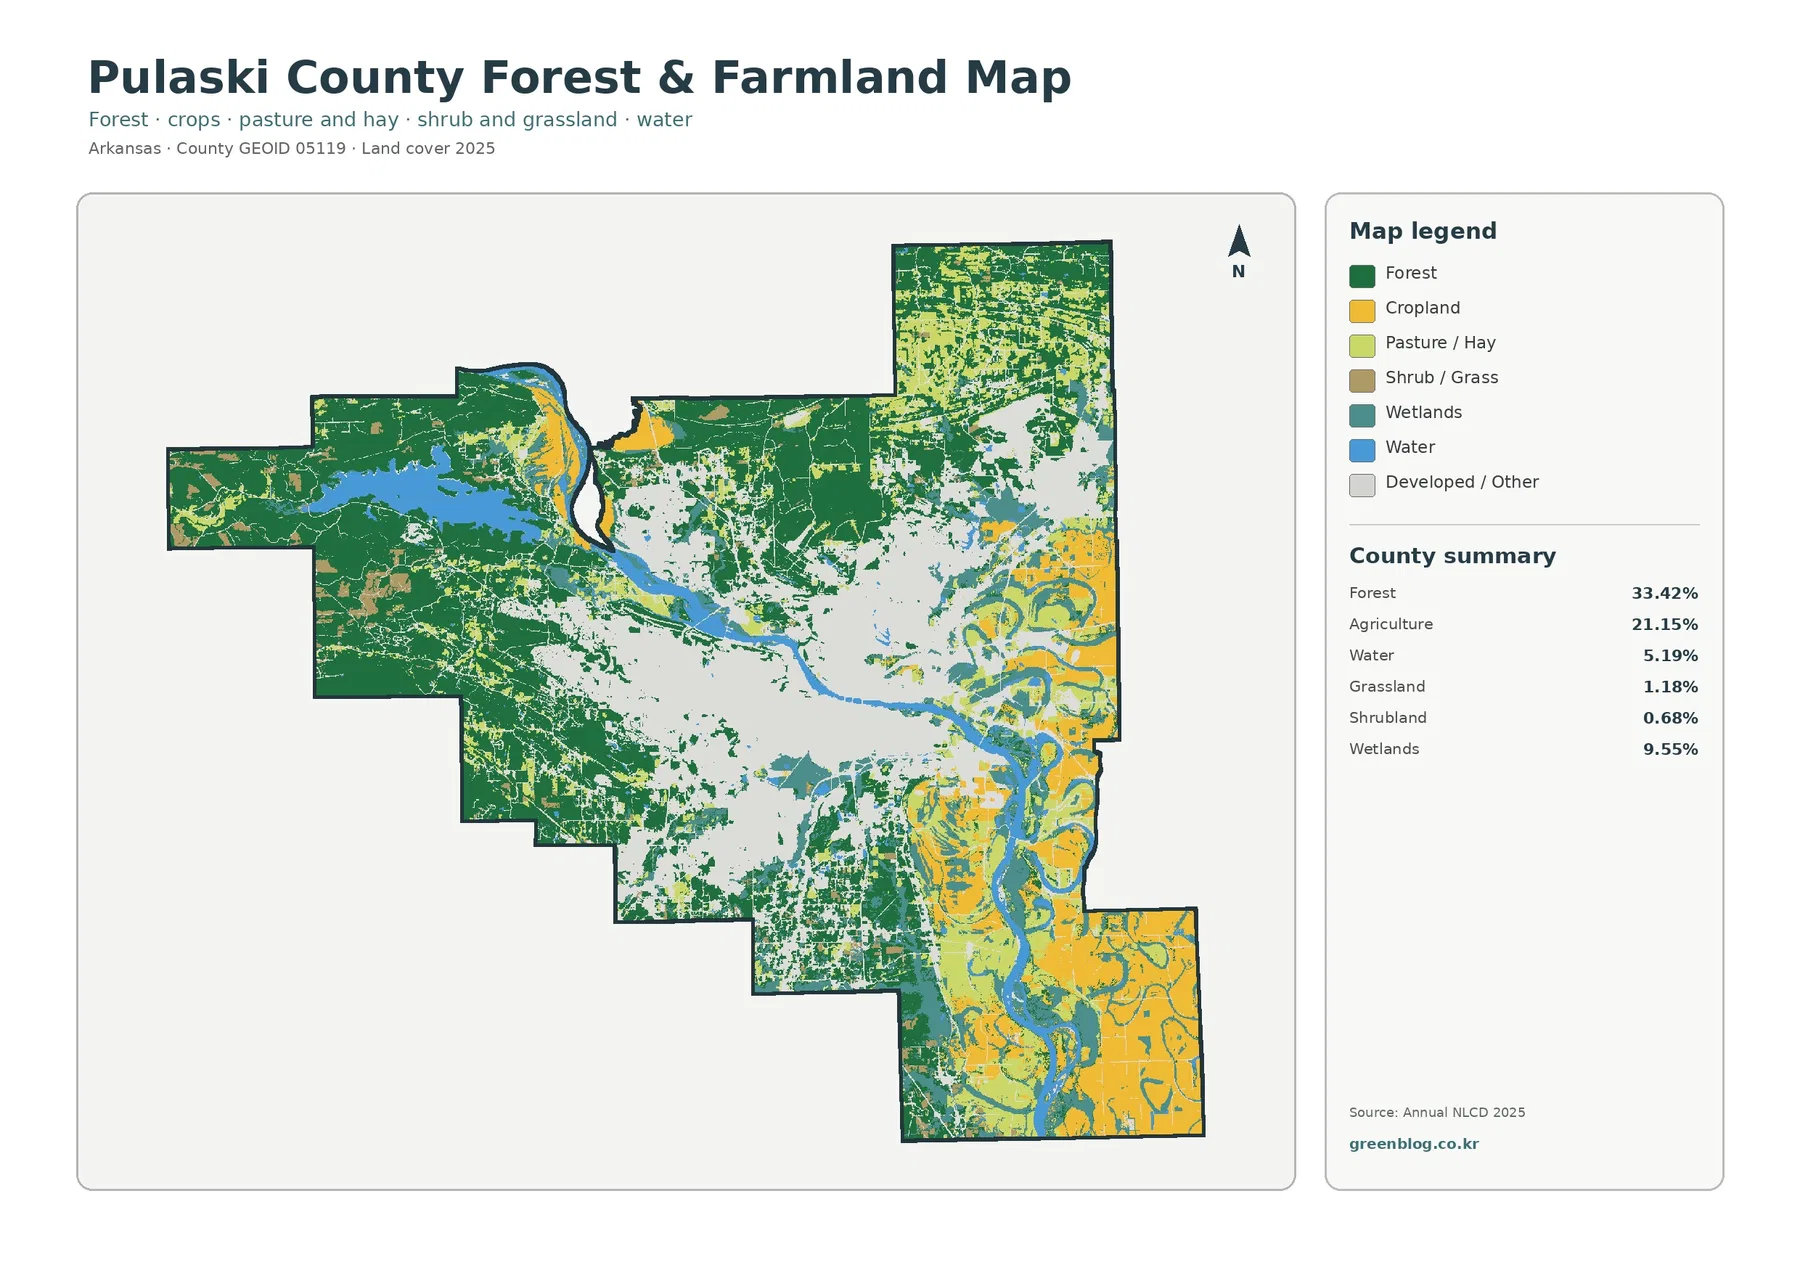
The forest-and-farmland map simplifies the visual competition among classes. Forest is shown prominently across the west and northwest, agriculture is concentrated more heavily in the east and southeast, and much of the metropolitan core is pushed into a neutral developed/other category. That treatment makes the transition from wooded western land to the mixed urban center and then to eastern agricultural ground easier to follow. It also reveals that the county’s forest is not merely a collection of isolated parks; large connected forest blocks remain outside the central built-up area.
Agriculture accounts for 21.15% of Pulaski County, but it is not evenly distributed. Large crop-colored areas appear in the eastern and southeastern sections, while smaller agricultural openings occur elsewhere. Near the center, development and forest break the agricultural pattern into smaller pieces. Farther west, farm and grass colors are secondary to forest. This uneven distribution is important when comparing the county with a heavily agricultural Arkansas county, where cropland may dominate almost every direction.
Hard-surface intensity reveals the true core of the built landscape
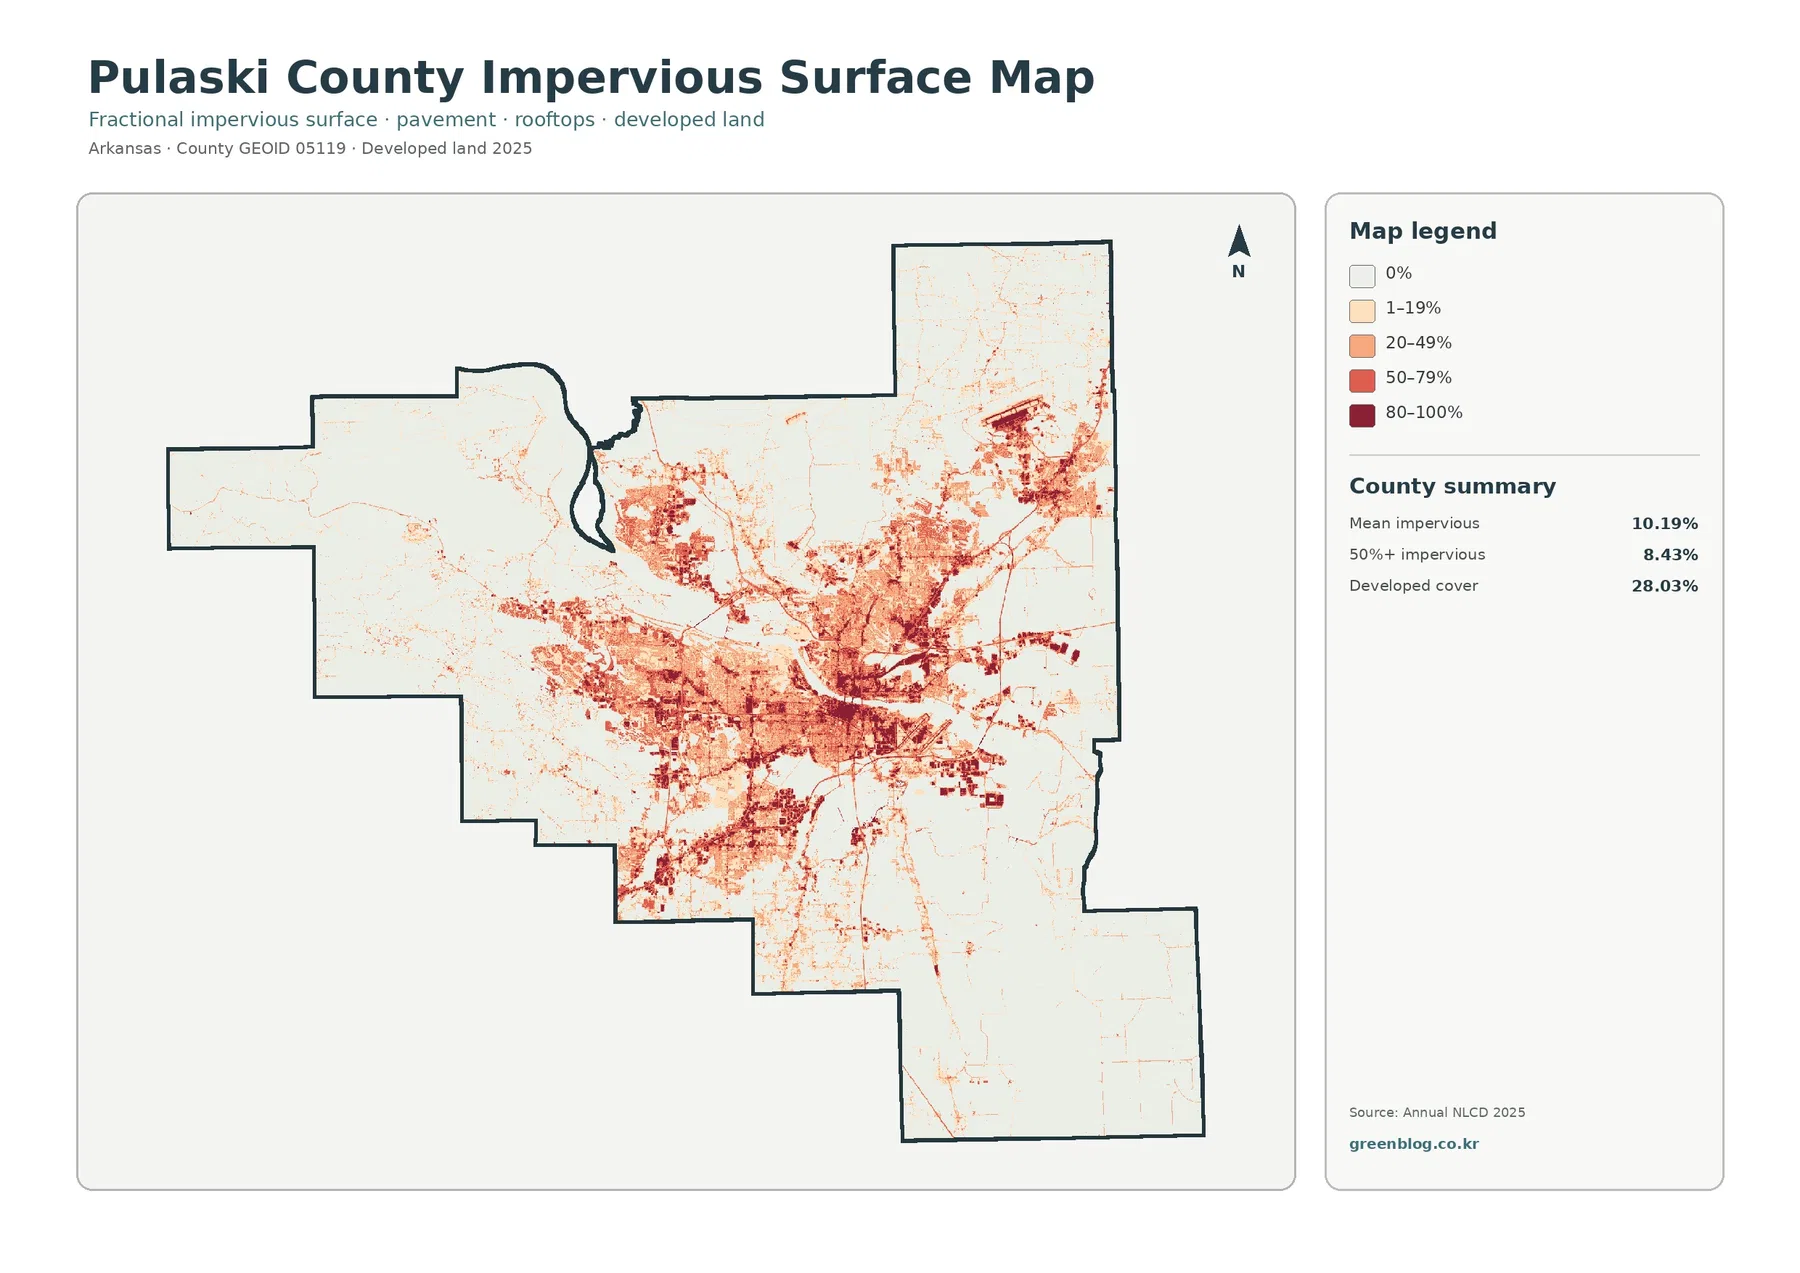
Impervious surface means pavement, rooftops, and other surfaces that do not readily absorb water. Pulaski County has a mean impervious value of 10.19%, and 8.43% of the county is mapped at 50% impervious or higher. Those values are much smaller than the 28.03% developed-cover share because the two layers measure different things. A developed land-cover cell can include lawns, trees, roadside vegetation, and other permeable surfaces. Fractional impervious data focuses specifically on the hard-surface share within a cell.
On this map, the Little Rock–North Little Rock area stands out immediately. Darker orange and red values cluster on both sides of the Arkansas River and spread through the central metropolitan footprint. Narrow linear traces extend away from the core along transportation corridors, and separate built clusters appear to the northeast, southwest, and south. The western forest and southeastern agricultural areas are much paler. That contrast makes the impervious layer especially useful for distinguishing dense development from lower-density developed cover.
The map should not be treated as a flood-risk map, even though impervious surface can matter for runoff. Flooding depends on elevation, drainage systems, river conditions, soils, rainfall, and many other factors that are not contained in this layer. Pulaski County’s Planning and Development department separately administers floodplain and stormwater information, which is a reminder that official hazard and permitting questions require more specific sources. Here, the impervious map is best used to understand the concentration and intensity of hard surfaces.
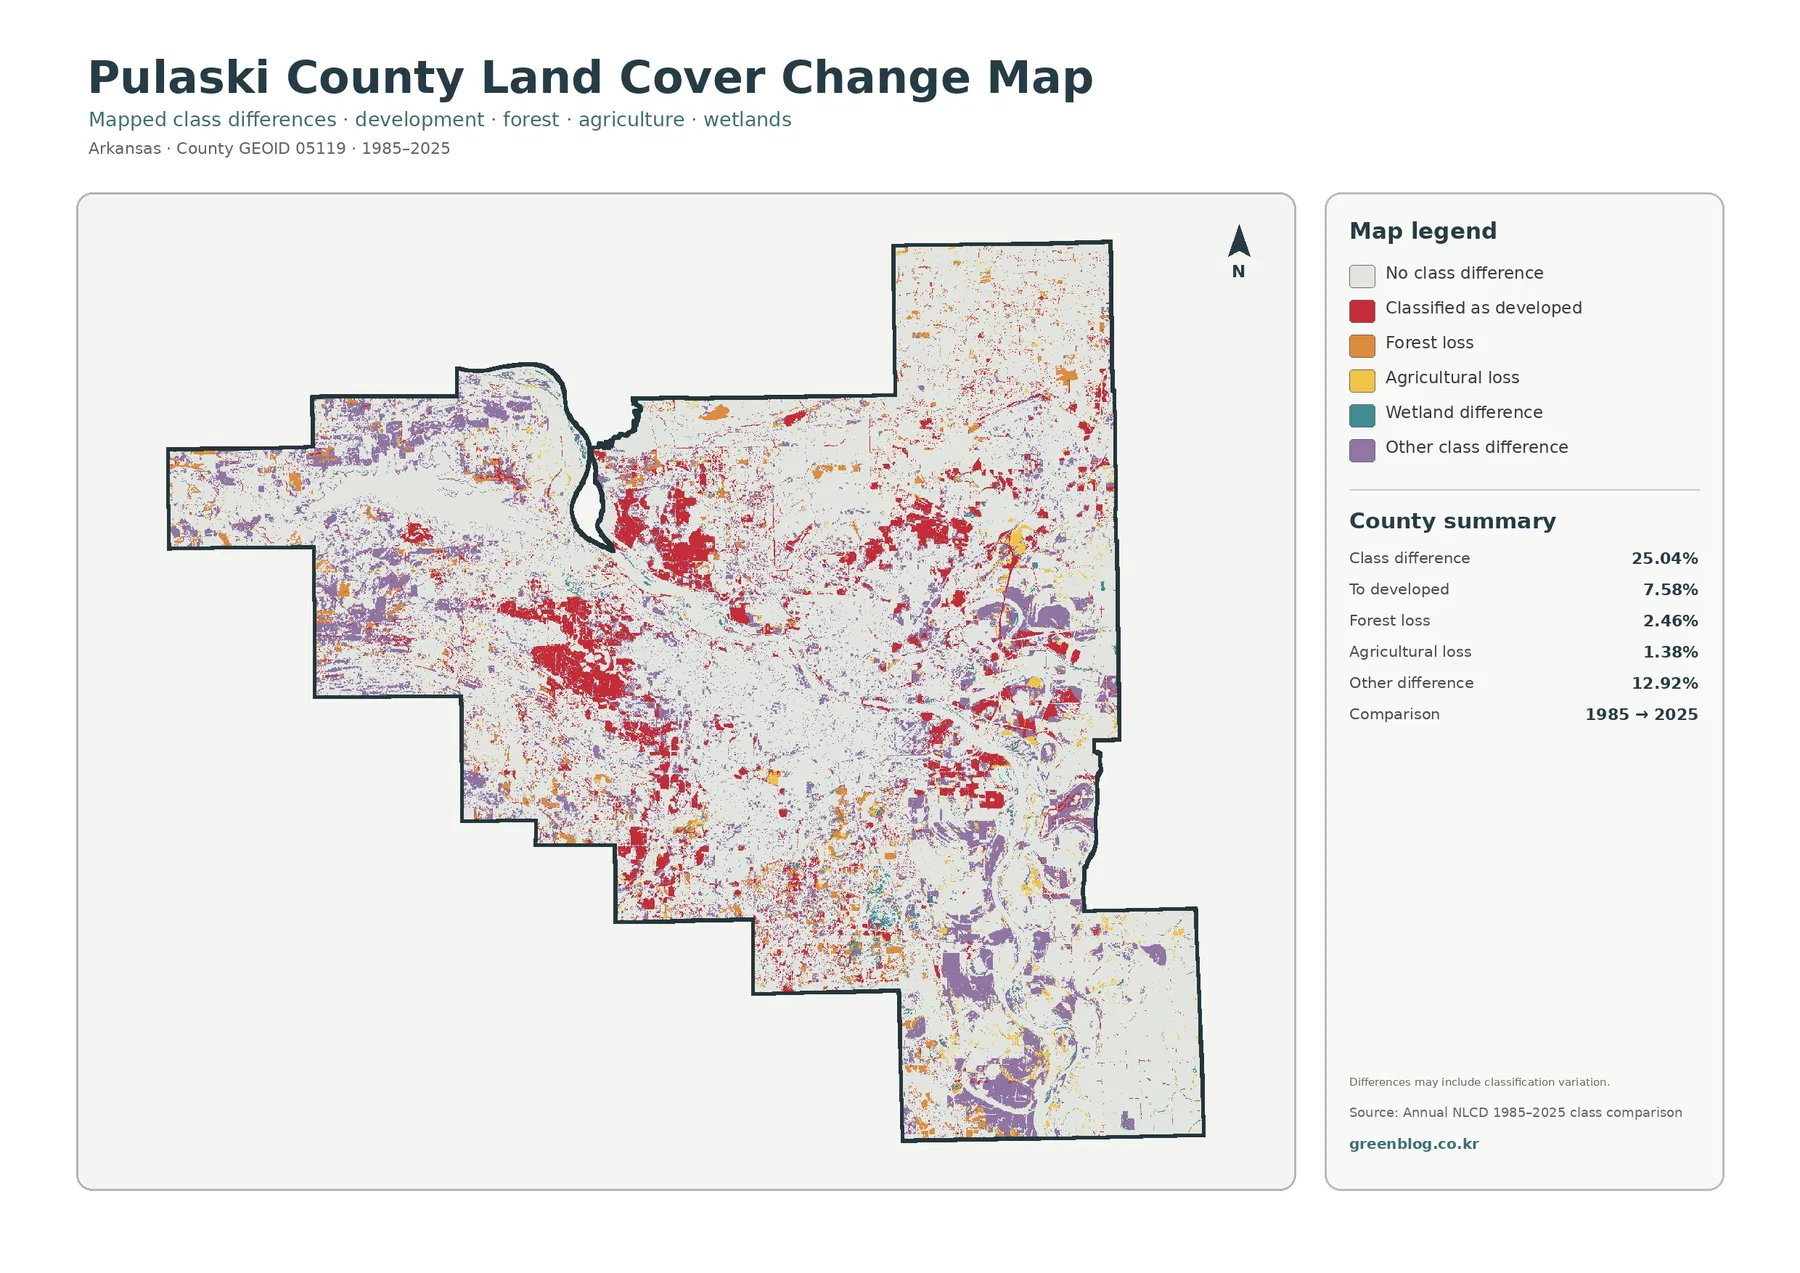
The 1985–2025 comparison highlights development-related differences without turning them into a growth rate
The change map compares broad mapped classes in 1985 and 2025 rather than measuring legal land-use change. Pulaski County has a 25.04% class difference in this comparison. Cells classified as developed in the later map account for 7.58%, forest-loss cells for 2.46%, agricultural-loss cells for 1.38%, and the large “other difference” category for 12.92%. Most of the remaining area is shown as no broad class difference between the two comparison dates.
The 25.04% value is not a statement that one quarter of Pulaski County physically changed land use in a simple, verified way. The map itself warns that class differences may include classification variation. Satellite observations from different dates can be affected by seasonal vegetation, mixed pixels, processing choices, and cells that sit on boundaries between cover types. A highlighted cell is therefore a useful place to investigate, not proof of a parcel’s development history or a legal conversion from one use to another.
Reading the four maps together separates current cover, hard surfaces, and change
A practical way to use this set is to begin with the general 2025 map and identify the broad context of a location. Is it inside the central developed footprint, the western forest, the eastern agricultural area, or a water-wetland corridor? The forest-and-farmland view can then clarify whether green and yellow cover around that location forms a large connected block or a smaller patch. The impervious map adds information about how much of a developed location is actually occupied by hard surfaces.
Raster classification still imposes limits. Annual NLCD-type data divides the landscape into cells, and a cell may contain more than one real surface: a house, lawn, tree canopy, and street can all occur within a small area. Narrow streams, parcel edges, small structures, and recent changes may be simplified or missed. The maps are therefore appropriate for county-scale patterns and comparisons, but they are not substitutes for cadastral surveys, engineering plans, zoning maps, or site inspections.
Map File Information
Frequently Asked Questions
What is the largest land-cover class in Pulaski County, Arkansas?
Forest is the largest 2025 class at 33.42%. Developed land is close behind at 28.03%, followed by agriculture at 21.15%, wetlands at 9.55%, and water at 5.19%.
What does the impervious-surface map reveal about the Little Rock area?
The highest impervious values cluster in the central Little Rock–North Little Rock urban area on both sides of the Arkansas River. Mean impervious cover is 10.19%, and 8.43% of the county is mapped at 50% impervious or higher.
Does the 25.04% change value mean Pulaski County grew by 25.04% since 1985?
No. The 25.04% figure is the share of cells with a broad mapped class difference between 1985 and 2025. The comparison can include classification variation, so it is not a direct population, development, or land-use growth rate.
Map File Information
Included files: Pulaski County general land cover, forest and farmland, impervious/developed land, and 1985–2025 land-cover change maps — four JPG files total.
- Included Files: Use only the versions confirmed in the article and supplied images
- File Type: Use the confirmed download contents
- Intended Use: Printing, education, presentations, and map-based projects
Related Maps
- A Craighead County Arkansas Land Cover Map
- Arkansas County Arkansas Land Cover Map
- Ashley County Arkansas Land Cover Map
Sources and references
- MRLC Annual NLCD Data – source portal for land-cover and change products
- USGS Annual NLCD Land Cover Classification – class definitions and interpretation guidance
- U.S. Census Bureau TIGER/Line Shapefiles – county boundary reference
- Pulaski County Planning & Development – local planning, Lake Maumelle Watershed, floodplain, and stormwater resources
- University of Arkansas Cooperative Extension – Pulaski County – county-level education and agriculture resources
Green Map creates custom-edited map images using open geographic data sources such as geoBoundaries, Natural Earth, OpenStreetMap, and government open data.
These maps are edited visual materials, not raw data files, and are provided for education, documents, presentations, and graphic reference.