This page covers Arkansas County, Arkansas with four 2025 land-cover views and a 1985–2025 class-comparison map. Agriculture is the dominant mapped cover at 55.01%, while wetlands account for 33.08%. Broad farm areas occupy much of the interior and west, while extensive wetlands stand out along the eastern side and across the southern part of the county.
The four original JPG maps are available together in one download. They include general land cover, forest and farmland, impervious surface and developed land, and mapped class differences between 1985 and 2025. These maps work well for county-scale reference, classroom use, presentations, and a first comparison of farm, wetland, water, and developed areas. They describe surface cover, not zoning, ownership, parcel boundaries, or legal development rights.
Table of Contents
A county divided mainly between cropland and wetland cover
Arkansas County has an unusually clear two-part pattern at county scale. Yellow agricultural cover fills much of the northern, central, and western interior, while teal wetland cover becomes extensive toward the east and south. Together, agriculture and wetlands represent more than 88% of the 2025 summary. Developed land at 4.33%, forest at 3.65%, and water at 3.32% form smaller but still important parts of the map, especially around towns and within the river-and-wetland landscape.
What the 2025 land-cover map says about farms, wetlands, and towns
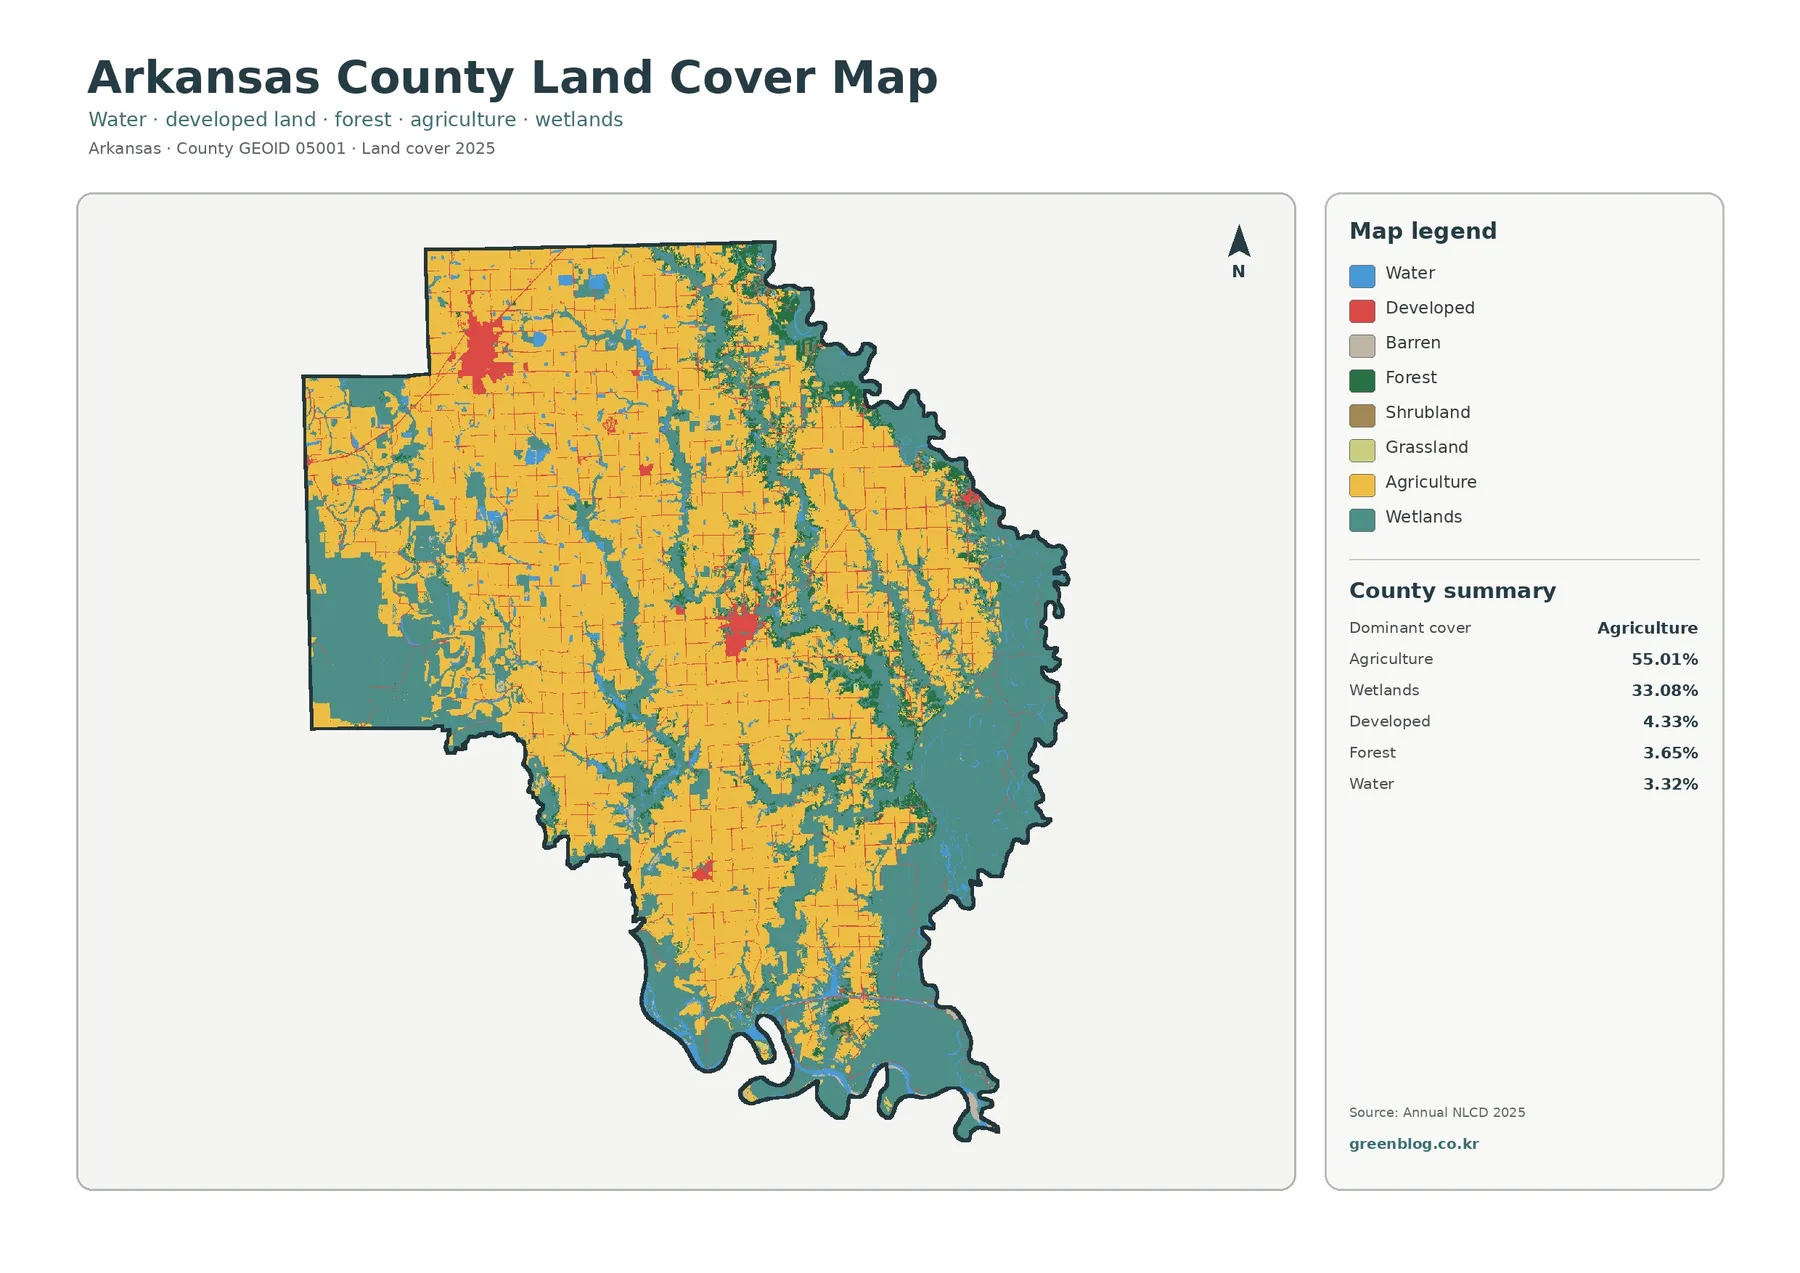
Agriculture covers 55.01% of Arkansas County in the supplied summary. It forms large connected blocks across the county interior, with field-like edges and a fine network of narrow lines visible throughout many farm areas. Wetlands interrupt the agricultural pattern in many places, but the contrast is strongest on the eastern and southern sides. The University of Arkansas Cooperative Extension maintains Arkansas County offices in DeWitt and Stuttgart and provides research-based agricultural information for the area, a useful local reference for a county where mapped cropland is the largest surface class.
Wetlands account for 33.08%, making them far more than a narrow river-edge feature. Large wetland areas occupy much of the eastern third and spread across the south, with additional bands extending into the farmed interior. Water is 3.32% and appears as scattered lakes, channels, and other blue features embedded within both agricultural and wetland zones. Forest is 3.65%. Rather than forming one dominant upland forest block, the green forest class appears in smaller areas, many of them close to the eastern wetland landscape.
The forest-and-farmland view makes the wetland edge easier to follow
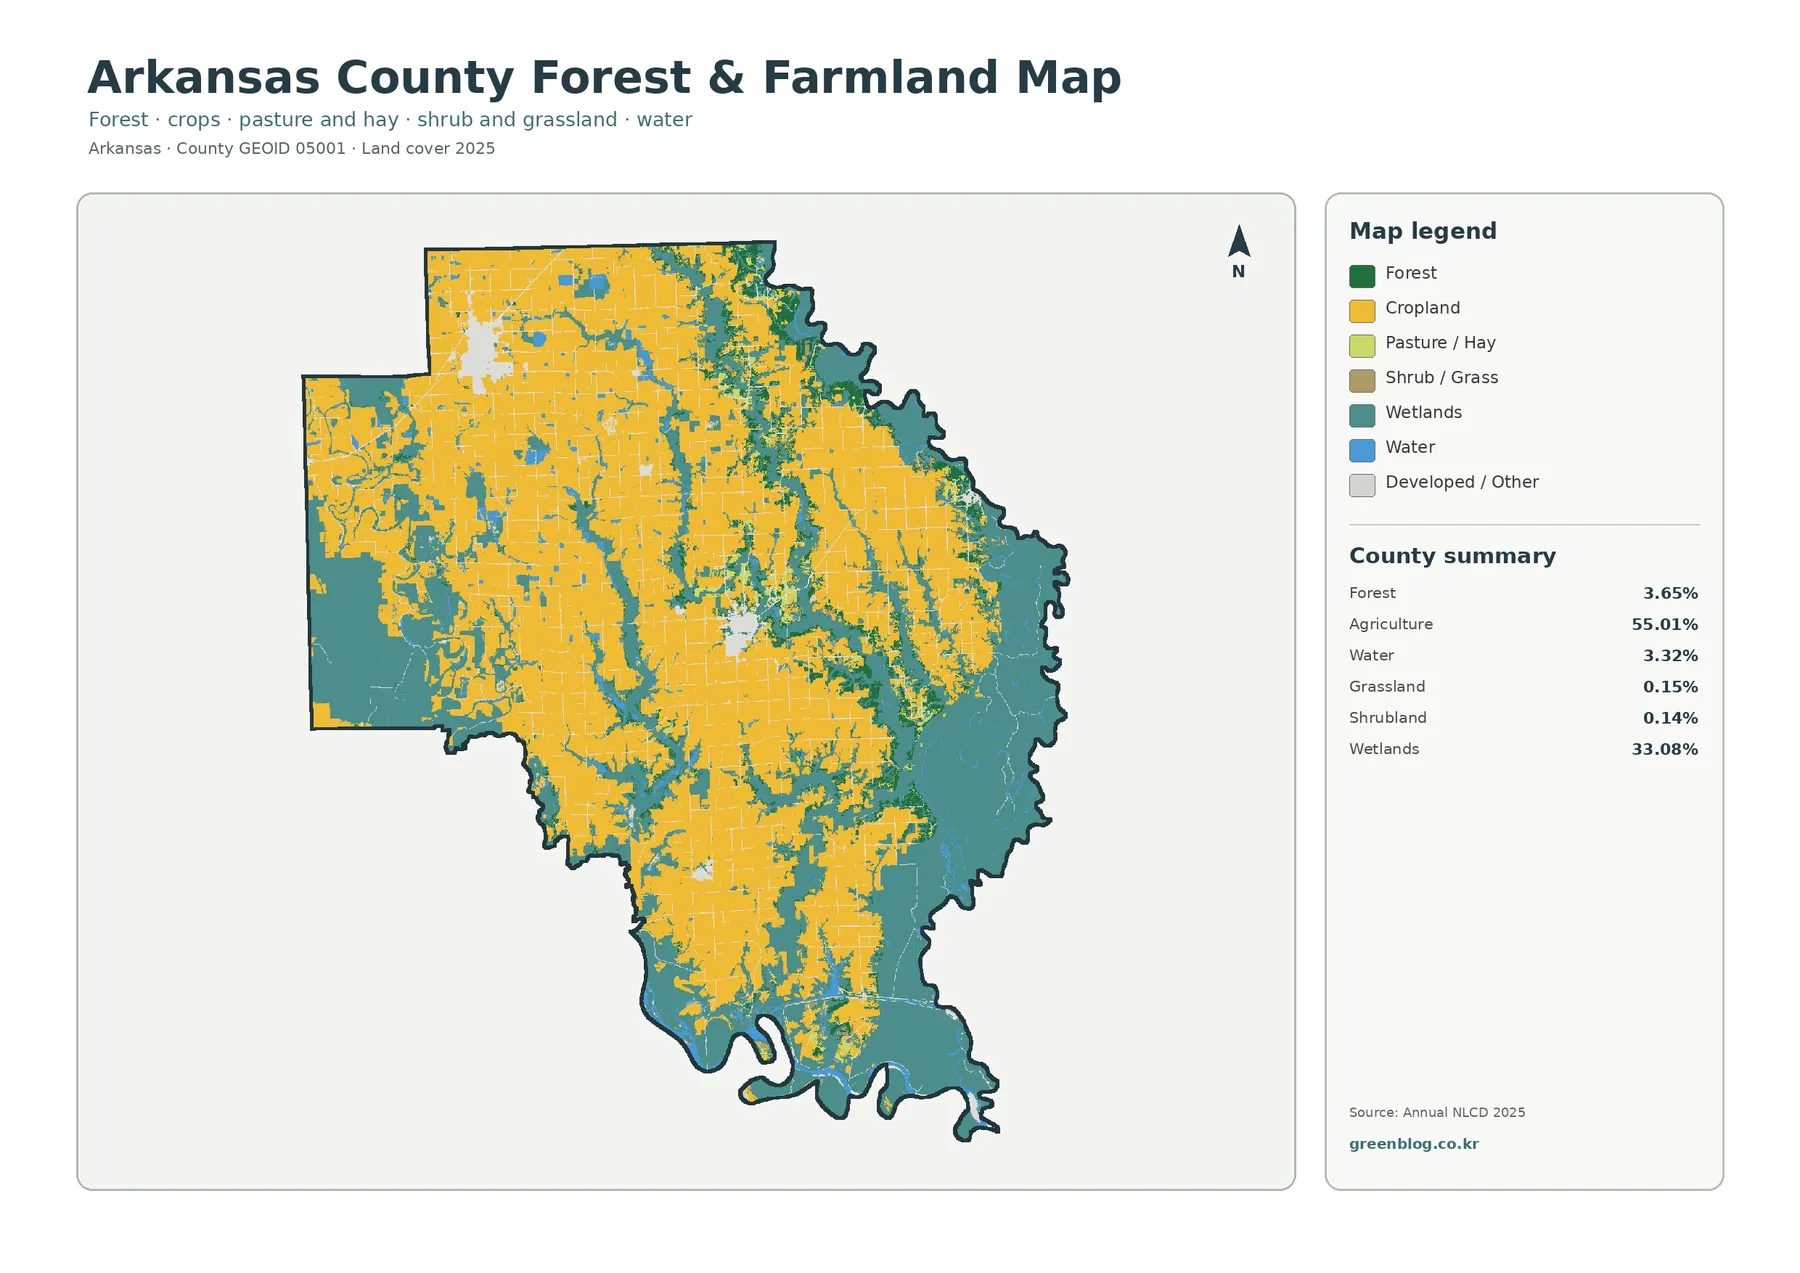
The forest-and-farmland version removes some of the visual competition from the general map and makes agricultural and natural cover easier to separate. Cropland remains the broad interior color, while wetlands form a large eastern and southern zone. Small water features are easier to spot against those two major classes. This is useful when the goal is not to identify every developed patch, but to see where the farmed landscape gives way to wetter ground and where water is interspersed with fields.
Impervious surface is low countywide but concentrated in a few places
Impervious surface means hard cover such as pavement, rooftops, and parking areas that does not absorb water easily. The countywide mean is 1.03%. Only 0.38% of Arkansas County is mapped with impervious cover at 50% or higher, even though developed land occupies 4.33%. Those figures measure different things: a developed land-cover cell can still contain lawns, bare soil, trees, drainage space, and other surfaces that are not impervious.
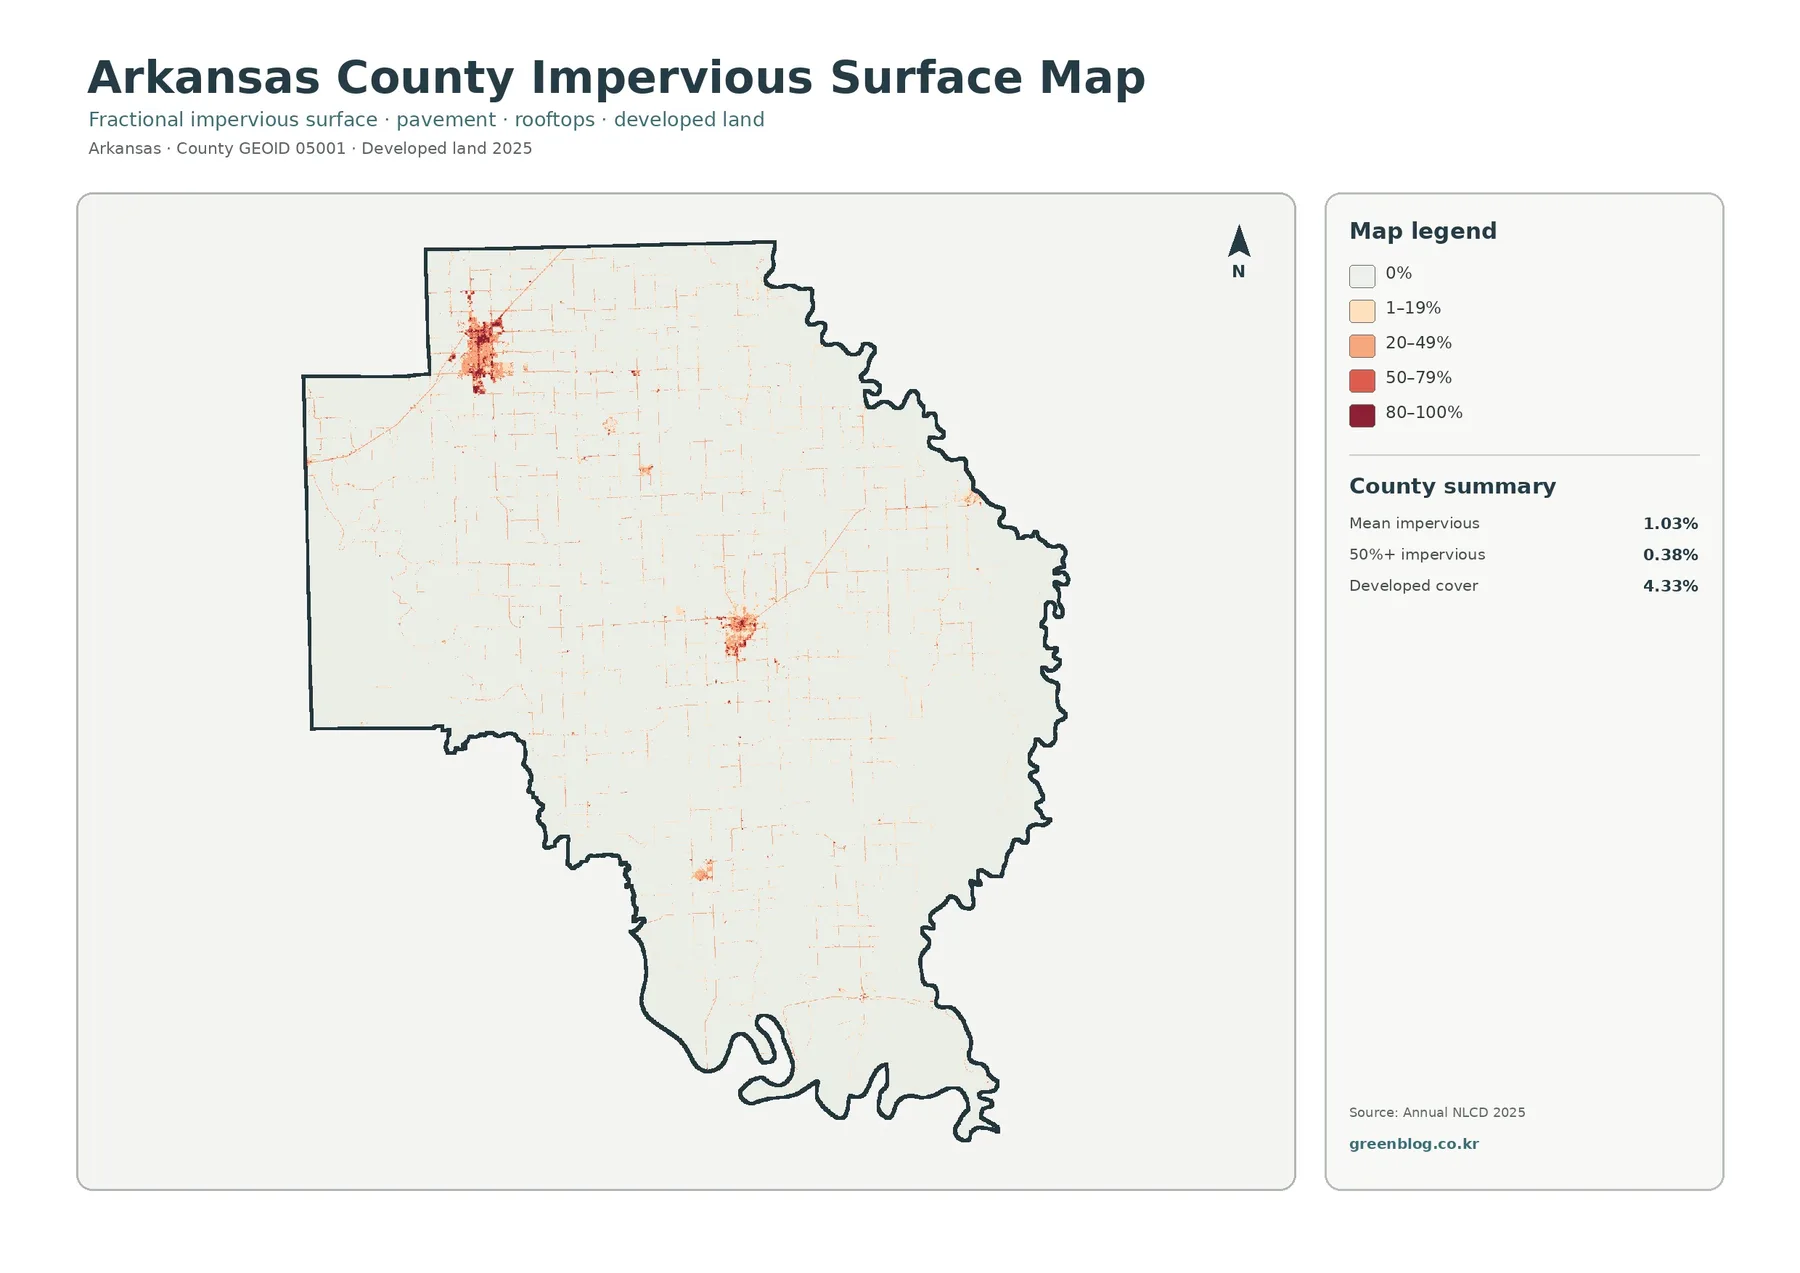
The northwest contains the darkest and largest impervious concentration. A second compact cluster appears near the center, and a smaller one is visible farther south. Outside those places, most of the county is very pale. Thin lines and small marks cross the farm landscape, corresponding to scattered roads and built features rather than a continuous urban surface. The map therefore shows a county with distinct town centers and infrastructure inside a much larger agricultural and wetland setting.
Reading the 5.78% mapped class difference from 1985 to 2025
The change map compares class assignments in 1985 and 2025 rather than simply showing growth. The county summary reports a 5.78% class difference. Of that total, 0.84% is mapped as changed to developed, 0.26% as forest loss, 1.64% as agricultural loss, and 2.09% as other class difference. The map also includes a wetland-difference category. These values should be read as mapped classification differences between two dates, not as a complete record of why every site changed.
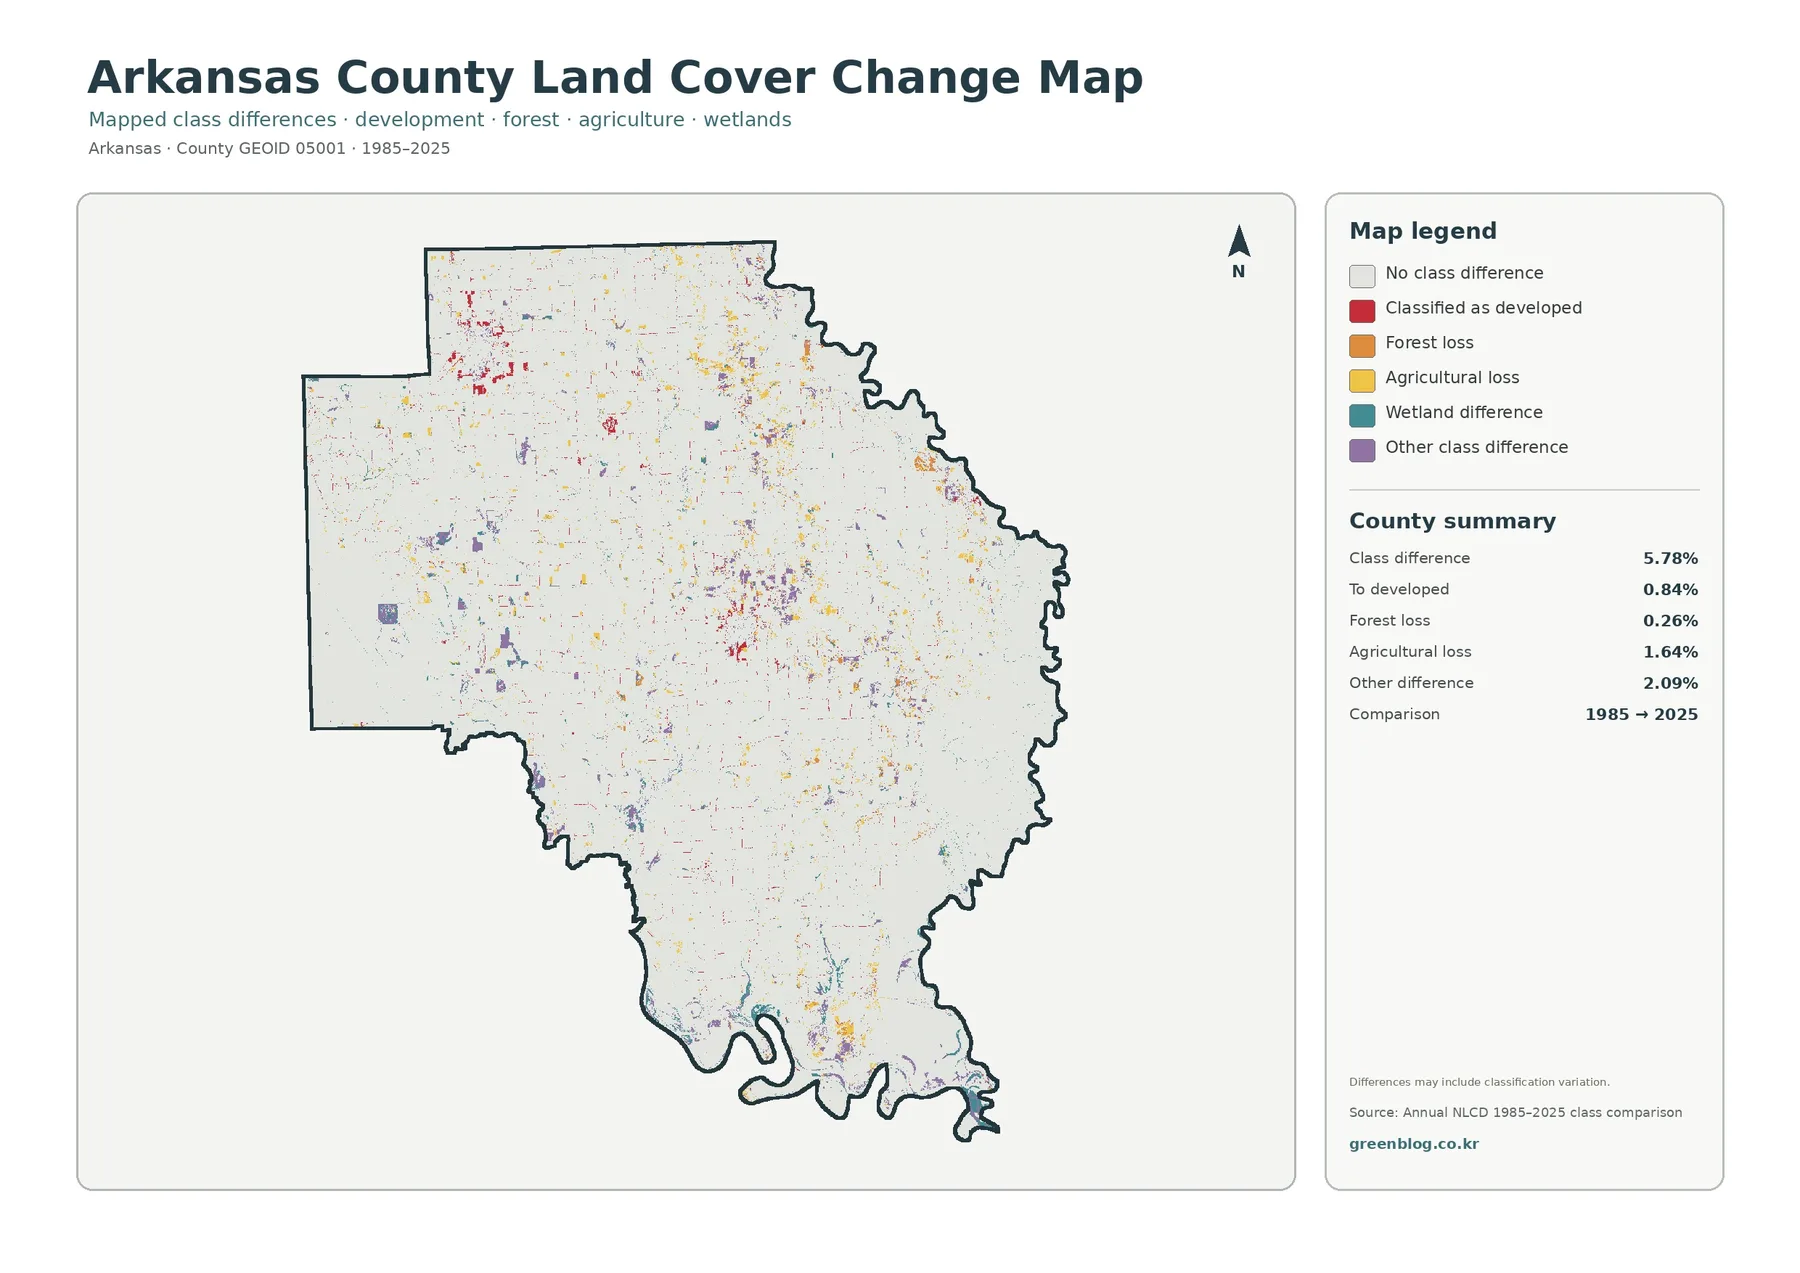
Red developed-change marks are most noticeable around the northwest and central developed concentrations, with smaller red features elsewhere. Agricultural-loss cells are more dispersed and appear across several parts of the farmed interior. Purple other-difference cells are scattered rather than forming one continuous zone. Wetland-difference marks occur in parts of the eastern and southern wetland landscape, where water conditions and wetland boundaries can be especially sensitive to image date and classification rules.
Why the same place looks different across all four maps
Each map answers a different practical question. The general land-cover map is the best starting point for the 2025 mix of agriculture, wetlands, developed land, forest, and water. The forest-and-farmland map strips the display down to classes that help compare cultivated and natural cover. The impervious map focuses on how much hard surface is present within each cell. The change map ignores most unchanged 2025 cover and highlights cells whose classification differs between the two comparison years.
Download the four original JPG maps and choose the right view
The ZIP contains four separate JPG files: the Arkansas County land-cover map, forest-and-farmland map, impervious-surface and developed-land map, and 1985–2025 land-cover change map. For a quick county profile, pair the general map with the forest-and-farmland view. For a presentation about towns and infrastructure, add the impervious map. When investigating where a later image or local record might be useful, the class-difference map can help identify areas that merit a closer look.
Each original JPG is 2480 × 1754 pixels. The supplied asset manifest does not mark that size as meeting its A3 high-resolution reference, so large-format printing should be checked at the intended output size before use. Keep the aspect ratio when placing a map in a document or slide. If a map is cropped, retain the legend and county-summary panel whenever possible so readers can still tell what the colors and percentages mean.
A 30-meter raster is useful for patterns, not parcel surveying
Annual NLCD is raster data built from 30-meter cells. In plain terms, the landscape is divided into square cells and each cell receives a representative classification. A single cell can contain a crop field edge, drainage ditch, road, trees, and bare ground at the same time. The final class simplifies that mixture. Narrow levees, small channels, roadside development, field borders, and individual buildings may therefore be absorbed into a surrounding class or appear less precisely than they would in high-resolution aerial imagery.
Frequently Asked Questions
What is the largest land-cover class in Arkansas County?
Agriculture is the largest 2025 class at 55.01%. Wetlands are second at 33.08%, followed by developed land at 4.33%, forest at 3.65%, and water at 3.32%. The forest-and-farmland summary also lists grassland at 0.15% and shrubland at 0.14%. Because agriculture and wetlands together make up most of the county, their boundary is the most useful feature to examine first.
Why is developed land 4.33% while mean impervious surface is only 1.03%?
Developed land is a land-cover class, while impervious surface measures the share of a cell covered by hard materials such as pavement and rooftops. Developed cells can include grass, trees, soil, and other permeable ground. In this map set, only 0.38% of the county is mapped at 50% impervious surface or higher, which is why the darkest hard-surface areas are limited to a few compact concentrations.
Does the 5.78% class difference mean that 5.78% of the county definitely changed land use?
No. It means 5.78% of the mapped cells received different land-cover classifications in the 1985 and 2025 comparison. The summary includes 0.84% changed to developed, 0.26% forest loss, 1.64% agricultural loss, and 2.09% other class difference. Classification rules, image conditions, mixed cells, and changing water or wetland boundaries can also influence the comparison, so site-specific conclusions require additional evidence.
Map File Information
Arkansas County Land Cover Four-Map Package
- File Type: Four JPG files in one ZIP archive
Related Maps
- Following 75 County Shapes Across an Arkansas Map
- Albany County Land Cover Map
- Allegany County New York Land Cover Map
Sources and references
- MRLC Annual NLCD Data — Official access point for Annual NLCD land-cover products and related data.
- USGS Annual NLCD Land Cover Classification — Official explanation of Annual NLCD classes and the raster classification framework.
- U.S. Census Bureau TIGER/Line Shapefiles — Official geographic boundary data used for county and state reference.
- Arkansas County Extension Office — University of Arkansas Cooperative Extension page for the DeWitt and Stuttgart offices and local research-based information.
- Dale Bumpers White River National Wildlife Refuge — U.S. Fish and Wildlife Service background on the White River floodplain, bottomland hardwood forest, lakes, streams, sloughs, and bayous.
Green Map creates custom-edited map images using open geographic data sources such as geoBoundaries, Natural Earth, OpenStreetMap, and government open data.
These maps are edited visual materials, not raw data files, and are provided for education, documents, presentations, and graphic reference.