The Albany County Land Cover Map shows a county with two very different visual patterns. The eastern side, including Albany and the Capital District edge, is dominated by developed cover and denser impervious surfaces. Farther west, forests become the largest part of the landscape, with farmland woven through the wooded interior. The 2025 summary reports 47.01% forest, 25.79% developed land, 17.52% agriculture, 6.96% wetlands, and 1.54% water, making the contrast between the urban east and the more rural west easy to see.
This page brings together four views of the same county: general land cover, forest and farmland, impervious surface and developed land, and mapped land-cover change from 1985 to 2025. You can compare the web maps below, then download all four original JPG maps in one ZIP file from the download section. That makes the set useful for classroom work, presentations, printed reference sheets, and projects that need the map images as separate files rather than only on-screen previews.
Table of Contents
A county shaped by an urban east and wooded west
Albany County is easiest to understand by starting with its east-to-west contrast. Developed cover is concentrated along the eastern and northeastern side of the county, where Albany and surrounding communities form part of the Capital District. Roads, neighborhoods, commercial areas, and other built environments create a broad developed zone rather than isolated spots. Moving westward, that pattern quickly becomes less continuous. Forest and agricultural cover take over more of the map, and the built-up areas are smaller and farther apart.
The transition is not a clean dividing line. Forest patches remain inside and around developed areas, while farms, roads, and small settlements interrupt the western woodland. That mixture matters because a countywide percentage alone cannot show how land-cover classes meet on the ground. Looking at the map reveals where urban cover fades into a more rural landscape and where agriculture occupies openings within a larger forested setting.
What the 2025 land-cover map shows
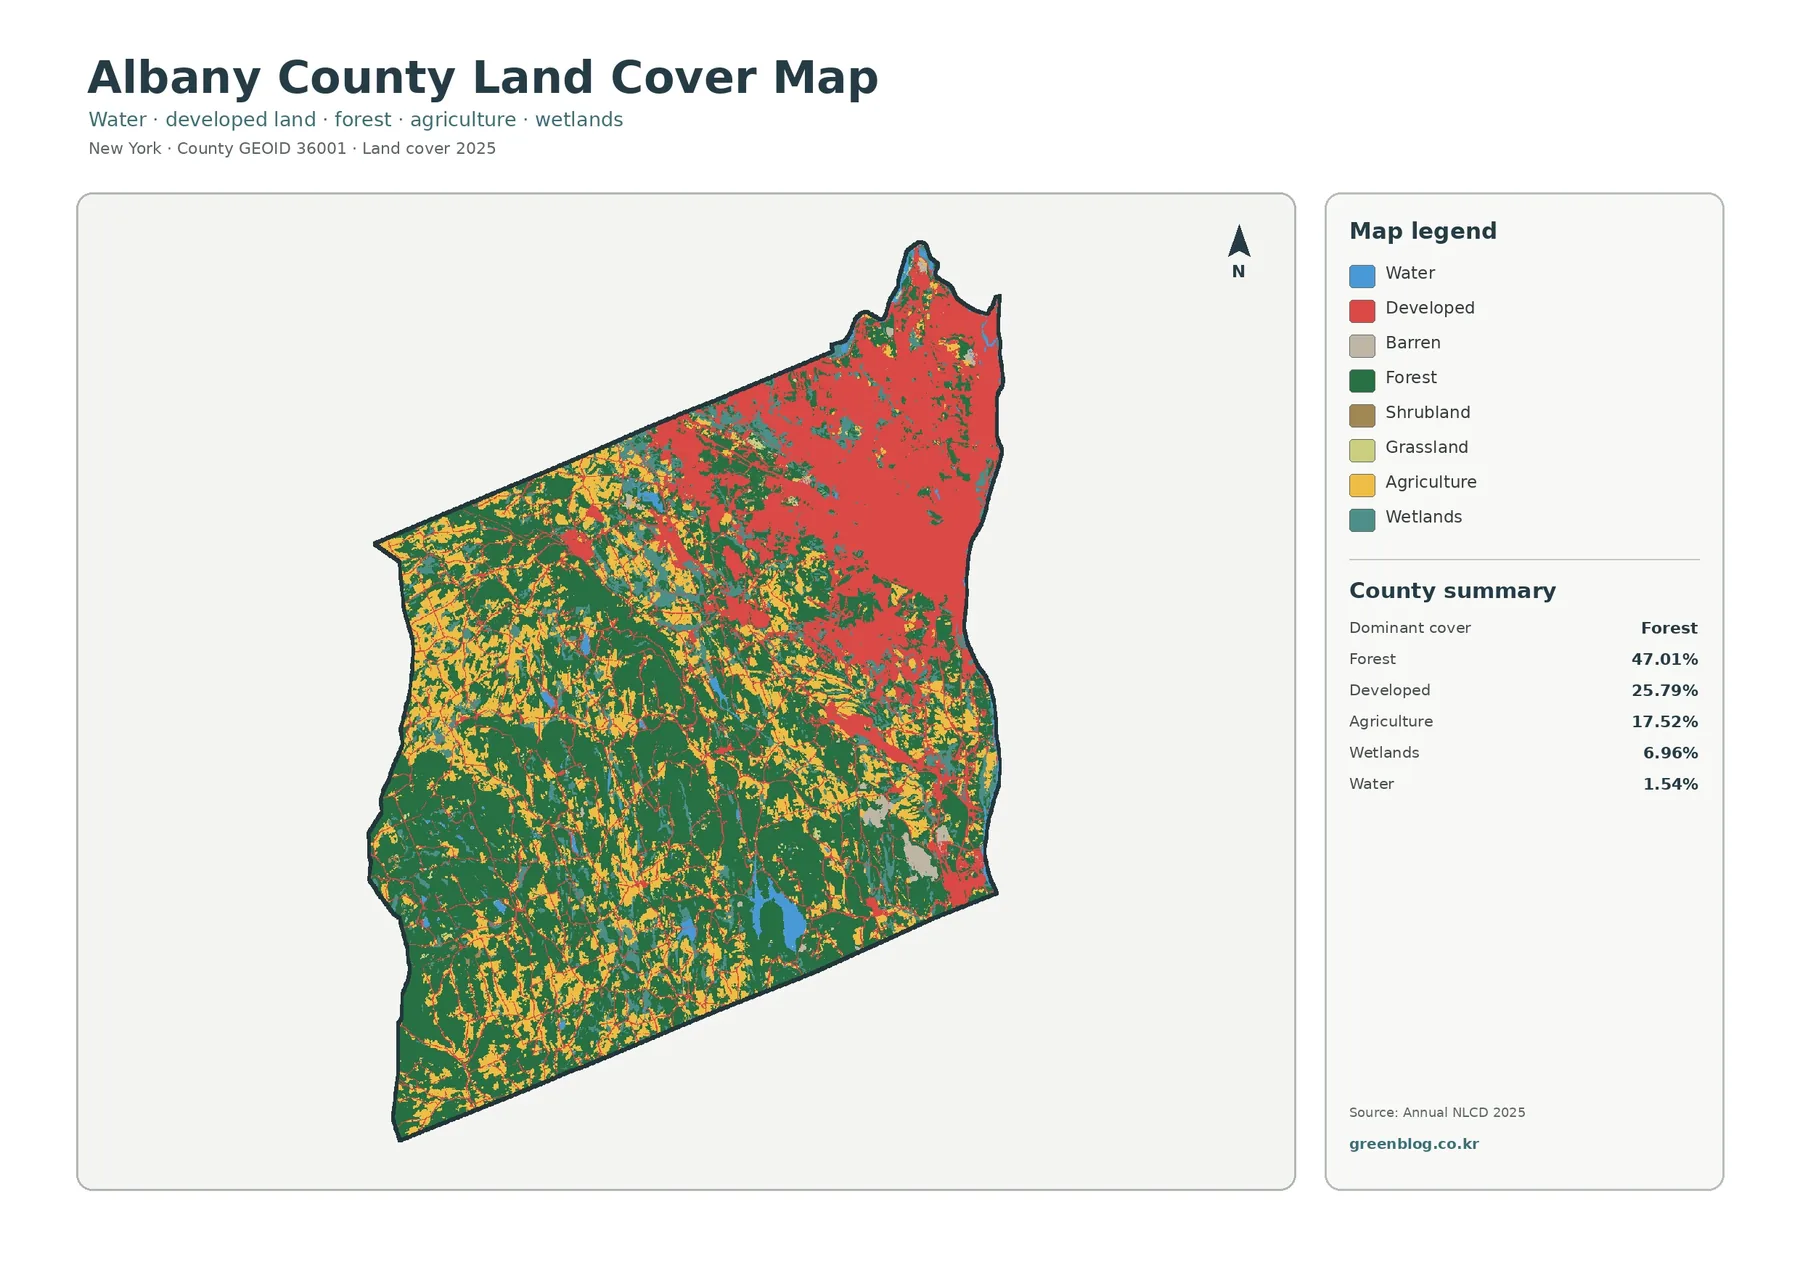
Forest is the dominant mapped cover at 47.01%, and its largest continuous areas appear in the western and southwestern parts of the county. Agriculture accounts for 17.52% and is spread through many of the openings within that forested half. Rather than forming one single agricultural block, farms appear as irregular patches and bands, especially across the west and central interior. This pattern gives the rural landscape a mixed appearance in which wooded land and agricultural land repeatedly meet.
Developed cover, at 25.79%, is the second-largest category and is concentrated much more strongly in the east. It is important not to read that percentage as the amount of pavement or rooftops. Developed land in the NLCD classification can include lower-density built environments where lawns, trees, and other non-impervious surfaces are still present. Wetlands make up 6.96% and occur in scattered patches across the county, while water represents 1.54% and appears in smaller interior features and along mapped water bodies. The general map is therefore the best starting point when you want to understand the overall arrangement of the county rather than one specific cover type.
Forest and farmland across the rural interior
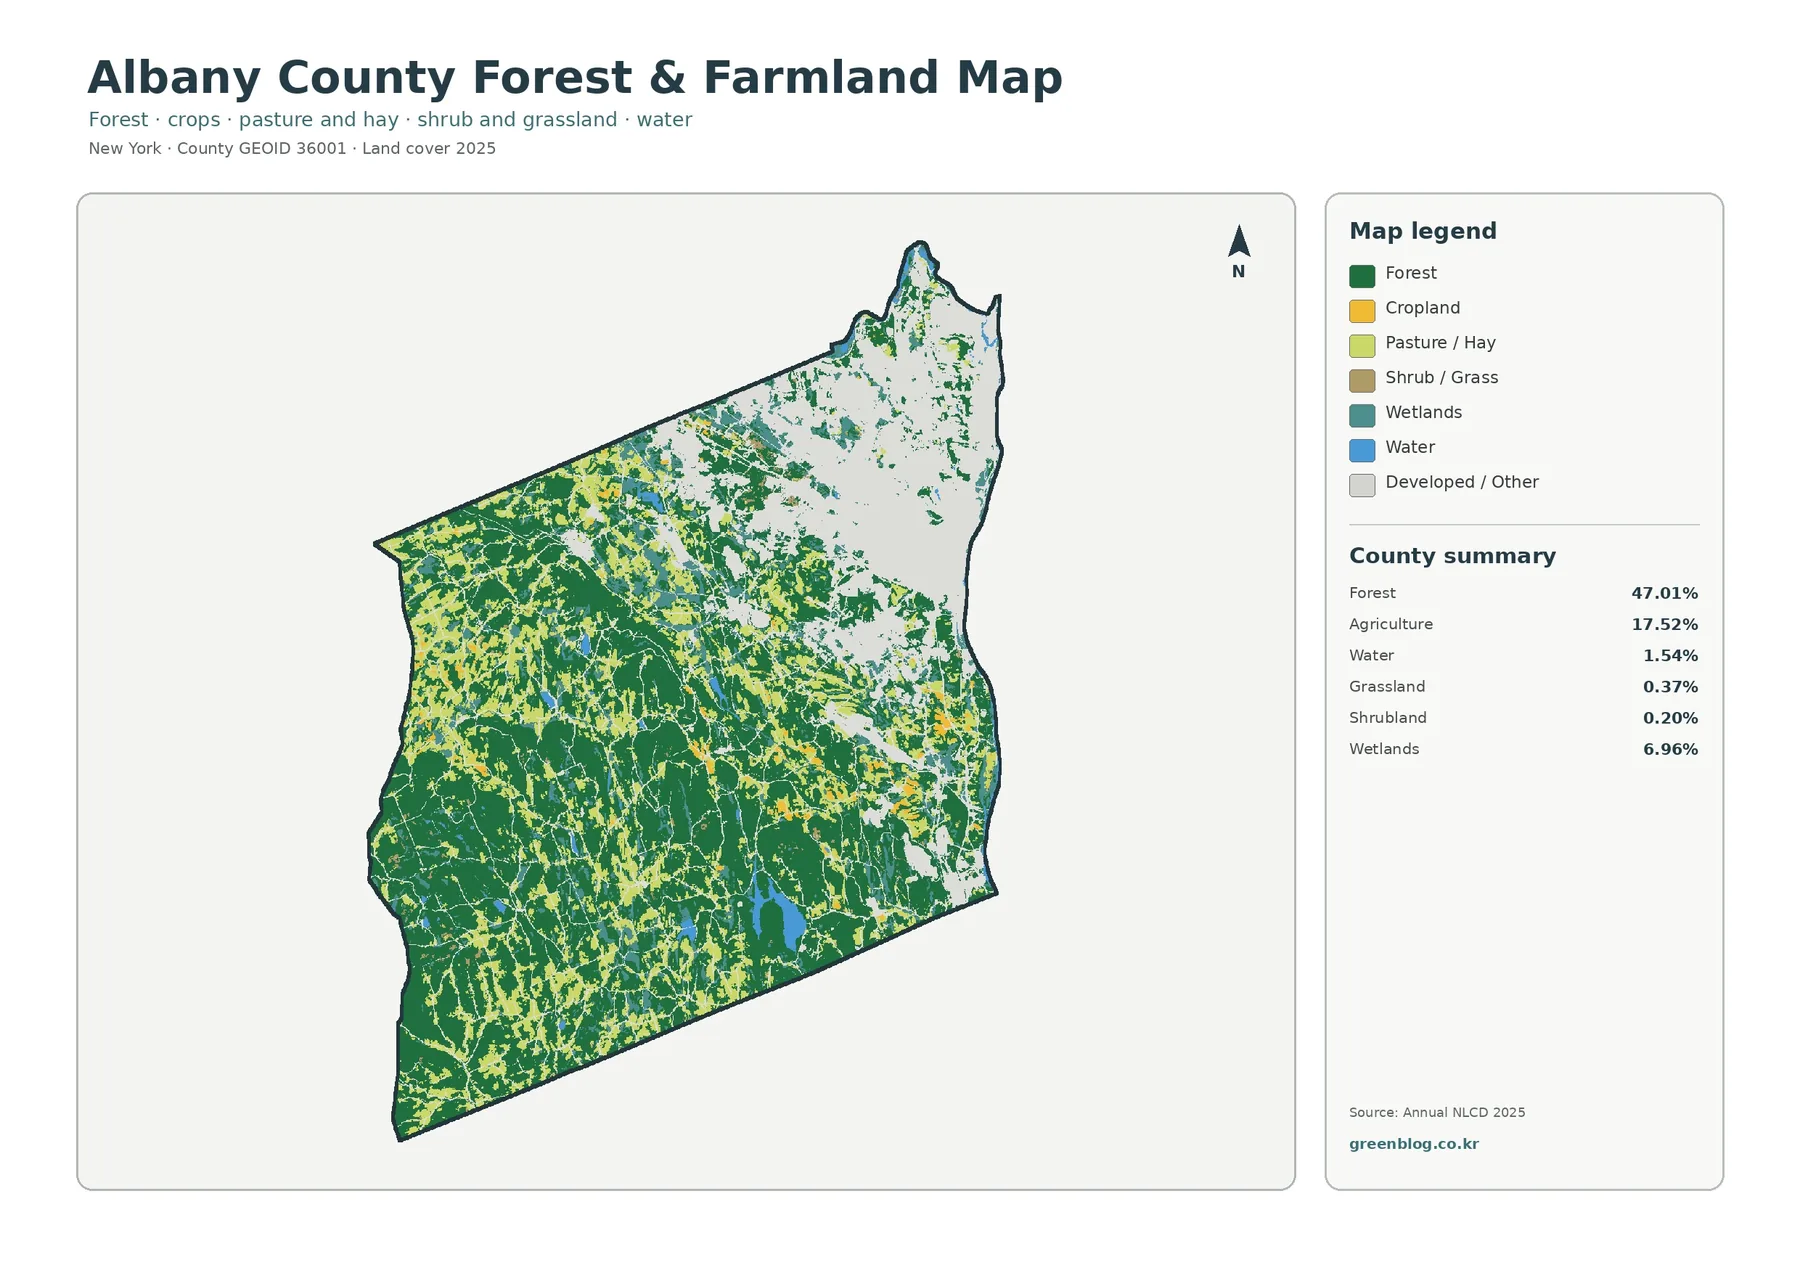
The forest-and-farmland view strips away much of the visual detail associated with the urban classes and makes the rural half of the county easier to interpret. Forest remains extensive across the west and southwest, but agricultural areas cut through it in many shapes and sizes. Some fields form broader clusters, while others follow narrower openings near roads and settlements. The result is a patchwork rather than a simple forest block, which is useful when comparing where farming is most visible against the larger wooded setting.
The map summary also separates smaller categories that can be lost in the general view. Grassland is listed at 0.37% and shrubland at 0.20%, alongside the 6.96% wetlands and 1.54% water. Those values are small countywide, but the mapped locations still matter when studying habitat, open land, or wet areas. This map works especially well for environmental education because it allows viewers to focus on the relationship among forest, agriculture, wetlands, and water without the developed classes taking over the visual emphasis.
Impervious surfaces make the Capital District edge stand out
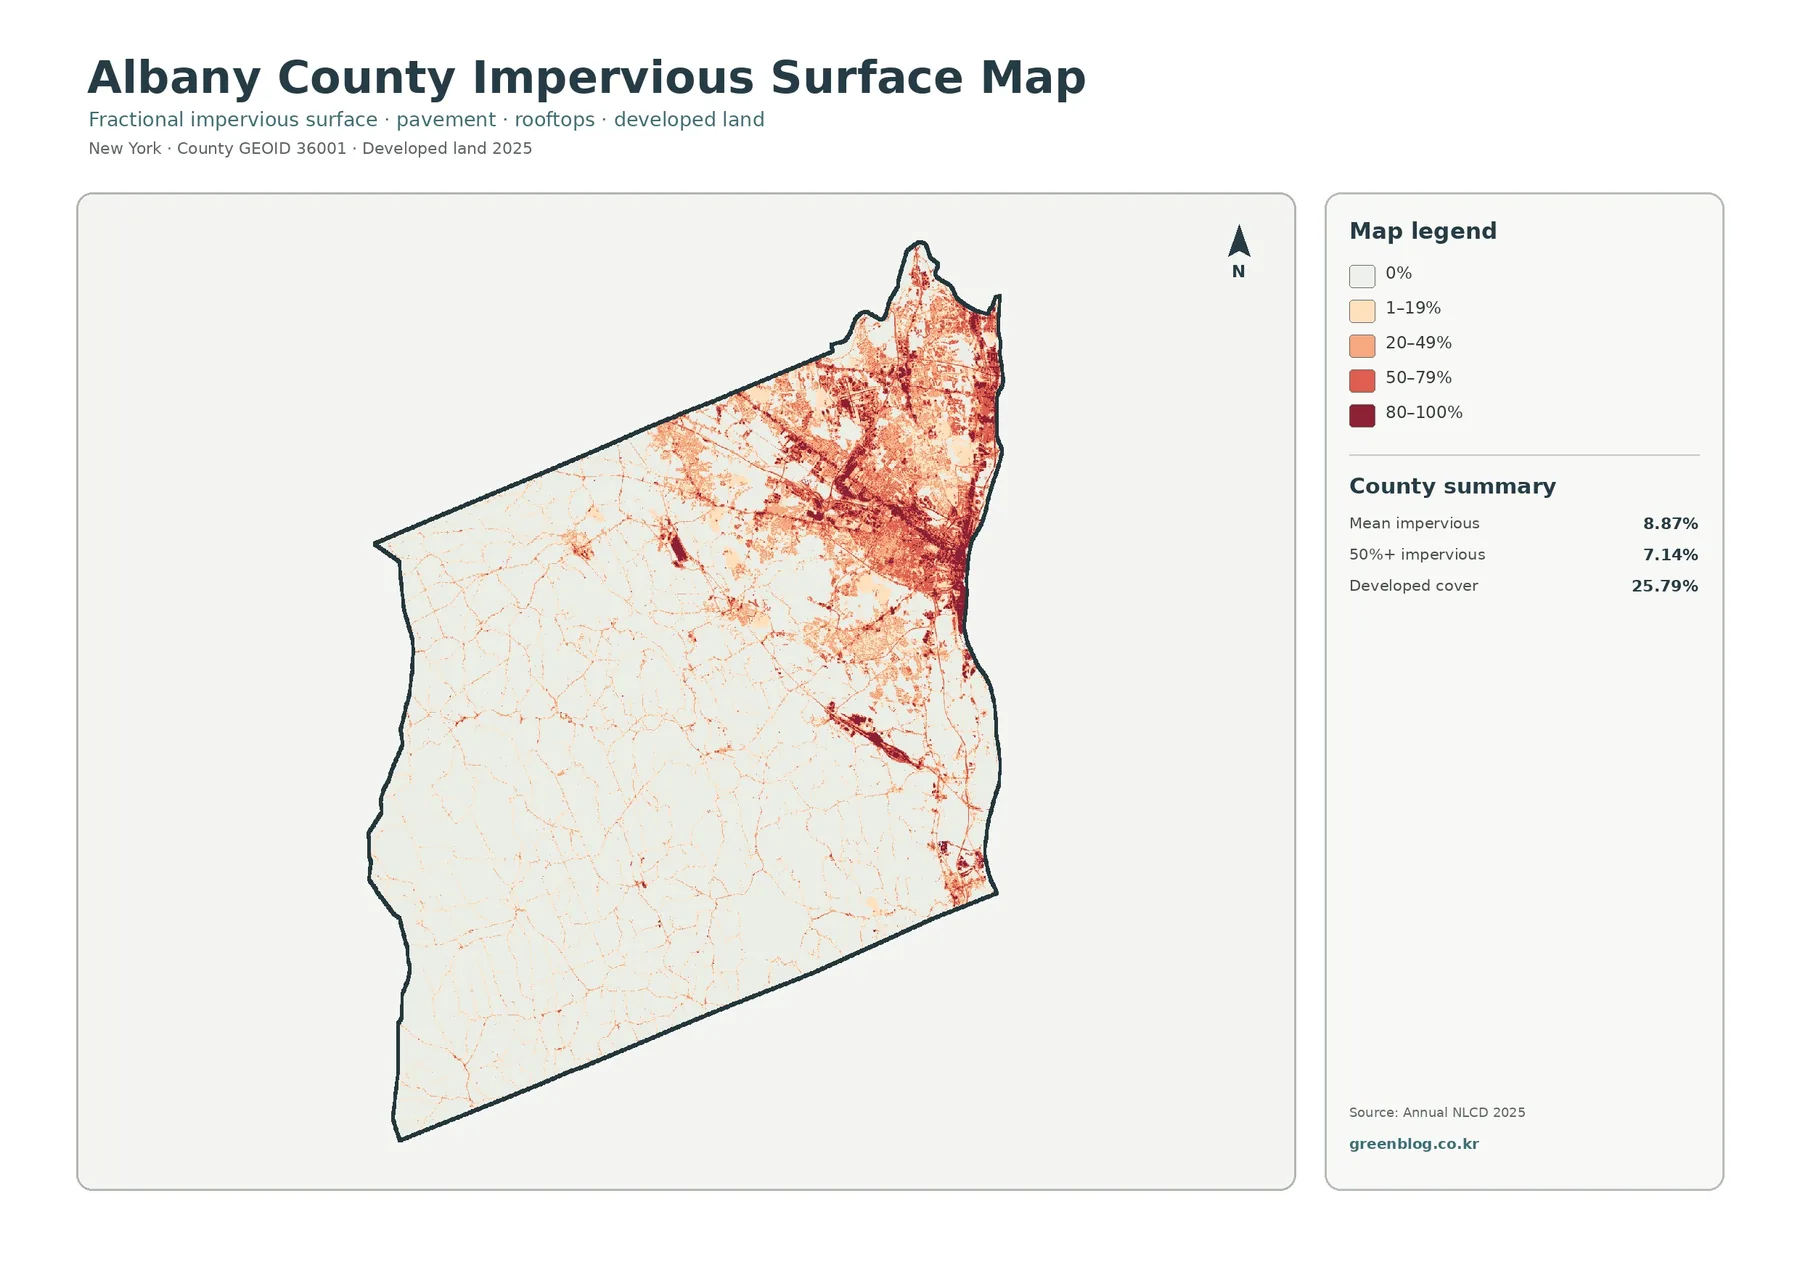
The impervious-surface map tells a different story from the broad developed-land category. Darker reds represent places where a larger share of each cell is covered by pavement, rooftops, parking areas, and other surfaces that do not readily absorb water. These darker values are concentrated in the eastern urban area and along major transportation and settlement corridors. In contrast, most of the western county is pale, with only narrow lines and small clusters marking roads or local development.
The county summary gives a mean impervious value of 8.87%, with 7.14% of the county mapped at 50% or more impervious surface. Those figures are much lower than the 25.79% developed-cover share because they measure a different thing. Developed land is a land-cover class, while impervious percentage estimates how much of a cell is actually occupied by hard surfaces. Comparing both maps helps separate the broad footprint of settlement from the places where built surfaces are most concentrated.
Mapped differences between 1985 and 2025
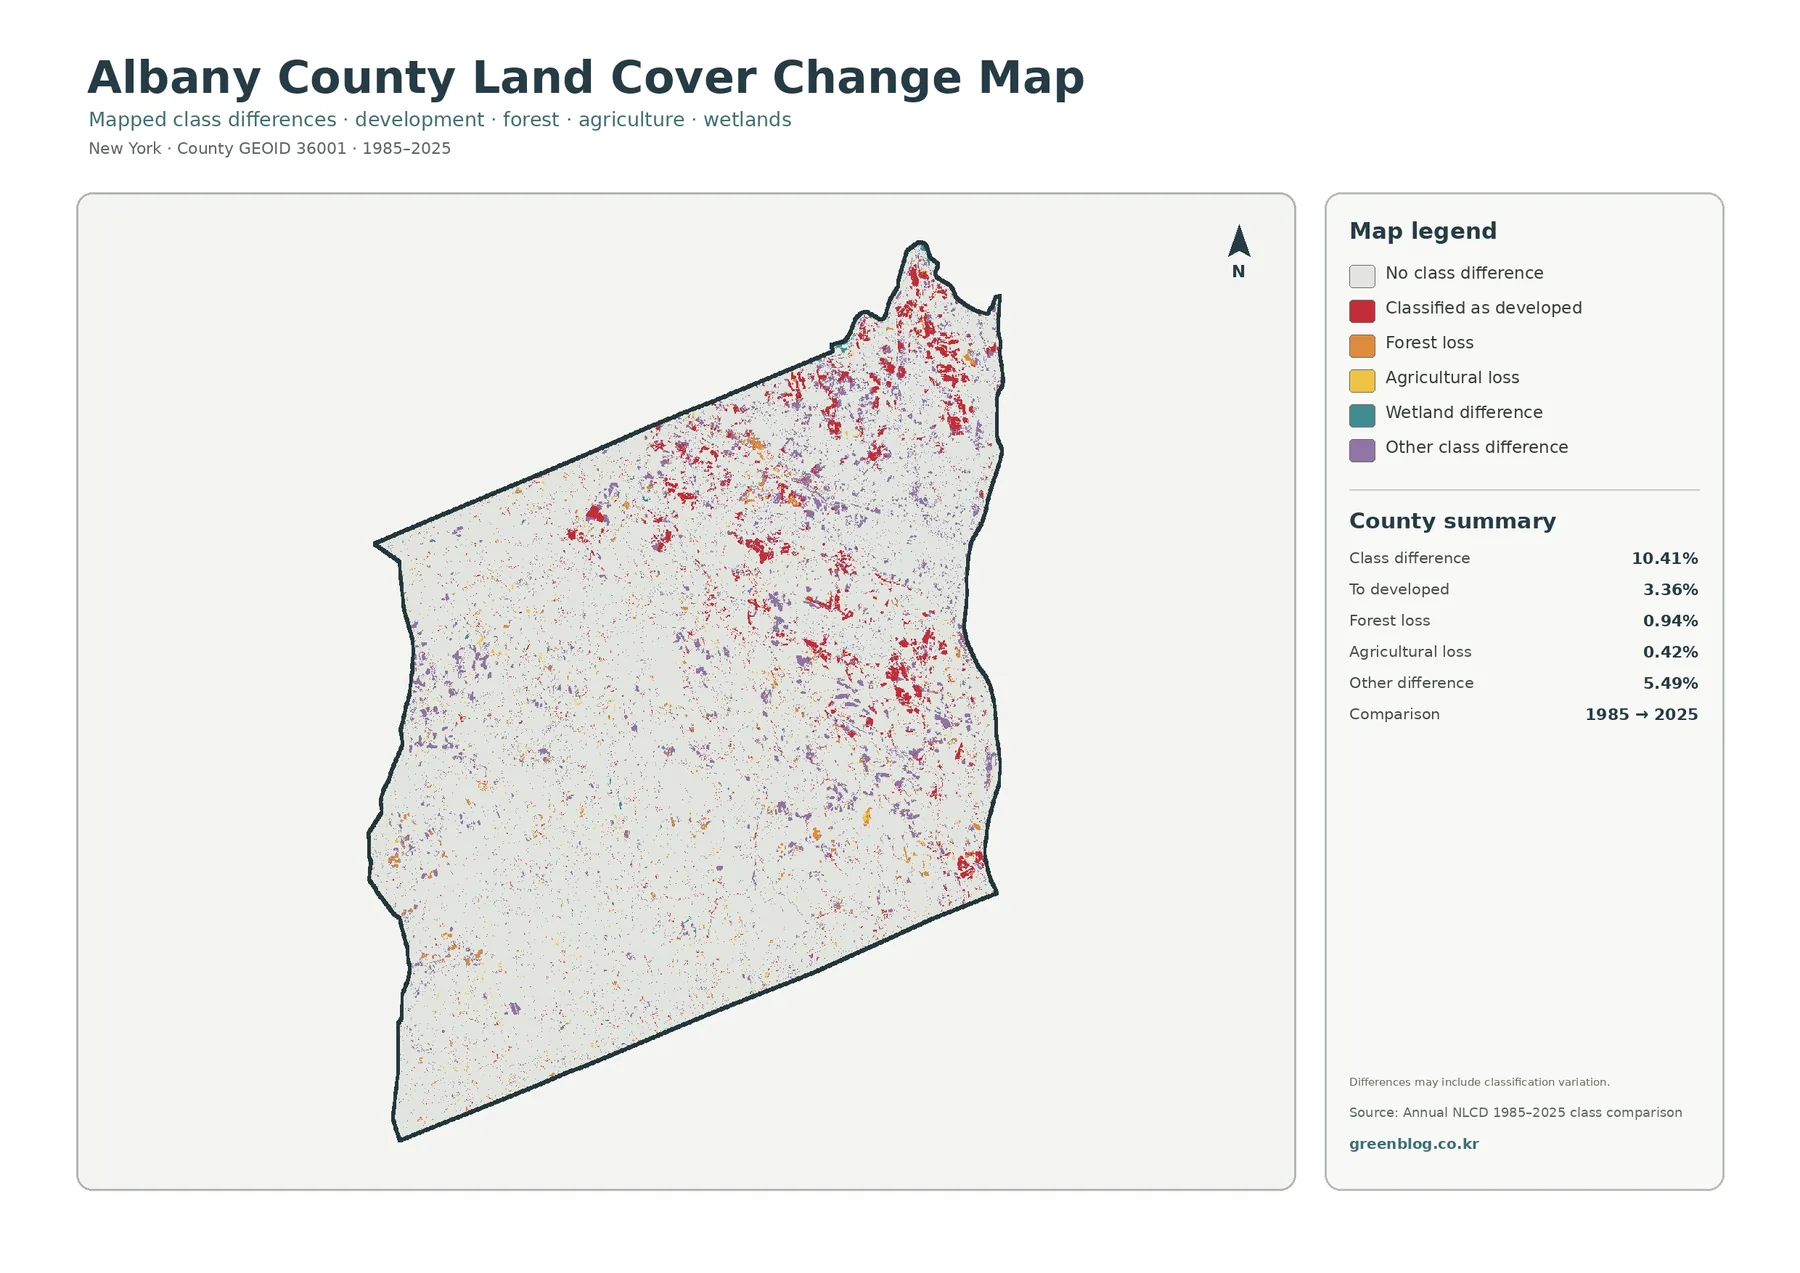
The change map highlights locations where the mapped class differs between 1985 and 2025. The county summary reports class differences across 10.41% of the county. Of that total, 3.36% is shown as classified to developed land, 0.94% as forest loss, 0.42% as agricultural loss, and 5.49% as other class differences. The colored cells are noticeably more frequent in the eastern and northeastern portion of the county, although smaller scattered changes also appear across the rural interior.
These colors should be treated as a guide to where the classification changed, not as a parcel-by-parcel development history. Some differences may reflect real land-cover conversion, but classification variation, mixed pixels, and changes near class boundaries can also affect the comparison. A gray or unchanged cell does not prove that nothing happened on the ground for forty years, and a colored cell does not by itself explain why the change occurred. For a detailed historical question, the change map is best used to identify places that deserve closer review with aerial imagery, local planning records, or other time-series sources.
Natural cover remains important inside the developed side of the county
The eastern side may be the county’s urban core, but it is not uniformly built. Forest, shrub, grass, wetlands, and other natural cover remain within and around developed areas. The Albany Pine Bush is a useful reminder that distinctive natural communities can persist close to the metropolitan landscape. On the maps, non-developed patches break up the broad red developed zone and show that urban land cover is more varied than the county summary alone might suggest.
Wetlands also deserve attention because they are distributed in smaller patches that can be easy to overlook next to the large forest and developed categories. Their countywide share is 6.96%, and the map places them in multiple parts of the county rather than in one single concentration. The land-cover layer is useful for regional comparison, but it is not a legal wetland boundary. Any project involving regulation, permitting, or site-specific environmental review would need current official wetland and parcel information in addition to this generalized map.
Choosing the right map for the question
Use the general land-cover map when you need the quickest countywide overview. It shows where forest, development, agriculture, wetlands, and water sit in relation to one another. The forest-and-farmland map is better when the purpose is to compare rural cover types without the full developed-class detail. For urban runoff, pavement, rooftops, or the intensity of built surfaces, the impervious map gives a clearer answer than the broad developed category. The change map is most useful when you want to locate areas where the classification differs across the 1985–2025 comparison.
The four maps also work well as a sequence. Start with the general map to identify a part of the county, use the specialized map to examine the relevant cover type, and then check the change layer if you want to know whether that location is part of a larger long-term pattern. In a classroom, the set can demonstrate how the same county looks different depending on the variable being mapped. In a presentation, pairing the impervious and land-cover maps can explain why a broad developed zone is not the same as a fully paved surface.
Important limits of 30-meter land-cover data
Annual NLCD products are designed for broad land-cover analysis, not legal boundary work. The raster cells are generalized, and a 30-meter cell can contain more than one surface type. Narrow streams, small roads, individual buildings, lawns, tree cover, and field edges may be represented by the dominant or best-fitting class rather than as separate features. That is why map colors should not be treated as exact parcel lines or property boundaries.
Land cover is also different from zoning, ownership, or legally defined land use. It describes what covers the ground—such as forest, agriculture, water, wetlands, or developed surfaces—based on classified imagery and related data. A parcel could be legally zoned for one purpose while its current surface cover appears as another category. For site-specific decisions, combine this map with current local planning, parcel, wetland, flood, or field-survey information appropriate to the task.
Download the Albany County map files
The maps embedded in the article are convenient for quick viewing, but the downloadable package is better when you need the images as files. The ZIP contains the four original JPG maps: general land cover, forest and farmland, impervious surface and developed land, and land-cover change. Keeping them together makes it easy to move between the countywide overview and the specialized views without saving each web image separately.
Frequently Asked Questions
Does 25.79% developed land mean that one-quarter of the county is paved?
No. Developed land is a land-cover classification and can include low-density developed areas with lawns, trees, or other permeable surfaces. The impervious-surface map is the better source for comparing where pavement, rooftops, and similar hard surfaces are most concentrated.
Do all colored cells on the change map represent confirmed development?
No. They show that the mapped land-cover class differs between the two comparison years. Some cells may reflect real conversion, while others can be influenced by classification variation, mixed pixels, or changes along class boundaries. Additional time-series or local records are needed to explain the cause.
Can I use these maps to identify the exact boundary of a farm, forest parcel, or wetland?
No. The maps are generalized raster products for countywide interpretation. Exact property, regulatory, or wetland boundaries should be checked with the appropriate current parcel and agency datasets.
Map File Information
Albany County Land Cover Four-Map Package
- Included Files: Land cover, forest & farmland, impervious surface, and land-cover change maps
- File Type: Four original JPG files in one ZIP archive
- Intended Use: Printing, education, presentations, and map-based projects
Related Maps
- Allegany County New York Land Cover Map
- Bronx County New York Land Cover Map
- Broome County New York Land Cover Map
Sources and reference material
- MRLC Annual NLCD
- National Land Cover Database class legend and descriptions
- Albany County Natural Resource Conservation and Sustainability
- Albany County farms and agriculture resources
- Albany Pine Bush natural communities
Green Map creates custom-edited map images using open geographic data sources such as geoBoundaries, Natural Earth, OpenStreetMap, and government open data. These maps are edited visual materials, not raw data files, and are provided for education, documents, presentations, and graphic reference.