Bronx County is one of New York City’s five boroughs, and its land-cover pattern is unmistakably urban. Developed classes dominate much of the mapped area, but the borough is far from uniform. Large parks, wooded patches, wetlands, and surrounding water break up the dense built surface and create several clear contrasts within a relatively small county.
This page brings together four Bronx County map themes: general land cover, forest and farmland, impervious surface and developed land, and mapped change from 1985 to 2025. WebP previews are available in the article, while the four original JPG maps can be downloaded together in one ZIP file. Used side by side, the sheets make it easier to compare dense development with parks, water, wetlands, hard surfaces, and long-term classification differences.
Table of Contents
The countywide pattern is urban, but not uniform
The 2025 land-cover map classifies 82.57 percent of Bronx County as developed and 11.68 percent as water. Forest accounts for 3.04 percent and wetlands for 1.95 percent. Grassland appears only in small patches. Those figures explain the map’s strong visual contrast: a broad developed field is broken by water around the county’s edges and by comparatively small but distinct natural areas.
The developed category should not be confused with zoning or a single land use. It can include residential blocks, commercial districts, transportation surfaces, institutional grounds, and other urban settings. Land cover describes what is physically present at the surface from a remote-sensing classification. It does not identify ownership, parcel boundaries, or the legal purpose assigned to a site.
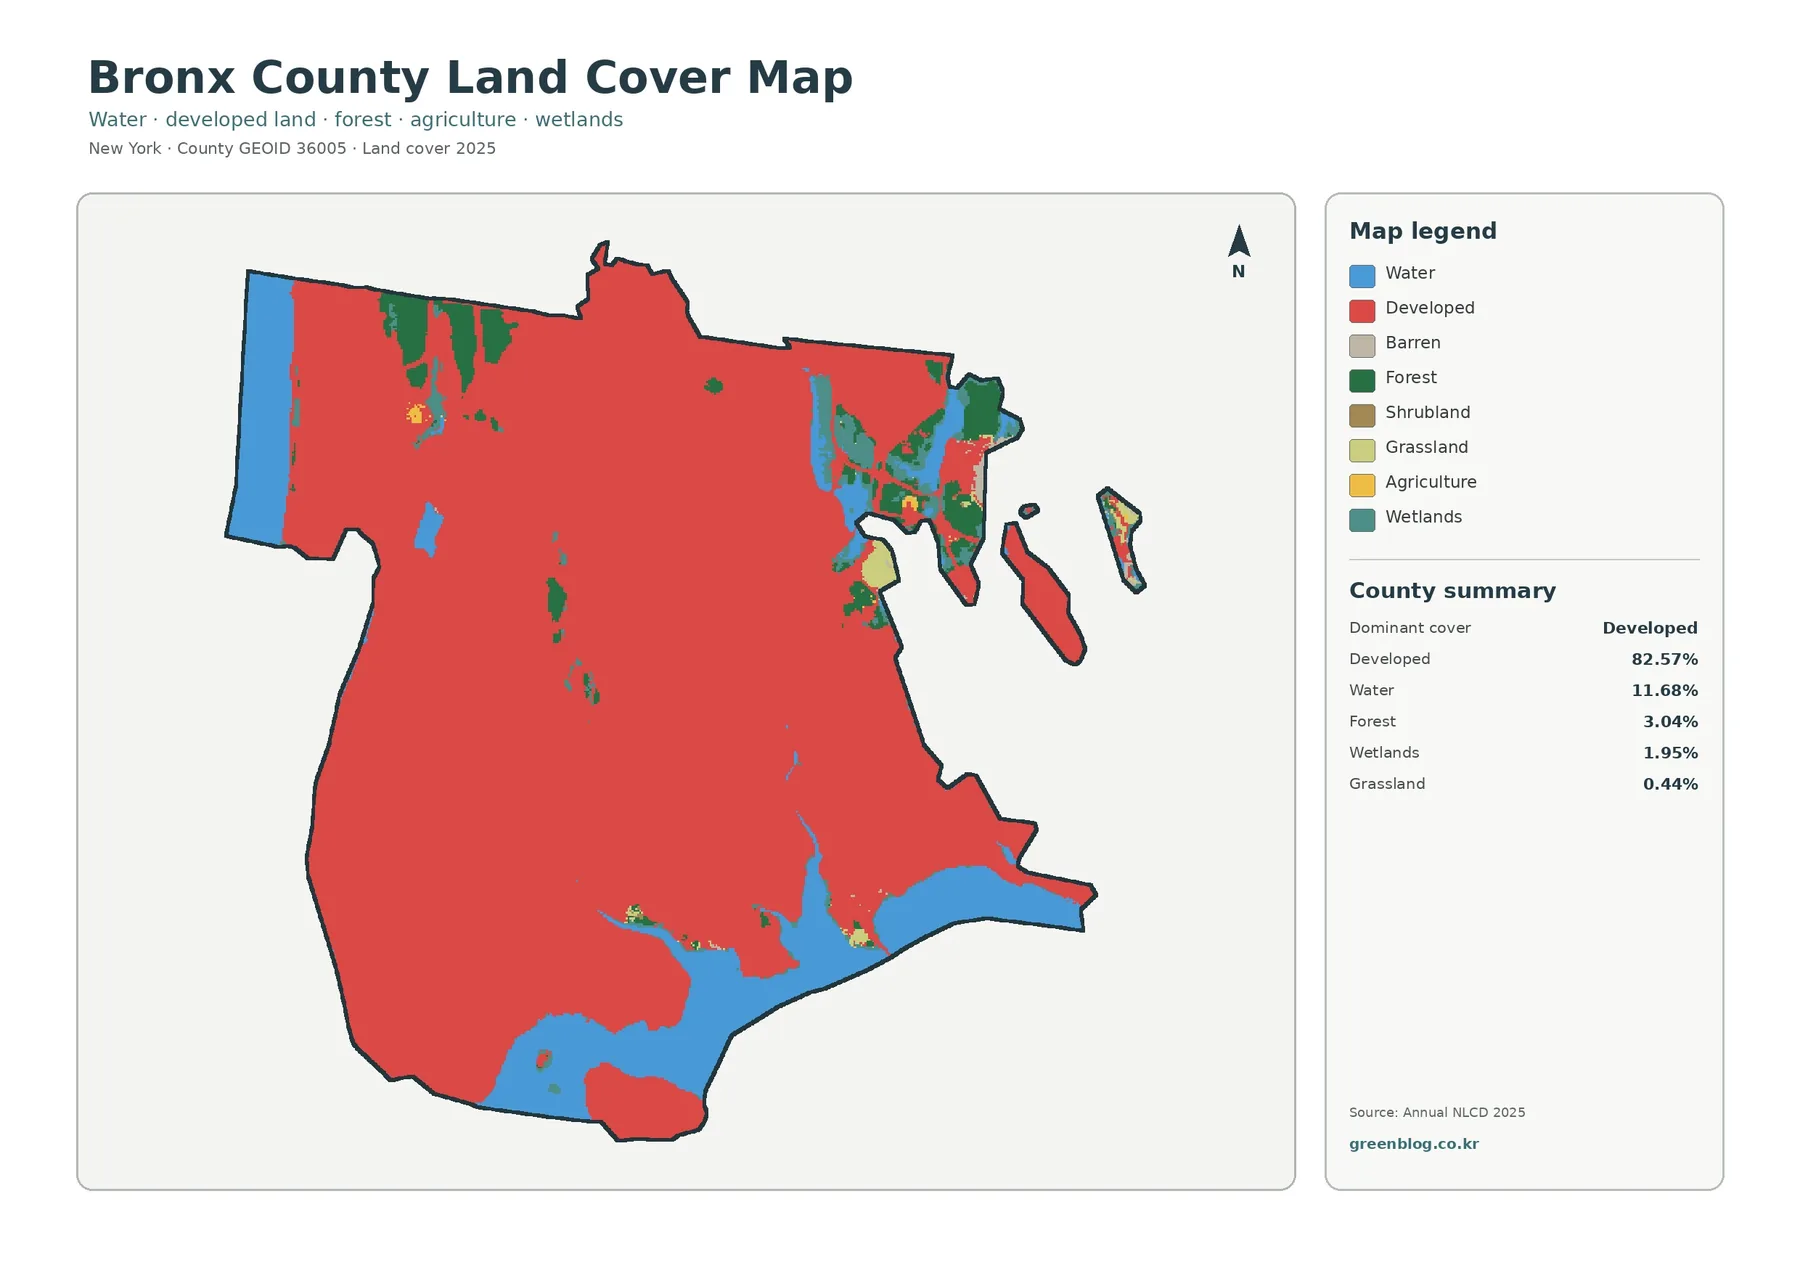
Across much of the south, west, and central Bronx, developed cover forms a nearly continuous field. Larger green breaks become more noticeable toward the north and northeast, while water shapes several outer edges of the county. The eastern waterfront also contains a more intricate mix of land, water, forest, and wetland classes. That mixture is important because the same borough that reads as overwhelmingly urban at first glance still contains several concentrated ecological spaces.
At this scale, a sharp color edge should not be read as a surveyed boundary. The map is built from raster cells, which divide the landscape into a regular grid. Each cell receives a representative class. A block containing trees, pavement, lawn, and buildings can therefore be simplified into one dominant category, especially where different surfaces occur close together.
Forest and wetland patches emerge when development is muted
The forest-and-farmland view changes the emphasis by pushing developed and other surfaces into a neutral background. In Bronx County, agriculture is almost absent: the map summary places it at only 0.08 percent. As a result, the most useful reading is not a farm-versus-forest comparison. Instead, the map helps locate the county’s larger wooded areas, wetland patches, water, and smaller areas of grass or shrub cover.
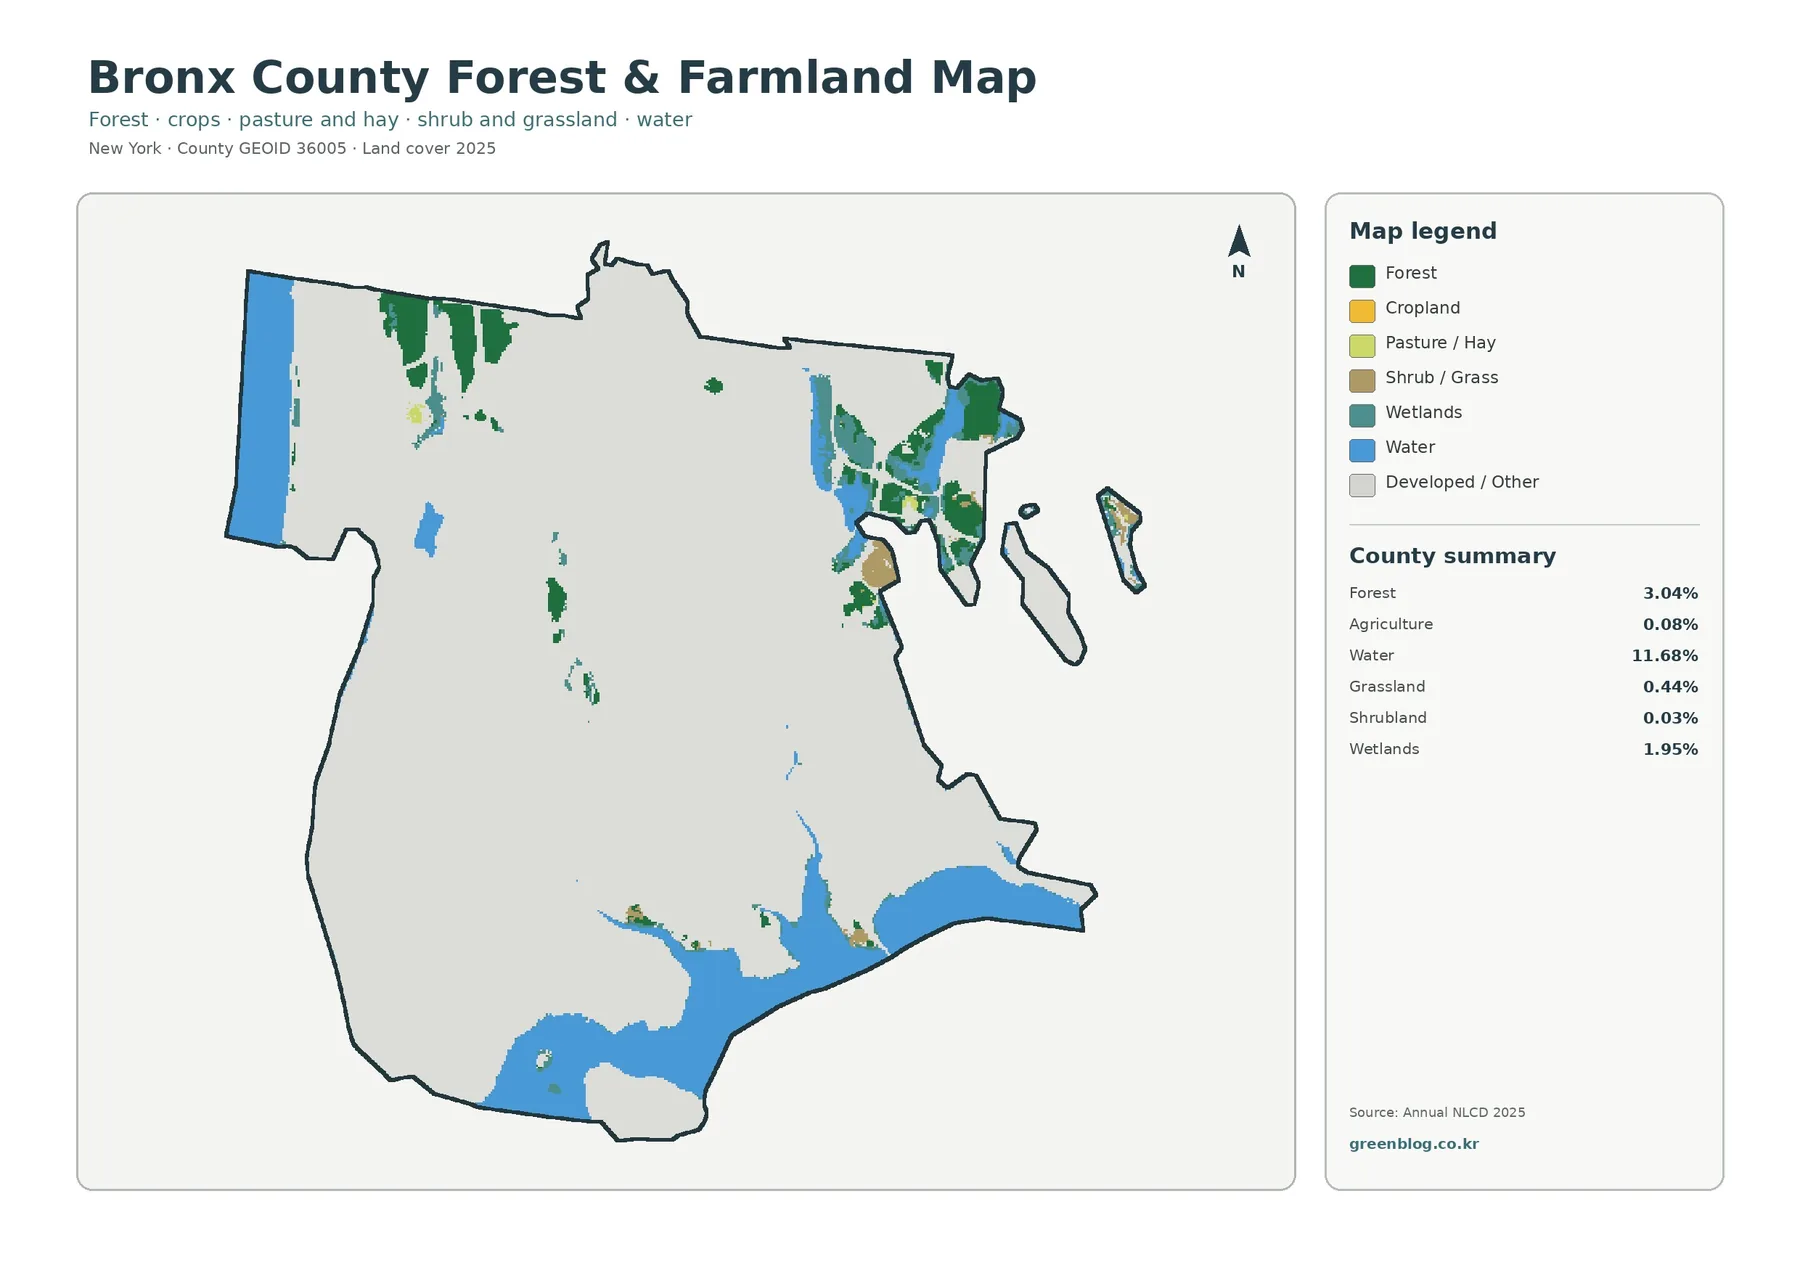
The broadest forest concentrations appear in the northern and northeastern portions of the county, with additional green patches near eastern waterfront environments and smaller fragments elsewhere. When these areas are compared with the general map, they stand out as some of the clearest exceptions to the surrounding urban fabric. The forest class does not mean every pixel is a mature closed-canopy woodland; it is a land-cover classification that summarizes the dominant surface detected within each mapped cell.
Wetlands are especially important to interpret carefully. Their mapped presence near water can help a reader identify places where land and aquatic environments meet, but this is not a regulatory wetland delineation. A planning or permitting decision requires current site-specific information and the appropriate local, state, or federal records. The map is best used to establish context and to decide where a closer review may be warranted.
Because developed land is deliberately subdued in this thematic view, smaller green and wet features become more legible than they are on the general map. This makes the sheet useful for environmental education or for comparing the distribution of natural cover across an otherwise densely urban county.
Impervious cover reveals differences within the built environment
Impervious surface refers to hard cover that limits direct infiltration of rainfall, especially roofs, streets, parking areas, and similar paved surfaces. The Bronx map divides imperviousness into percentage ranges rather than simply labeling a place developed or undeveloped. Its county summary reports a mean impervious value of 53.96 percent, while 65.26 percent of the mapped county falls in cells that are at least 50 percent impervious.
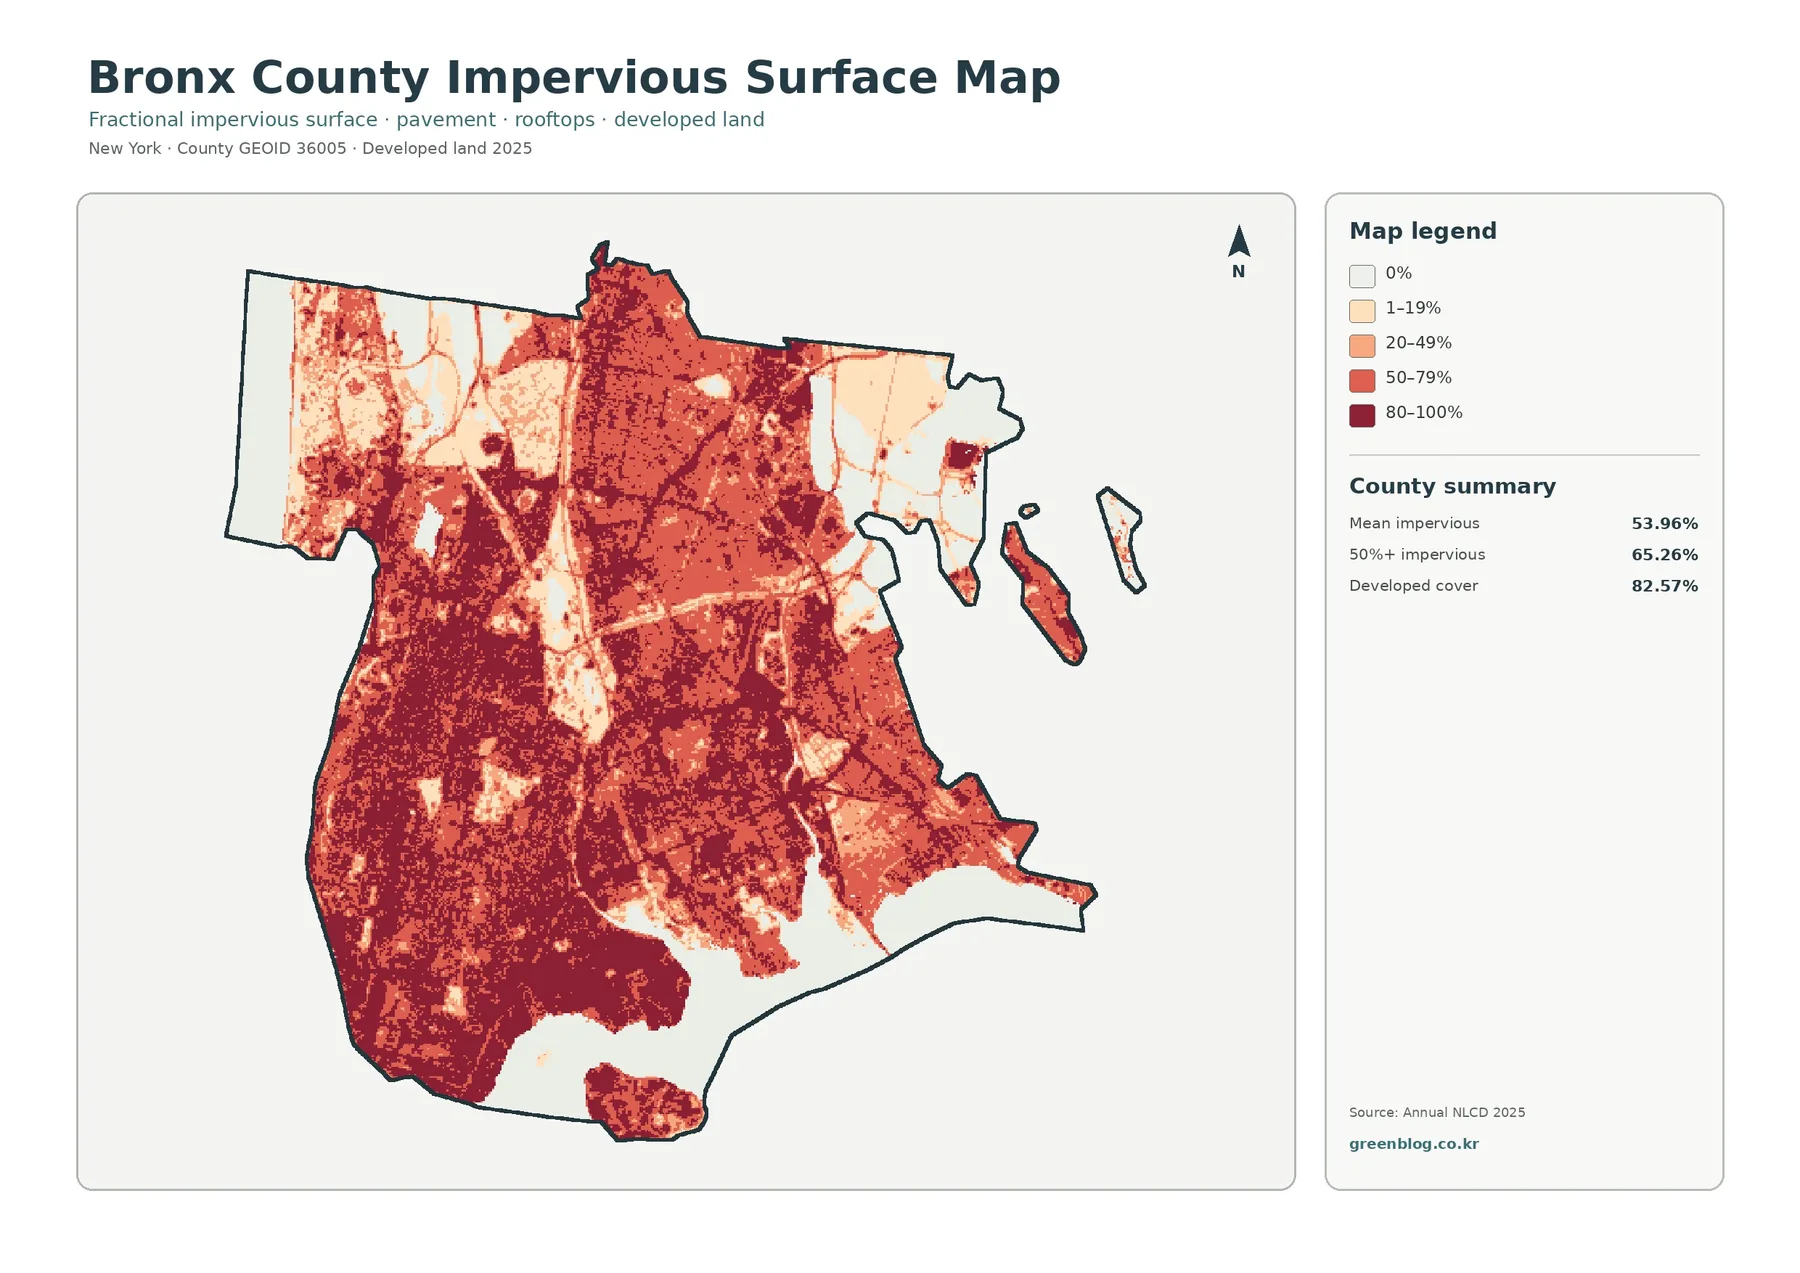
Dark tones cover much of the southern and western Bronx and extend through many central urban districts. Lighter areas interrupt that pattern around major green spaces, water, and locations where vegetation or open ground occupies a larger share of the cell. This distinction is valuable because two places can both be classified as developed on the general map while having very different proportions of pavement, roofs, lawn, trees, or other cover.
The map can support a first look at stormwater context, urban heat research, or comparisons between dense blocks and greener districts. It should not be treated as a flood map, however. Flooding depends on far more than the percentage of impervious cover. Rainfall intensity, drainage infrastructure, elevation, coastal conditions, soil properties, and the capacity of nearby waterways all matter.
Impervious values are also generalized by the raster grid. A narrow street, a line of trees, and adjacent rooftops may be combined inside the same cell. The percentage is therefore most informative as a broad spatial indicator rather than as a measurement of a single lot or building.
The 1985–2025 map flags class differences, not causes
The land-cover change map compares classifications from 1985 and 2025. Most of the county is shown as having no class difference, while colored cells mark locations where the assigned category changed between the two endpoints. The summary reports class differences across 12.01 percent of the county. Of that total, 1.49 percent is mapped as change to developed, while 10.34 percent falls under other class differences.
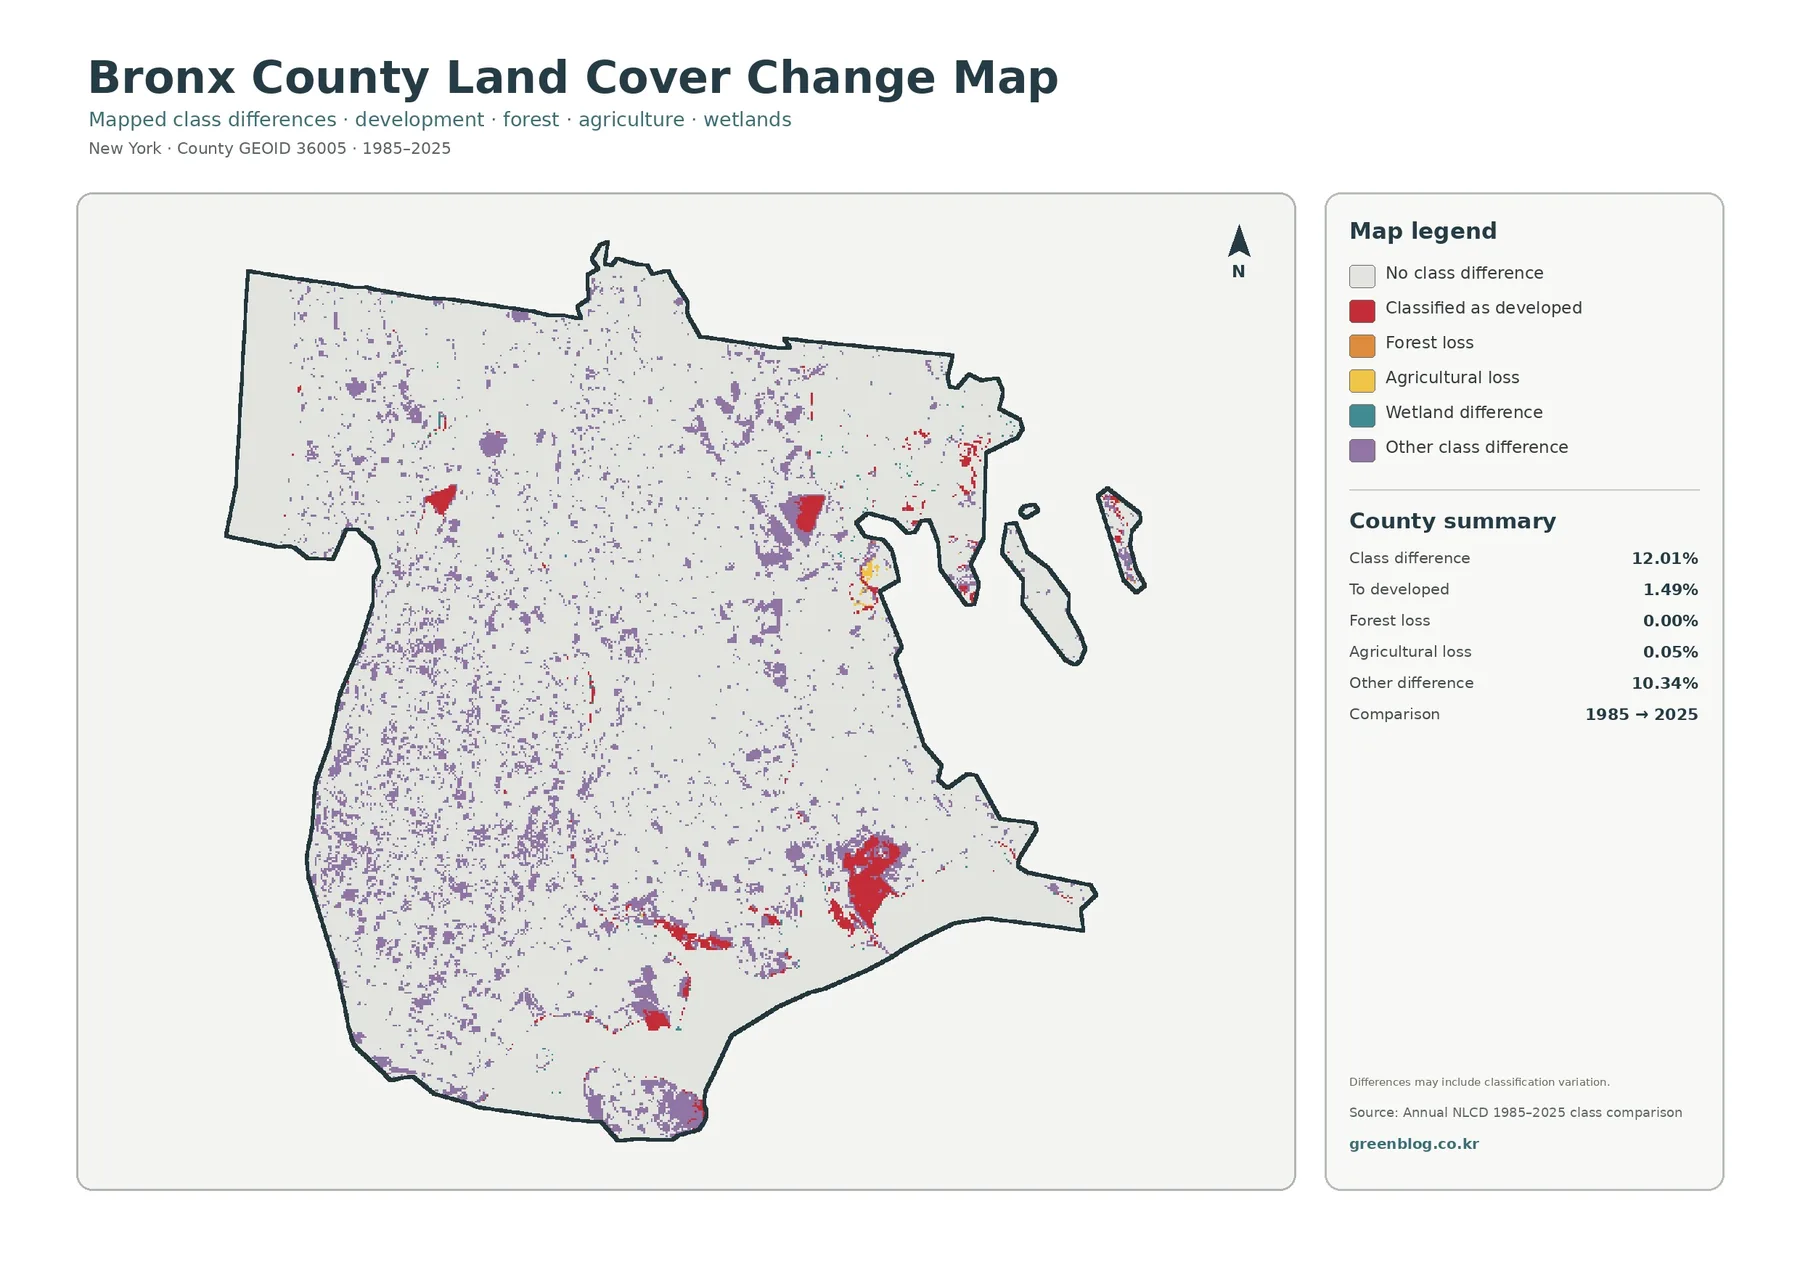
Clusters of changed cells occur in several parts of the borough, with noticeable concentrations near some waterfront and park-adjacent areas as well as scattered changes across the urban interior. Those clusters are useful as leads for further investigation. They do not, by themselves, identify a construction project, a restoration effort, or any other cause.
A long-period comparison can reflect genuine changes to the landscape, but remote-sensing classifications are also affected by imagery dates, seasonal conditions, sensor differences, classification methods, and mixed pixels. A cell along a shoreline or at the edge of a park may shift classes because the observed surface changed, because the boundary was represented differently, or because the mixture inside the cell crossed a classification threshold.
For that reason, a sensible workflow is to use the map as a screening layer. First locate a cluster of interest. Then compare it with historical aerial imagery, municipal planning records, park documentation, or other authoritative sources. That second step separates a visible classification difference from a defensible explanation of what happened on the ground.
A four-map workflow for reading the Bronx
Start with the general land-cover map to establish the broad geography of development, water, forest, and wetlands. Next, switch to the forest-and-farmland map to isolate the natural-cover patches that are easy to overlook against the dense urban background. The impervious map then adds texture inside the built environment by showing where hard surfaces are especially concentrated. Finally, the change map points to places where the 1985 and 2025 classifications do not match.
Reading the maps in that sequence helps prevent overinterpretation. A dark impervious area is not automatically a recent development site, and a colored change cell is not automatically a new building. Each theme describes a different property. The strongest conclusions come from agreement among several layers, followed by a check against more detailed local evidence.
For classroom use, the set offers a concise example of how a highly urban county can still contain large ecological contrasts. For environmental presentations, it can help explain why parks, waterfronts, wetlands, and built surfaces need different map themes. For preliminary planning research, it can identify broad areas that deserve closer examination before parcel-scale or engineering data are consulted.
The maps also have limits that should remain visible in any reuse. Land cover is tied to the observation and classification dates, and raster cells simplify complicated surfaces. Mixed pixels can blend trees, roofs, pavement, grass, or water in one unit. Later construction, restoration, vegetation growth, or shoreline changes may not be represented in an older comparison. None of the four maps should be used as a substitute for a survey, legal boundary, zoning map, or current site inspection.
Download the four Bronx County map files
The article uses WebP previews for fast viewing in the browser. The download archive contains the four original JPG maps supplied for Bronx County: general land cover, forest and farmland, impervious surface, and land-cover change. The source resolution is preserved rather than being artificially enlarged or re-encoded.
Frequently Asked Questions
Why does developed cover reach 82.57 percent on the Bronx map?
The Bronx is a dense New York City borough where residential blocks, commercial areas, roads, rail infrastructure, schools, and other urban surfaces connect across most of the county. The land-cover classification groups those surfaces into developed classes. Large parks and waterfront environments create the clearest breaks in that dominant pattern.
What does the 65.26 percent figure for 50%+ impervious cells mean?
It means a large share of the mapped county lies in raster cells where at least half of the surface is classified as impervious. The value is useful for comparing the intensity of roofs and pavement, but it is not a direct flood-risk measure. Drainage, elevation, rainfall, and coastal or river conditions must also be considered.
Does every colored cell on the 1985–2025 map represent confirmed development?
No. Some differences may represent genuine change, while others can reflect imagery, seasonal conditions, classification methods, or mixed pixels. A specific cluster should be checked against historical imagery or authoritative local records before a cause is assigned. Map File Information The ZIP packages the four original Bronx County JPG map sheets so the same county can be compared across land cover, natural cover, imperviousness, and long-term class differences.
Map File Information
Download the map files associated with this page for reference, printing, and compatible visual projects.
- Included Files: Use only the versions confirmed in the article and supplied images
- File Type: Use the confirmed download contents
- Intended Use: Printing, education, presentations, and map-based projects
Related Maps
- Allegany County New York Land Cover Map
- What the Albany County Land Cover Map
- Broome County New York Land Cover Map
Sources and reference material
- MRLC Annual NLCD Data — official access to national land-cover products and supporting datasets.
- USGS Annual NLCD Land Cover Classification — official descriptions of the mapped land-cover classes used in Annual NLCD products.
- U.S. Census Bureau TIGER/Line Shapefiles — geographic boundary resources used to identify county geography.
- New York City Department of Environmental Protection: Bronx River — local environmental context for the Bronx River and its watershed setting.
Green Map creates custom-edited map images using open geographic data sources such as geoBoundaries, Natural Earth, OpenStreetMap, and government open data.
These maps are edited visual materials, not raw data files, and are provided for education, documents, presentations, and graphic reference.