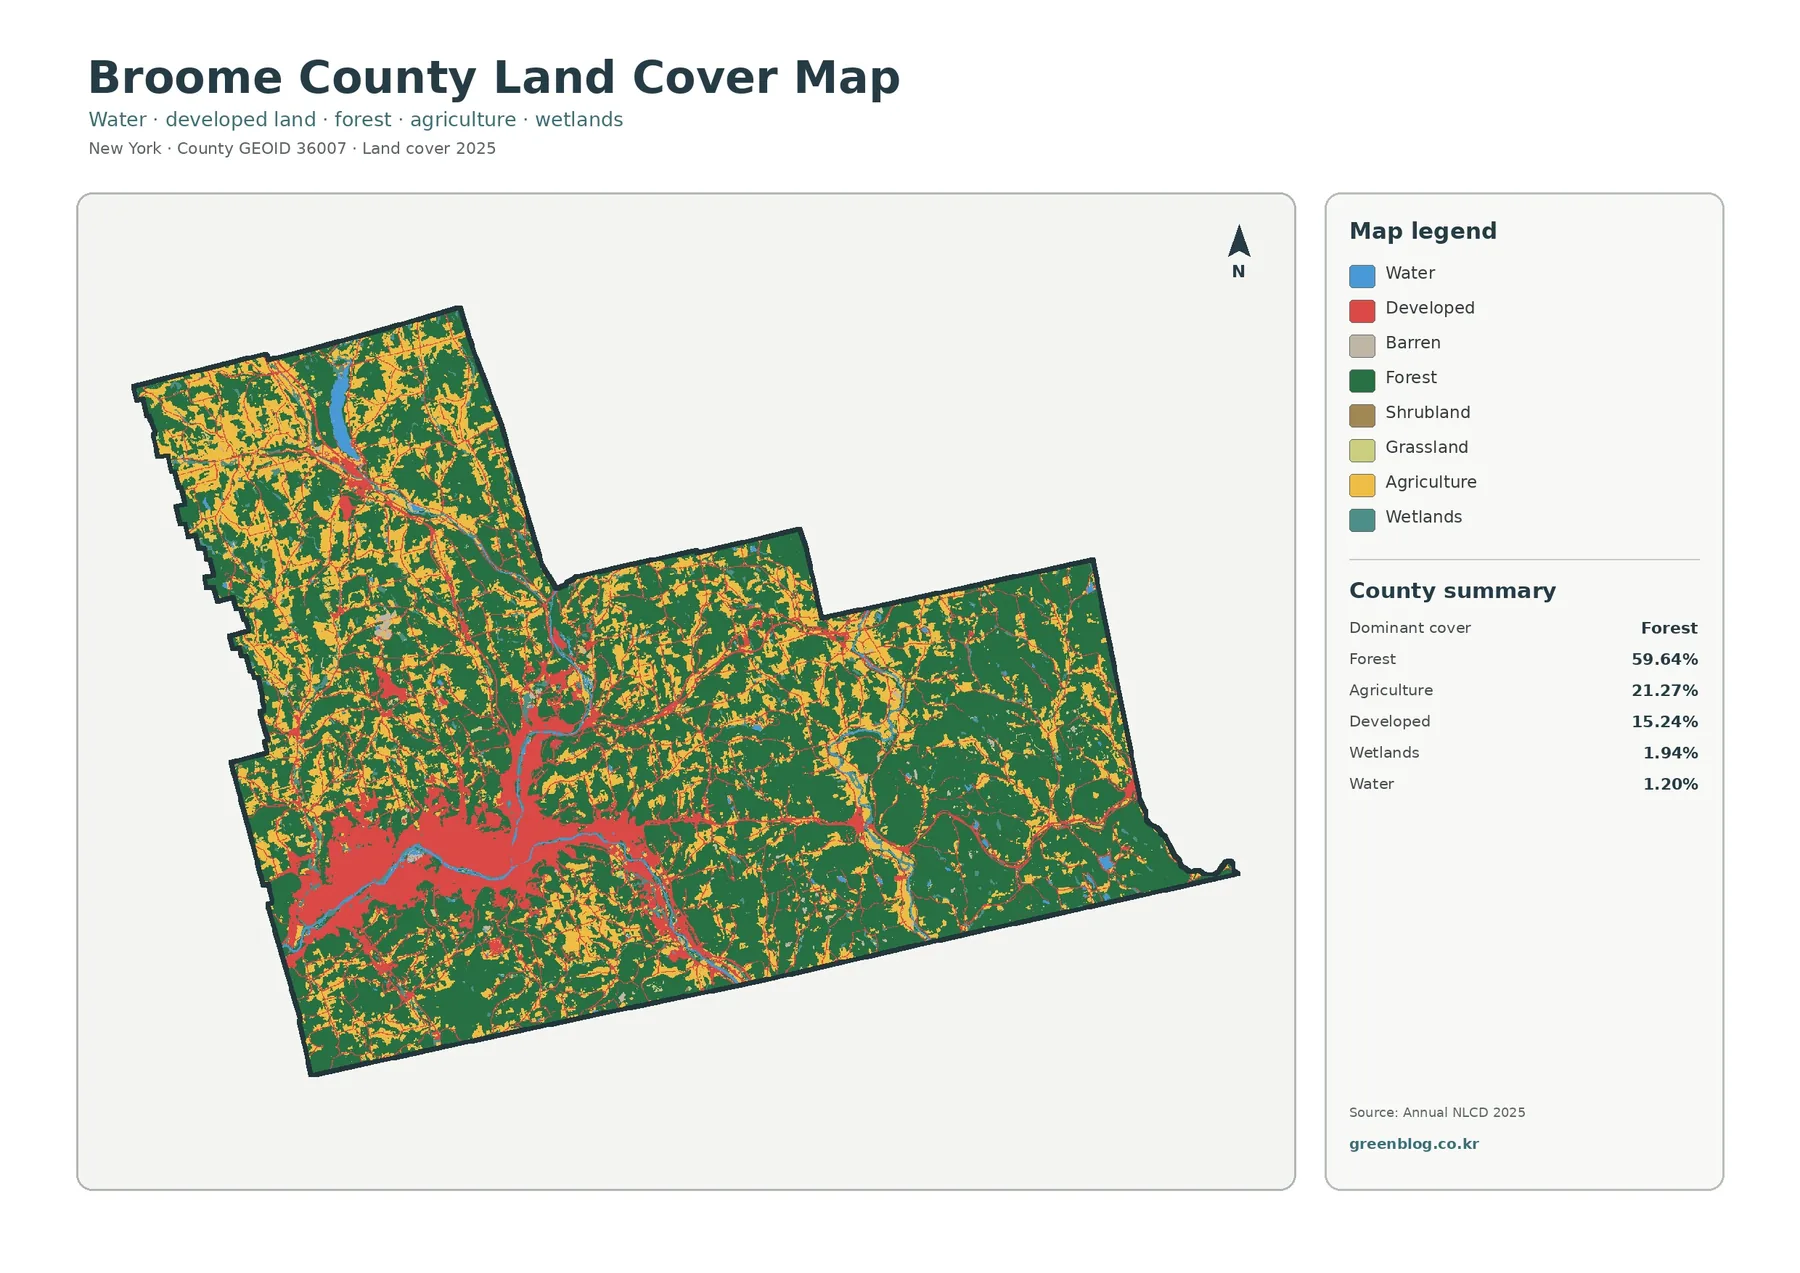
The Broome County New York Land Cover Map becomes easier to understand once Binghamton and the two major river valleys are used as reference points. Developed land is tightly concentrated in the southwest around the Binghamton urban area and along the Susquehanna and Chenango corridors. Beyond that core, wooded hills occupy much of the county, while cropland and pasture appear in a patchwork across northern areas and smaller valleys.
This page includes four Broome County themes: general land cover, forest and farmland, impervious surface and developed land, and mapped change from 1985 to 2025. WebP previews can be viewed in the article, and the four original JPG maps can be downloaded together in one ZIP file. Comparing them side by side helps separate the dense Binghamton area from agricultural valleys, wooded uplands, and places where the two classification dates differ.
Table of Contents
Binghamton forms a compact urban contrast to a largely wooded county
Forest is the leading class on the 2025 map at 59.64 percent. Agriculture is listed at 21.27 percent, developed land at 15.24 percent, wetlands at 1.94 percent, and water at 1.20 percent. Those numbers establish the broad balance, but the arrangement on the map is more revealing. The southwest contains a concentrated developed footprint, whereas large portions of the east, south, and interior hills remain visually dominated by forest.
The urban pattern follows familiar geography. Binghamton lies at the meeting of the Chenango and Susquehanna rivers, and developed colors spread through the surrounding valley floor rather than covering the county evenly. Outside the metropolitan area, smaller developed traces follow roads and settlements. Agricultural land has a different shape: it appears as repeated patches in northern Broome County and in other relatively open valleys, separated by wooded slopes and ridges.
The rural layer reveals where farming breaks up the forest
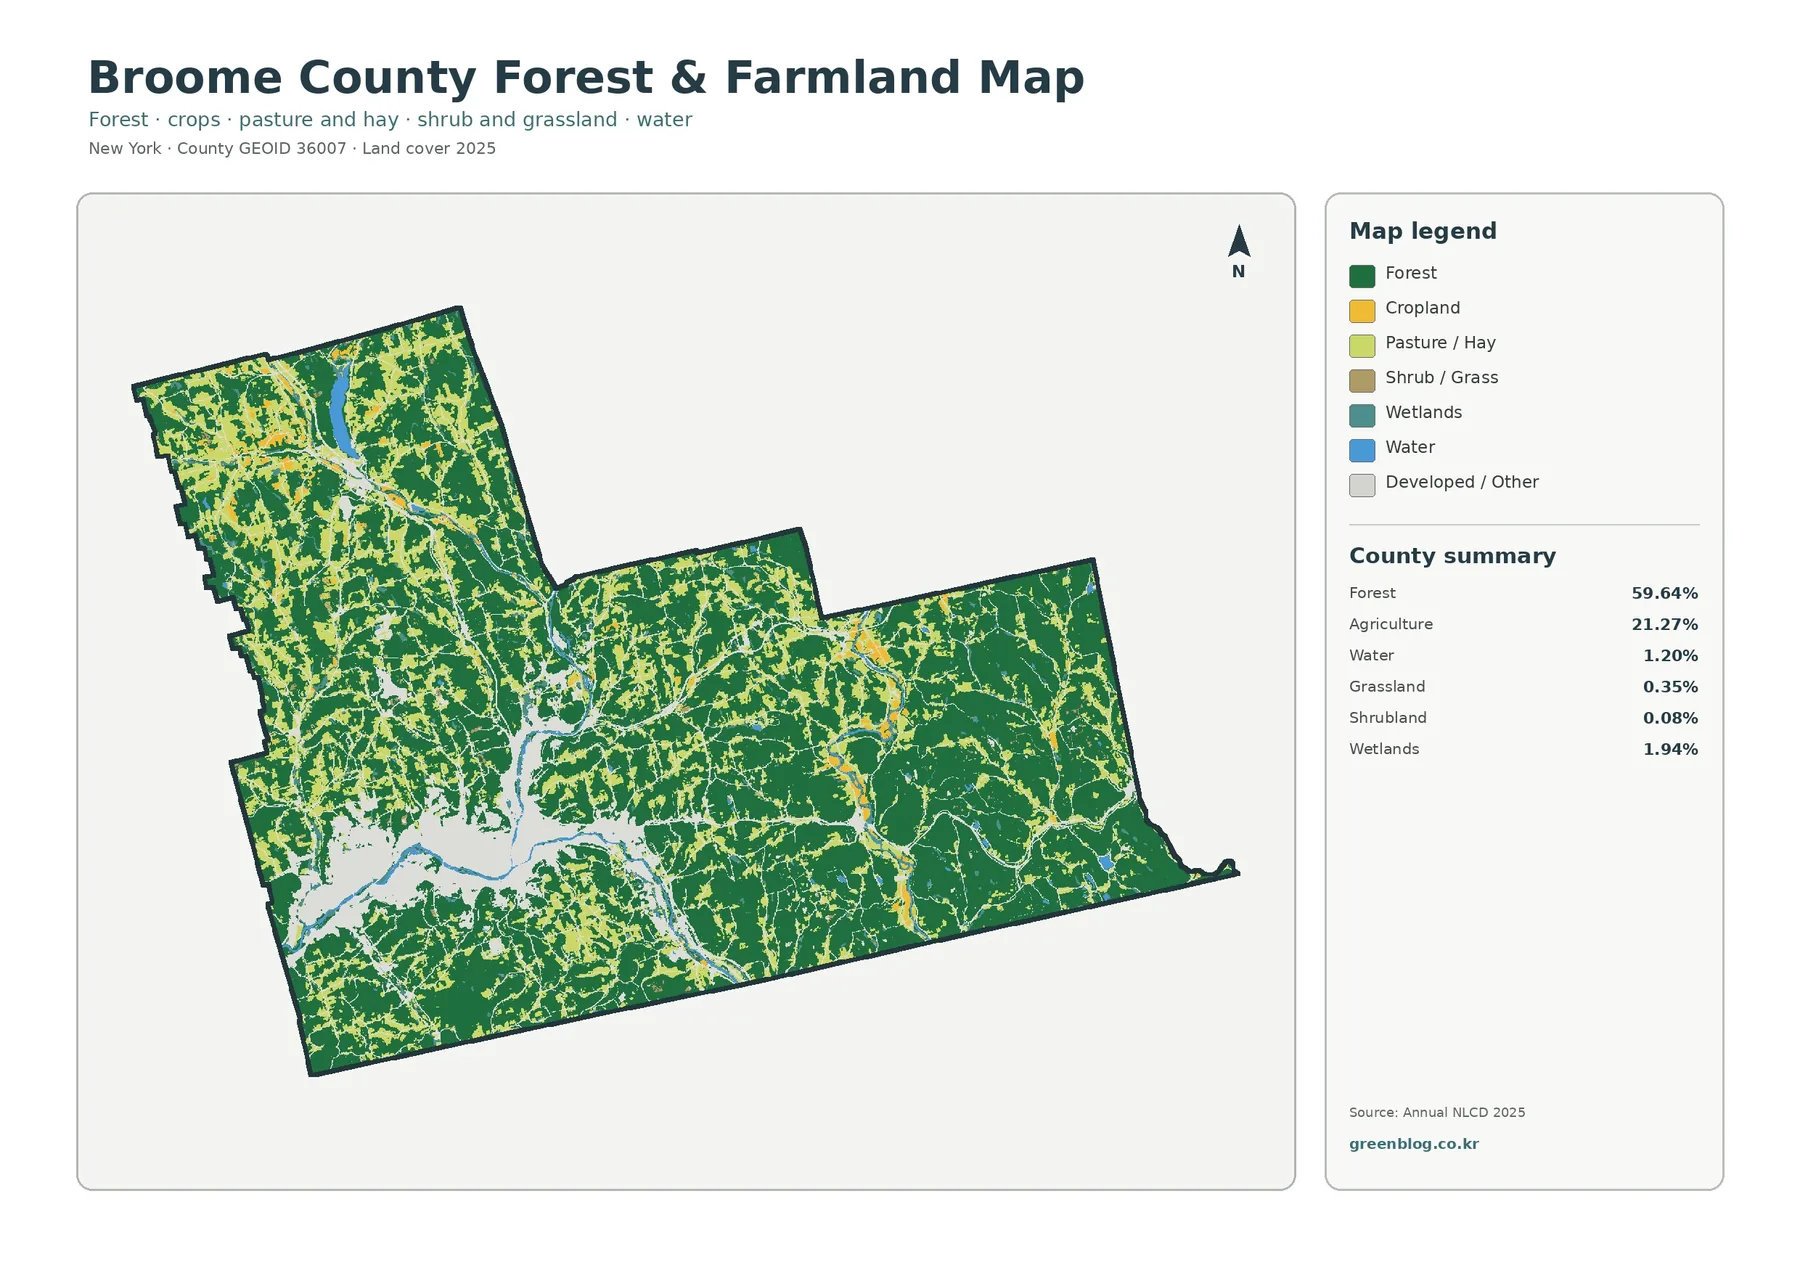
Removing much of the urban detail makes the county’s rural pattern easier to read. Forest remains especially continuous across broad eastern and southeastern areas. Cropland and pasture or hay occur more often in the north and northwest, with additional narrow concentrations in interior valleys. The result is not a single farm belt. It is a mosaic in which open agricultural ground repeatedly interrupts a much larger wooded landscape.
The legend prevents an easy misreading. Cropland and pasture/hay are separate from shrub or grass, wetlands, water, and developed/other land. An open-looking patch next to a stream may therefore represent something other than a field. That distinction matters in classroom use, habitat comparisons, and watershed discussions because several surfaces can sit close together on a valley floor while the adjacent hills remain forested.
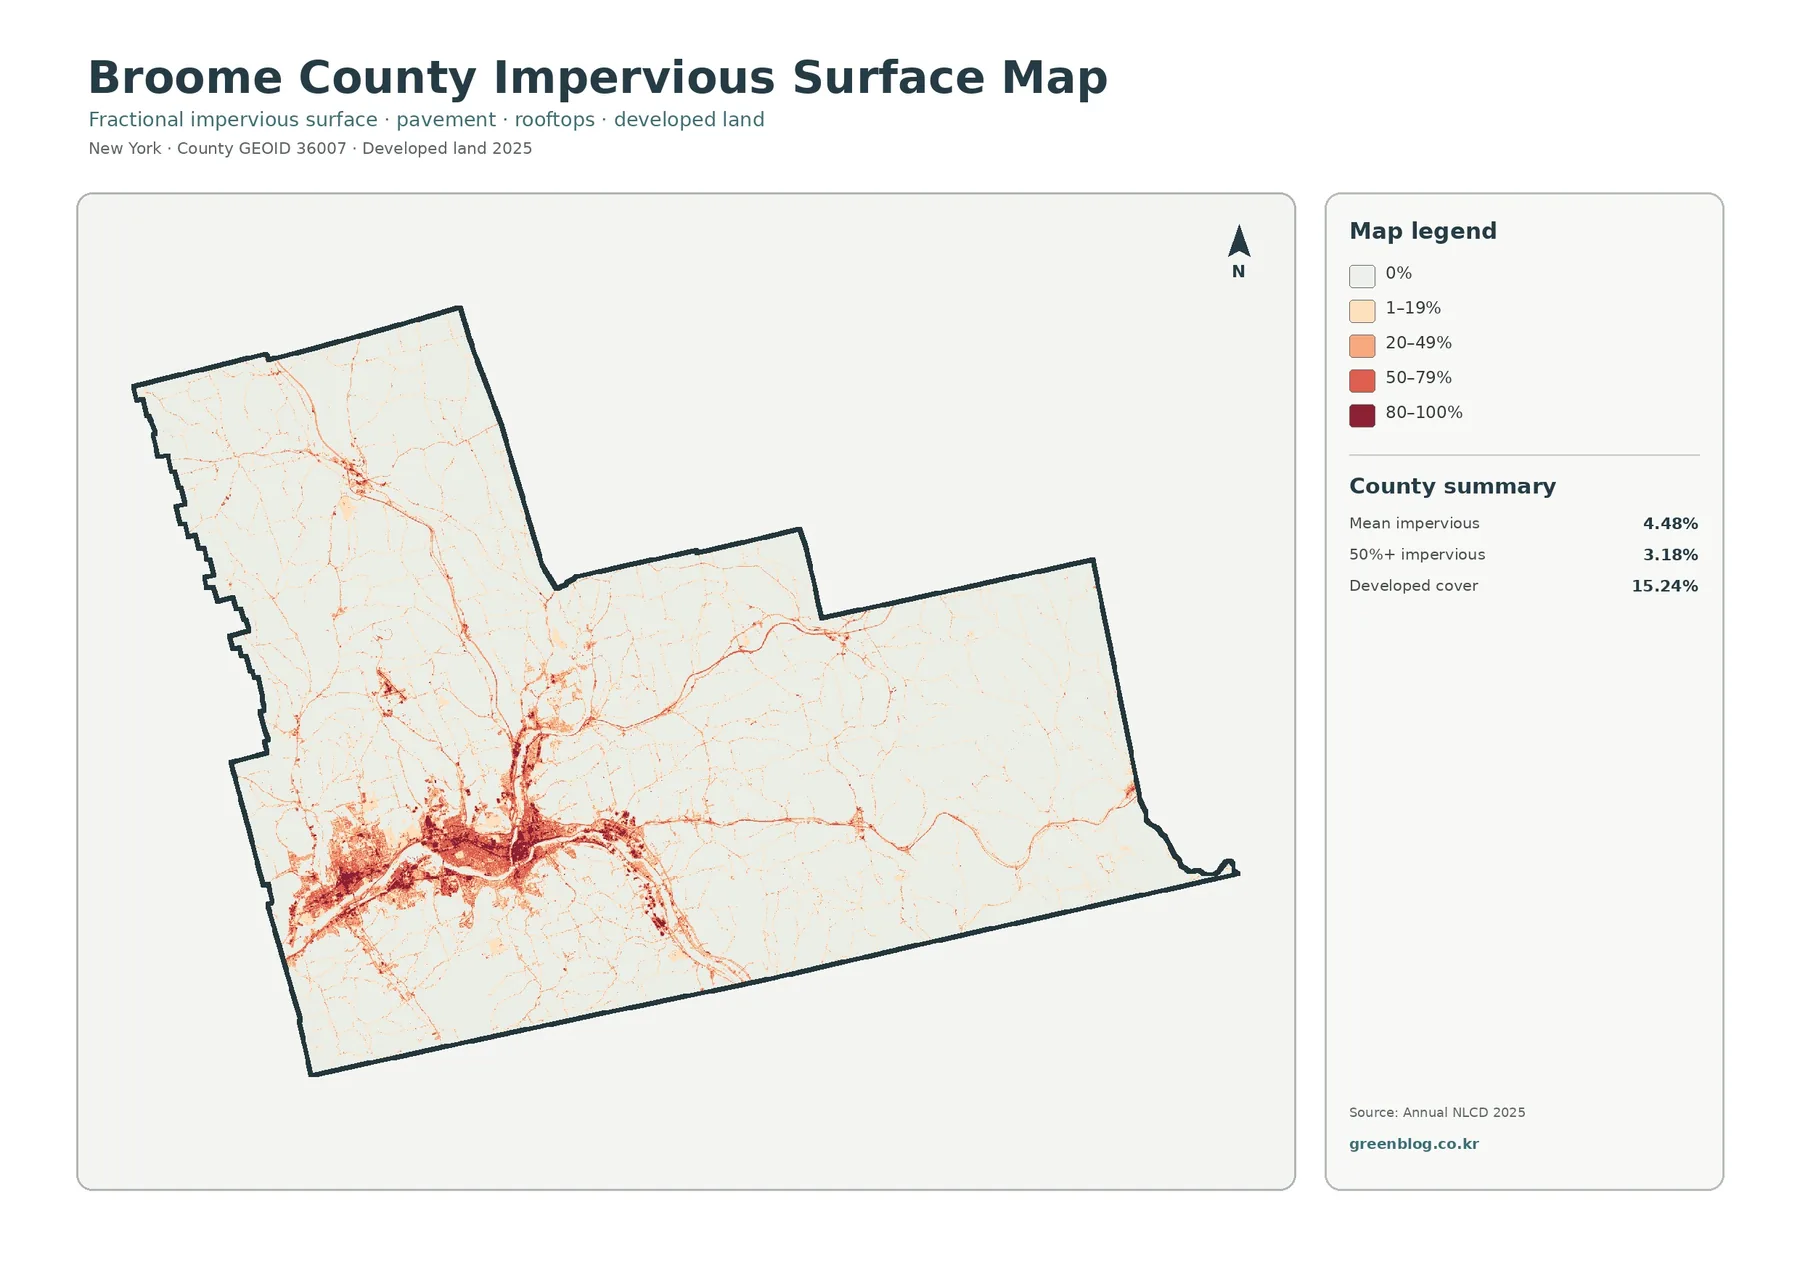
Hard surfaces sharpen the outline of the Binghamton urban area
Impervious surface means ground covered by materials that resist infiltration, such as roofs, paved roads, and parking areas. On this map, the strongest values gather around Binghamton and the adjoining urban corridor. Farther from the southwest core, the marks become thinner and more fragmented. Roads and small settlement centers are still visible, but they do not approach the concentration seen around the main urbanized area.
The county summary reports mean imperviousness of 4.48 percent. Areas at 50 percent impervious or greater account for 3.18 percent, compared with 15.24 percent for the broader developed land class. The gap matters because a place classified as developed may still include lawns, trees, bare ground, and other permeable surfaces. The impervious layer therefore helps distinguish intensely built settings from lower-density development that looks similar on a general land-cover legend.
For a stormwater discussion, this map is a useful starting point because it identifies places where rainfall has fewer opportunities to soak directly into the ground. It is not a runoff model. Slope, soils, drainage infrastructure, stream channels, and storm intensity also affect what happens to water after it reaches the surface. Its strongest value is as a spatial indicator of development intensity.
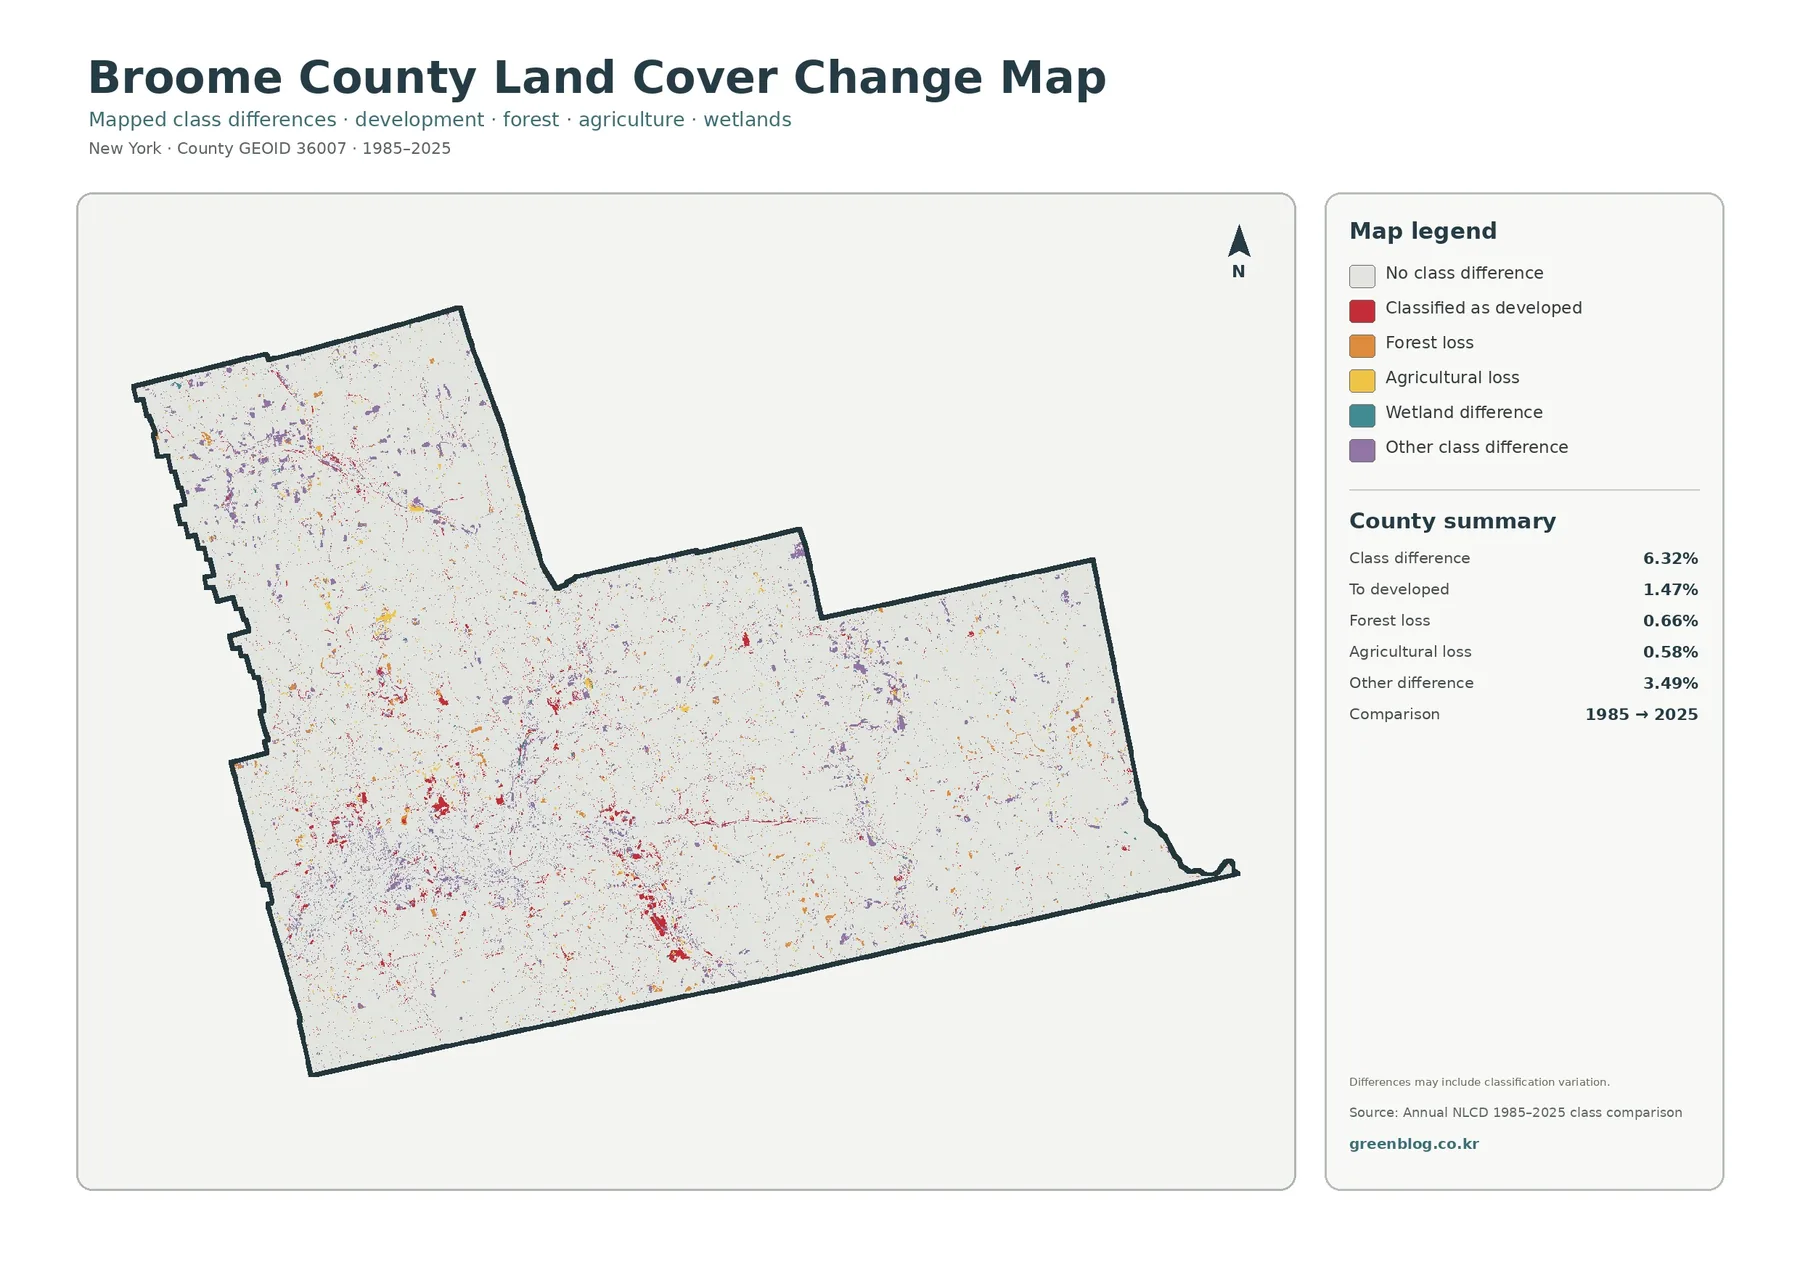
The 1985–2025 comparison works best as a search map for change
Most of Broome County stays in the no-class-difference background on the change layer. Colored cells are dispersed in small clusters and short streaks rather than forming one sweeping conversion zone. The map summary records class differences across 6.32 percent of the county. It also lists 1.47 percent as changed to developed, 0.66 percent as forest loss, 0.58 percent as agricultural loss, and 3.49 percent as other class differences.
A colored cell is a signal to investigate, not a complete history of the site. The comparison is based on raster classifications at two dates. Vegetation condition, mixed pixels, image characteristics, and classification methods can all contribute to a difference. A red cluster near an existing developed corridor may be worth checking for construction, but the map alone does not prove that development caused every observed change.
A careful workflow begins by locating a cluster and then consulting older aerial imagery, local planning material, or other dated records. The same approach applies to forest and agricultural edges. This keeps the map in its proper role: it narrows a countywide search to manageable locations without pretending to replace site-specific evidence.
A four-map reading sequence keeps the landscape in context
Start with the general layer and locate Binghamton, the Susquehanna corridor, and the Chenango valley. That establishes the county’s strongest developed concentration. Next, use the forest-and-farmland map to follow agricultural openings into northern and interior valleys. Next, impervious values separate the hard-surface urban core from lighter development. Only after those three steps does the change map become especially informative, because each colored patch can be judged against an already familiar landscape setting.
This sequence supports several kinds of use. A geography lesson can compare the settlement pattern of the valley floors with the more wooded uplands. Environmental education can focus on where forest, agriculture, wetlands, and water meet. A watershed presentation can pair the river system with impervious concentration without claiming that the map predicts flooding. Regional planning graphics can use the layers to show context before moving to parcel-scale or regulatory information.
What a 30-meter classified raster can and cannot tell you
Annual NLCD products classify the surface in raster cells, meaning a regular grid rather than individual property polygons. At roughly 30-meter resolution, narrow roads, small buildings, thin streams, and complicated forest-field boundaries can be generalized. A single cell may contain more than one real-world surface even though the final map assigns one representative class. This is the mixed-pixel problem, and it becomes especially noticeable around edges.
For that reason, these maps are appropriate for countywide patterns, comparisons, teaching, and preliminary screening. They are not parcel surveys and do not establish ownership, zoning, permitted land use, or a legal boundary. Conditions may also have changed after the observation year. Site-level decisions should rely on current imagery, local government records, field verification, and the appropriate regulatory sources.
Frequently Asked Questions
Where is developed land most concentrated in Broome County?
The clearest concentration is in the southwest around Binghamton and the adjoining Susquehanna and Chenango river corridors. Smaller developed traces occur elsewhere, but they are much less continuous than the main urban area.
Does every colored cell on the change map represent a confirmed land-use event?
No. It represents a classification difference between 1985 and 2025. Historical imagery or local records are needed to determine whether a specific difference reflects construction, vegetation change, agricultural change, or another factor.
Can the maps be used to determine zoning or property boundaries?
No. Land cover describes the mapped surface condition. Zoning, ownership, parcel boundaries, and legally permitted uses come from different datasets and should be checked with the relevant local authority. Map File Information Broome County Four-Map Archive
Map File Information
Download the map files associated with this page for reference, printing, and compatible visual projects.
- Included Files: Use only the versions confirmed in the article and supplied images
- File Type: Use the confirmed download contents
- Intended Use: Printing, education, presentations, and map-based projects
Related Maps
- Albany County Land Cover Map
- Bronx County New York Land Cover Map
- Cattaraugus County New York Land Cover Map
Sources and Broome County references
- MRLC Annual NLCD Data — official access point for national land-cover and related raster products.
- USGS Annual NLCD Land Cover Classification — documentation for the mapped land-cover classes and how they are interpreted.
- Broome County Natural Resources & Open Space — county-level context for natural resources and open-space planning.
- Broome County Waterfront Revitalization Planning — local planning context for waterfront and river-corridor areas.
Download the four Broome County land-cover maps
The ZIP contains four original JPG files: general land cover, forest and farmland, impervious/developed land, and the 1985–2025 land-cover classification change map.
Green Map creates custom-edited map images using open geographic data sources such as geoBoundaries, Natural Earth, OpenStreetMap, and government open data.
These maps are edited visual materials, not raw data files, and are provided for education, documents, presentations, and graphic reference.