Butts County, Georgia is a forest-majority county in the 2025 land-cover summary, but the maps also reveal a distinct developed center, scattered agricultural openings, and water along the eastern side. Forest accounts for 54.99% of the mapped area, agriculture for 17.83%, and developed cover for 12.32%. The four views on this page separate those patterns so they can be compared without treating every developed or rural surface as the same thing.
The four original JPG maps are available together in one download below. They include general land cover, a forest-and-farmland view, fractional impervious surface, and a 1985-to-2025 class-difference map. Using them side by side is especially helpful around Jackson, along the county’s eastern water features, and in the broad rural areas where forest and agricultural cover meet.
Table of Contents
Forest sets the visual baseline across Butts County
More than half of Butts County is classified as forest in the supplied 2025 summary. At 54.99%, forest is large enough to form the background pattern across much of the county rather than appearing only as isolated tracts. Agriculture is the next major category at 17.83%, followed by developed cover at 12.32%. Grassland contributes 4.35% and wetlands 4.04%, while water, shrubland, barren land, and other mapped classes make up the remainder.
That mixture fits the local context described in the county’s adopted comprehensive plan. Butts County planning documents discuss Jackson, Flovilla, Jenkinsburg, rural areas, agricultural and forestry activity, and the protection of natural resources. The plan also identifies the Ocmulgee River and Lake Jackson as important water-related features. Those planning references do not define the colors in the NLCD maps, but they help explain why a reader sees a county with a compact developed center surrounded by extensive rural cover rather than a continuously urban landscape.
Land cover should not be confused with zoning or legal land use. A forest-classified cell tells you what surface cover predominated in the satellite-based classification, not who owns the land or whether the parcel is designated for forestry. The same caution applies to agriculture and developed classes. Parcel boundaries, development rights, building restrictions, and future land-use designations require separate county records.
Jackson stands out when all 2025 classes are viewed together
The general land-cover image is the best place to establish the county-wide pattern. Dark green forest occupies large parts of the east, southeast, north, and many interior blocks. Yellow agricultural areas break up that forest more often in the western, central, and northern portions of the county. Red developed cover forms its strongest concentration near the middle of the county, matching the Jackson area shown in county planning materials. Smaller developed concentrations also appear toward the western and southwestern edges.
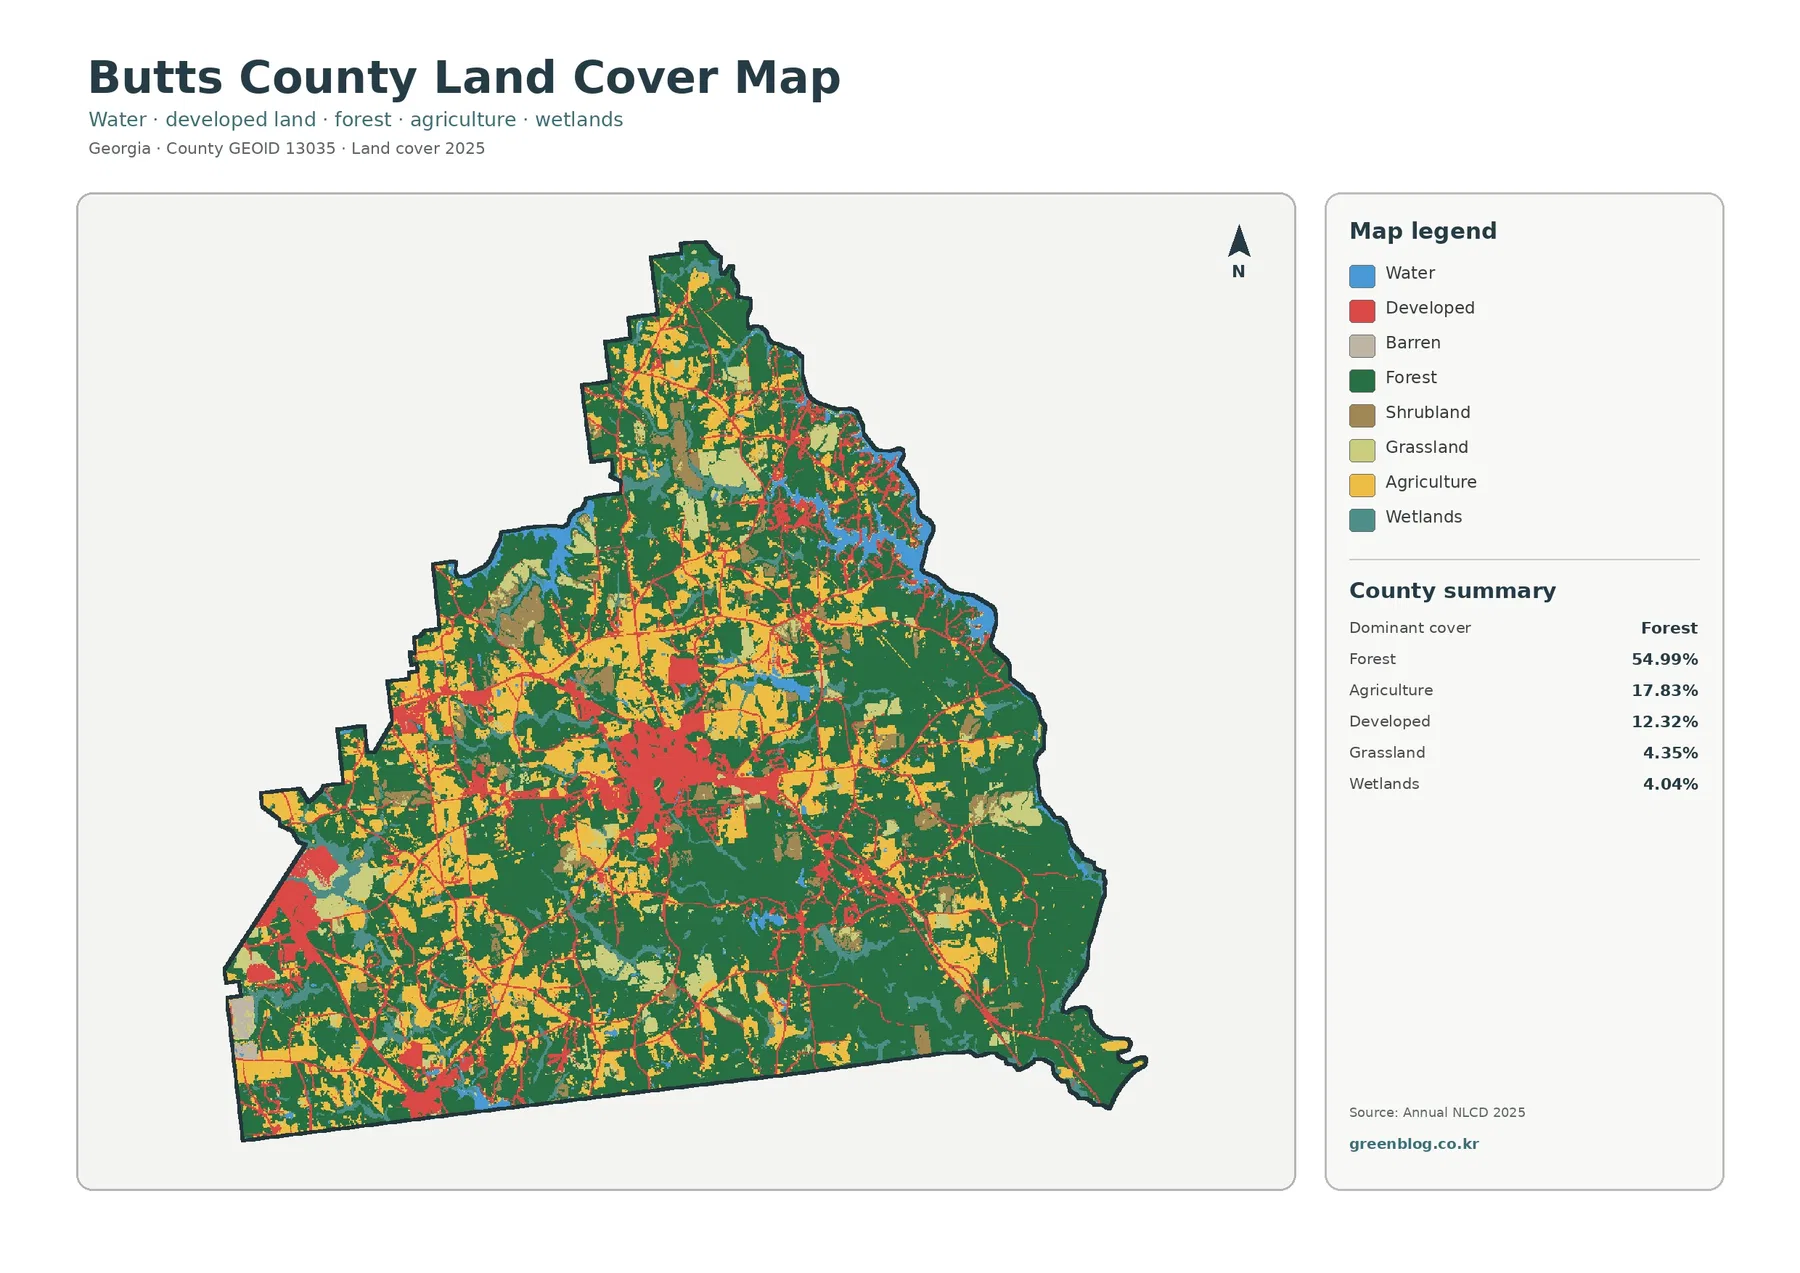
Blue water and teal wetlands are less extensive by percentage, yet they matter because of where they occur. Water is conspicuous along the eastern side and in narrow interior features. County planning materials identify Lake Jackson and the Ocmulgee River among the area’s significant water resources, so those references provide useful geographic context for the eastern pattern. The map itself does not label individual water bodies, however, so a specific blue patch should not be named without checking a labeled hydrography source.
The legend is easier to read when classes are grouped by what they represent. Forest, shrubland, and grassland describe different kinds of vegetated cover. Agriculture identifies mapped crop and pasture-related surfaces. Developed classes represent built environments at varying levels of intensity, and wetlands describe areas where wet conditions and wetland vegetation are characteristic. This simplified view is useful for regional comparison, but it does not replace field inspection or detailed site mapping.
The forest-and-farmland view separates the rural mosaic
Removing most of the visual emphasis from developed and miscellaneous classes makes the rural pattern easier to follow. The supplied forest-and-farmland summary reports forest at 54.99% and agriculture at 17.83%, with water at 2.64%, grassland at 4.35%, shrubland at 3.54%, and wetlands at 4.04%. Rather than forming one continuous farm belt, agricultural cover appears in numerous openings and blocks within a much larger forest matrix.
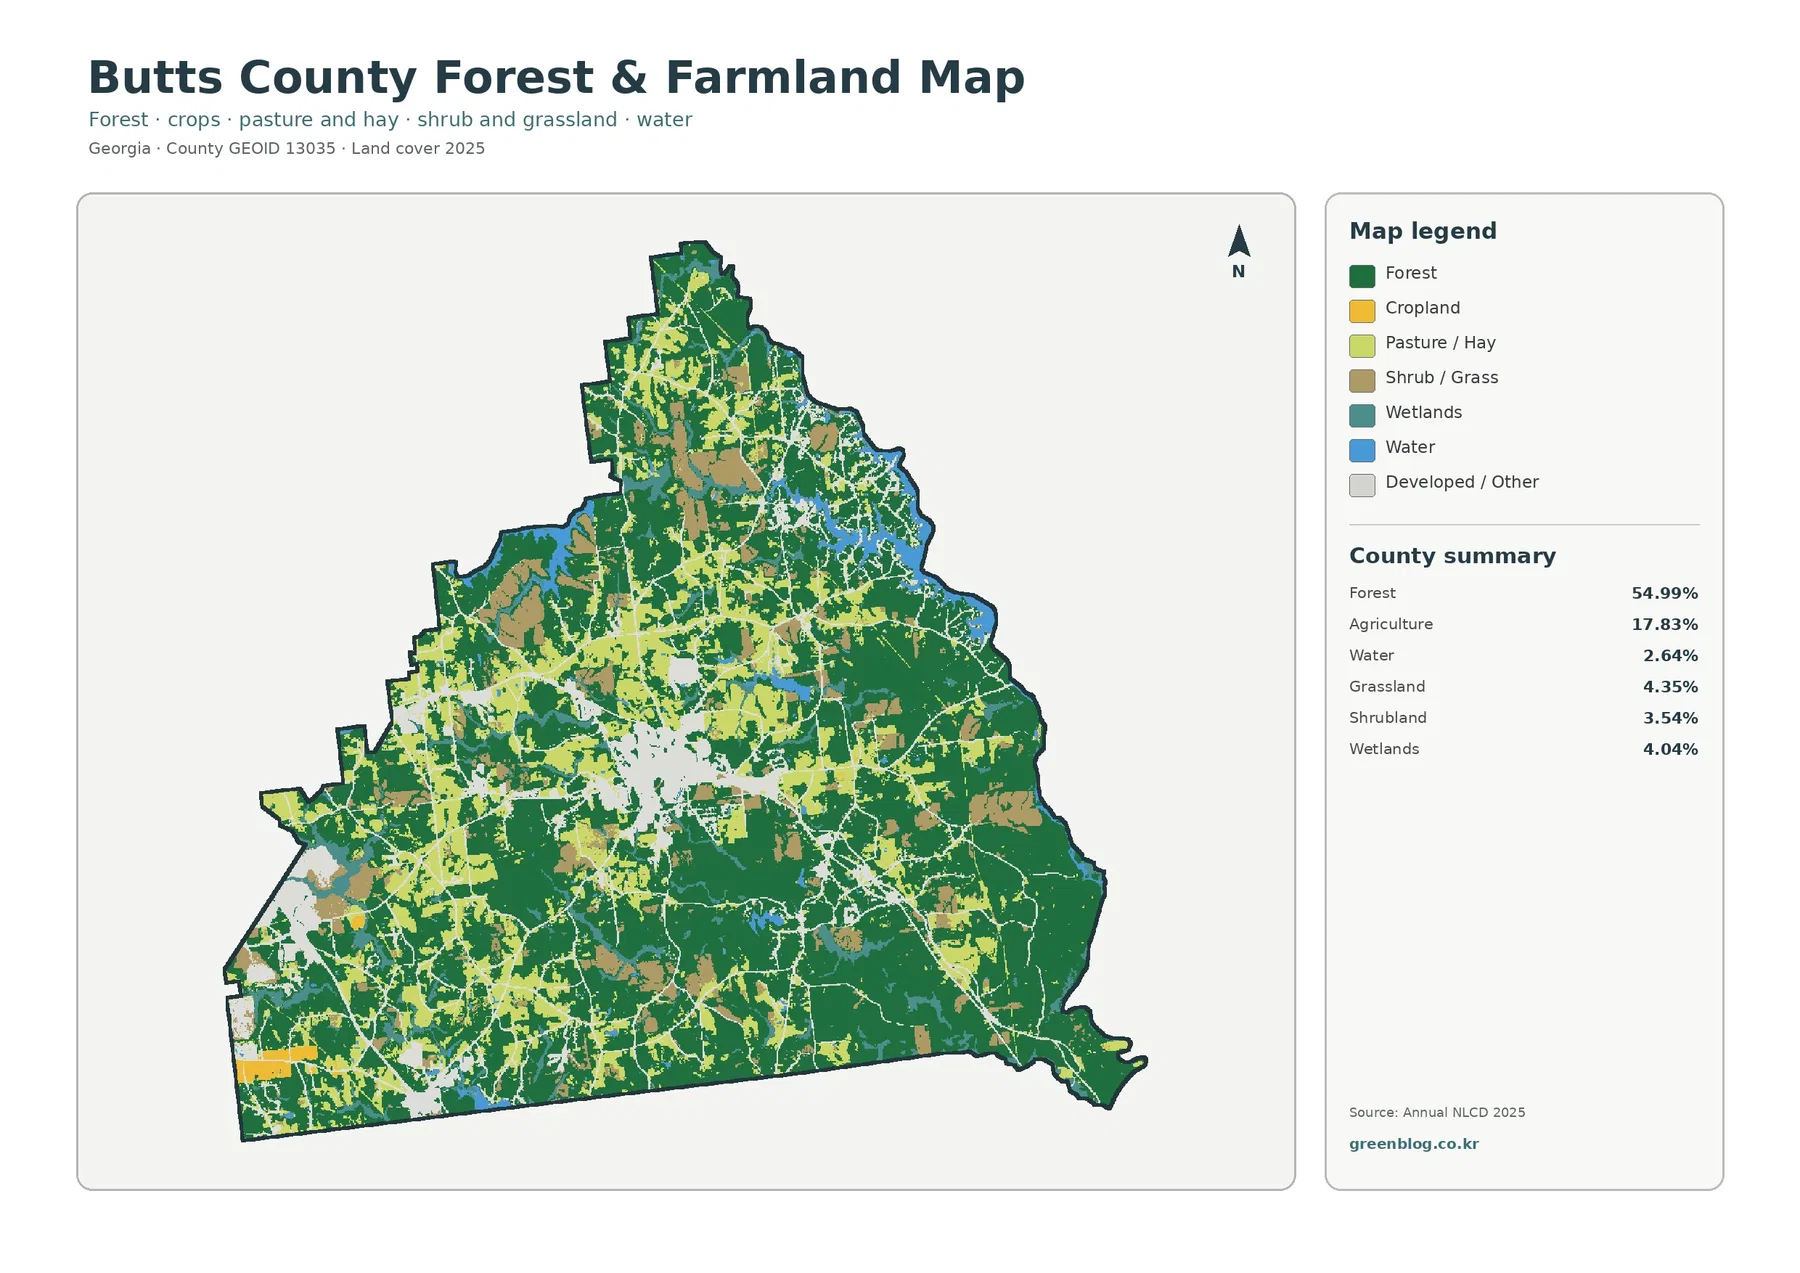
Large forest tracts are especially noticeable across the eastern and southeastern portions, with additional broad forest cover in the north. Agricultural areas occur more frequently across western and central sections and in openings farther north. The value of this map is not that it assigns a single identity to each part of the county. Instead, it shows how often working land and wooded land sit next to one another, producing a patchwork rather than a sharp farm-versus-forest division.
Local agricultural information from UGA Cooperative Extension adds useful context without changing the map classification. The Butts County office supports work involving pasture management, forage, soil fertility, forestry, pond management, and other agricultural and natural-resource topics. Its recent county material also describes greenhouse and container nursery production and beef cattle among important local commodities. That helps explain why “agriculture” on a land-cover map should not be imagined as only large row-crop fields.
For habitat or landscape comparisons, this version is often more useful than the full land-cover map because wooded areas and agricultural openings are visually separated with less competition from developed colors. It can help identify places where forest is relatively continuous, where farms and pasture are interspersed with woodland, and where water or wetlands border those areas. It cannot determine farm ownership, active production status, conservation easements, or property boundaries.
Impervious surface reveals a smaller, more concentrated built footprint
Developed cover and impervious surface are related, but they are not interchangeable. Developed cover occupies 12.32% of the county in the supplied summary, while mean imperviousness is only 2.80%. Areas with 50% or greater impervious cover account for 1.46%. An impervious surface is a hard surface such as pavement or a roof that limits the direct infiltration of rainfall into the ground.
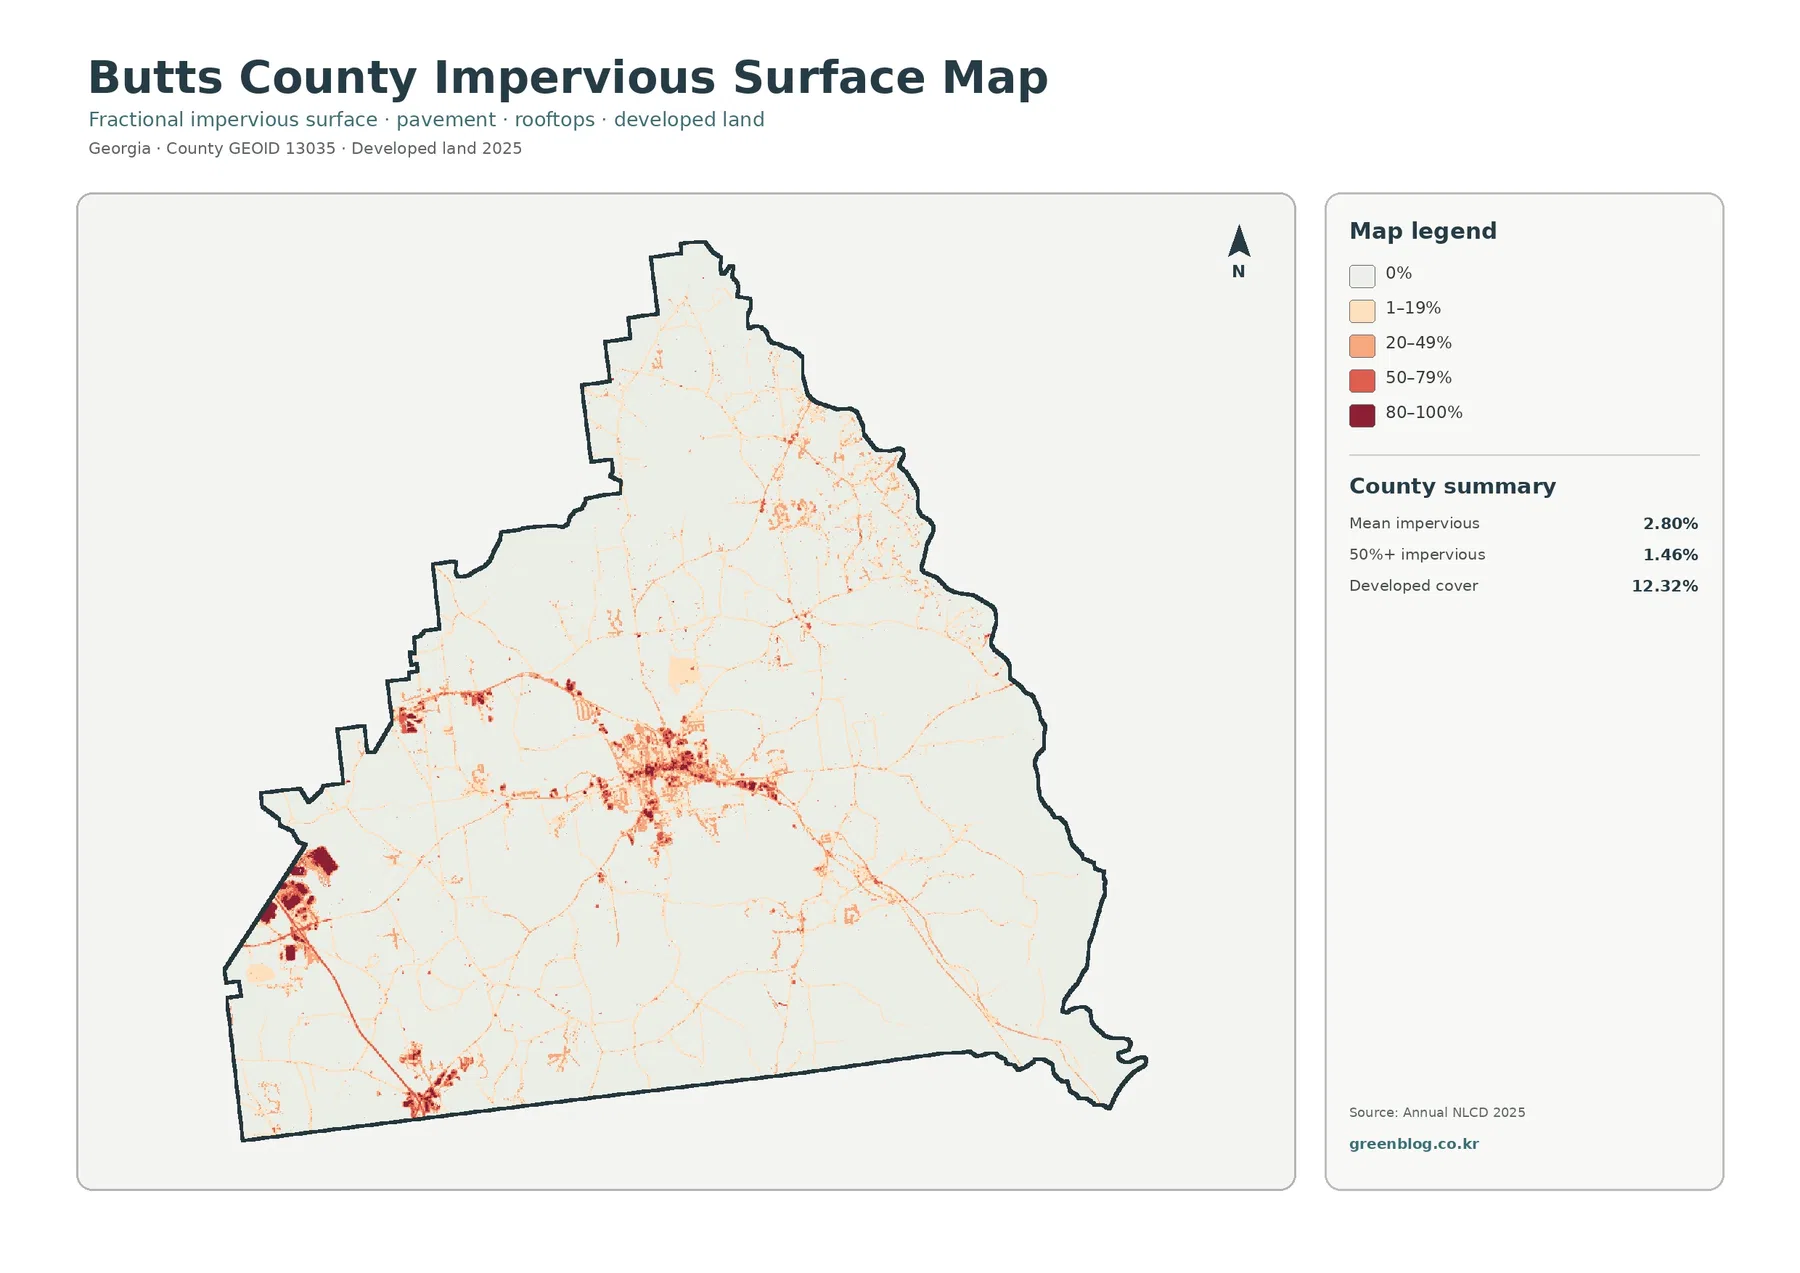
The highest values cluster around central Jackson. Stronger patches also occur near the western and southwestern sides of the county, while thin lines connect or extend from these concentrations along developed corridors. Most of the county remains pale on this map, which is consistent with the broad forest and agricultural cover visible in the other views. The contrast is important: a county can contain a noticeable amount of developed land while still having only a small share of highly impervious surface.
A county-wide mean can hide that local concentration. The 2.80% average includes large rural and forested areas with very little hard surface, so it should not be used to describe conditions inside Jackson or another built-up cluster by itself. For a presentation, the percentage works best when paired with the map image so readers can see that the hard-surface footprint is uneven rather than uniformly distributed.
Impervious data can provide useful context for discussions of development or stormwater, but it is not a flood-risk map. Runoff also depends on rainfall, slope, soil, drainage systems, vegetation, and the location of streams and low areas. The map can tell a reader where hard surfaces are concentrated; it cannot by itself predict where water will pond or where a property will flood.
Water and wetlands add an important eastern contrast
Water represents 2.64% in the forest-and-farmland summary and wetlands 4.04% in the supplied 2025 statistics. Those shares are modest compared with forest, yet their shapes make them easy to notice along the eastern side and in narrow branches through the county. The county’s comprehensive plan discusses the Ocmulgee basin, Lake Jackson, water-quality concerns, stream buffers, and the protection of sensitive natural resources, making water a meaningful part of the local landscape context.
Wetlands do not always appear as broad, open-water features. They can follow stream corridors, low ground, and areas where vegetation and saturated soils occur together. At 30-meter raster resolution, narrow streams and irregular wetland edges can be generalized into larger cells. That is why the boundary of a blue or teal cell should not be treated as a surveyed shoreline or jurisdictional wetland boundary.
For a watershed-oriented comparison, start with the general map to locate water and wetland colors, then switch to the forest-and-farmland view to see the surrounding cover more clearly. The impervious map can then show whether hard surfaces are concentrated nearby. This sequence helps organize questions for further research, but water quality, stream condition, and regulatory wetland status require separate datasets and official determinations.
The 1985–2025 map highlights class differences, not a single growth story
The long-term comparison marks locations where the 1985 and 2025 land-cover classes differ. The supplied county summary reports class differences across 33.06% of the mapped area. Of that total, 5.15% is categorized as change to developed, 10.68% as forest loss, 2.43% as agricultural loss, and 14.40% as other class difference. The map also warns that differences may include classification variation, which is essential context for interpreting these percentages.
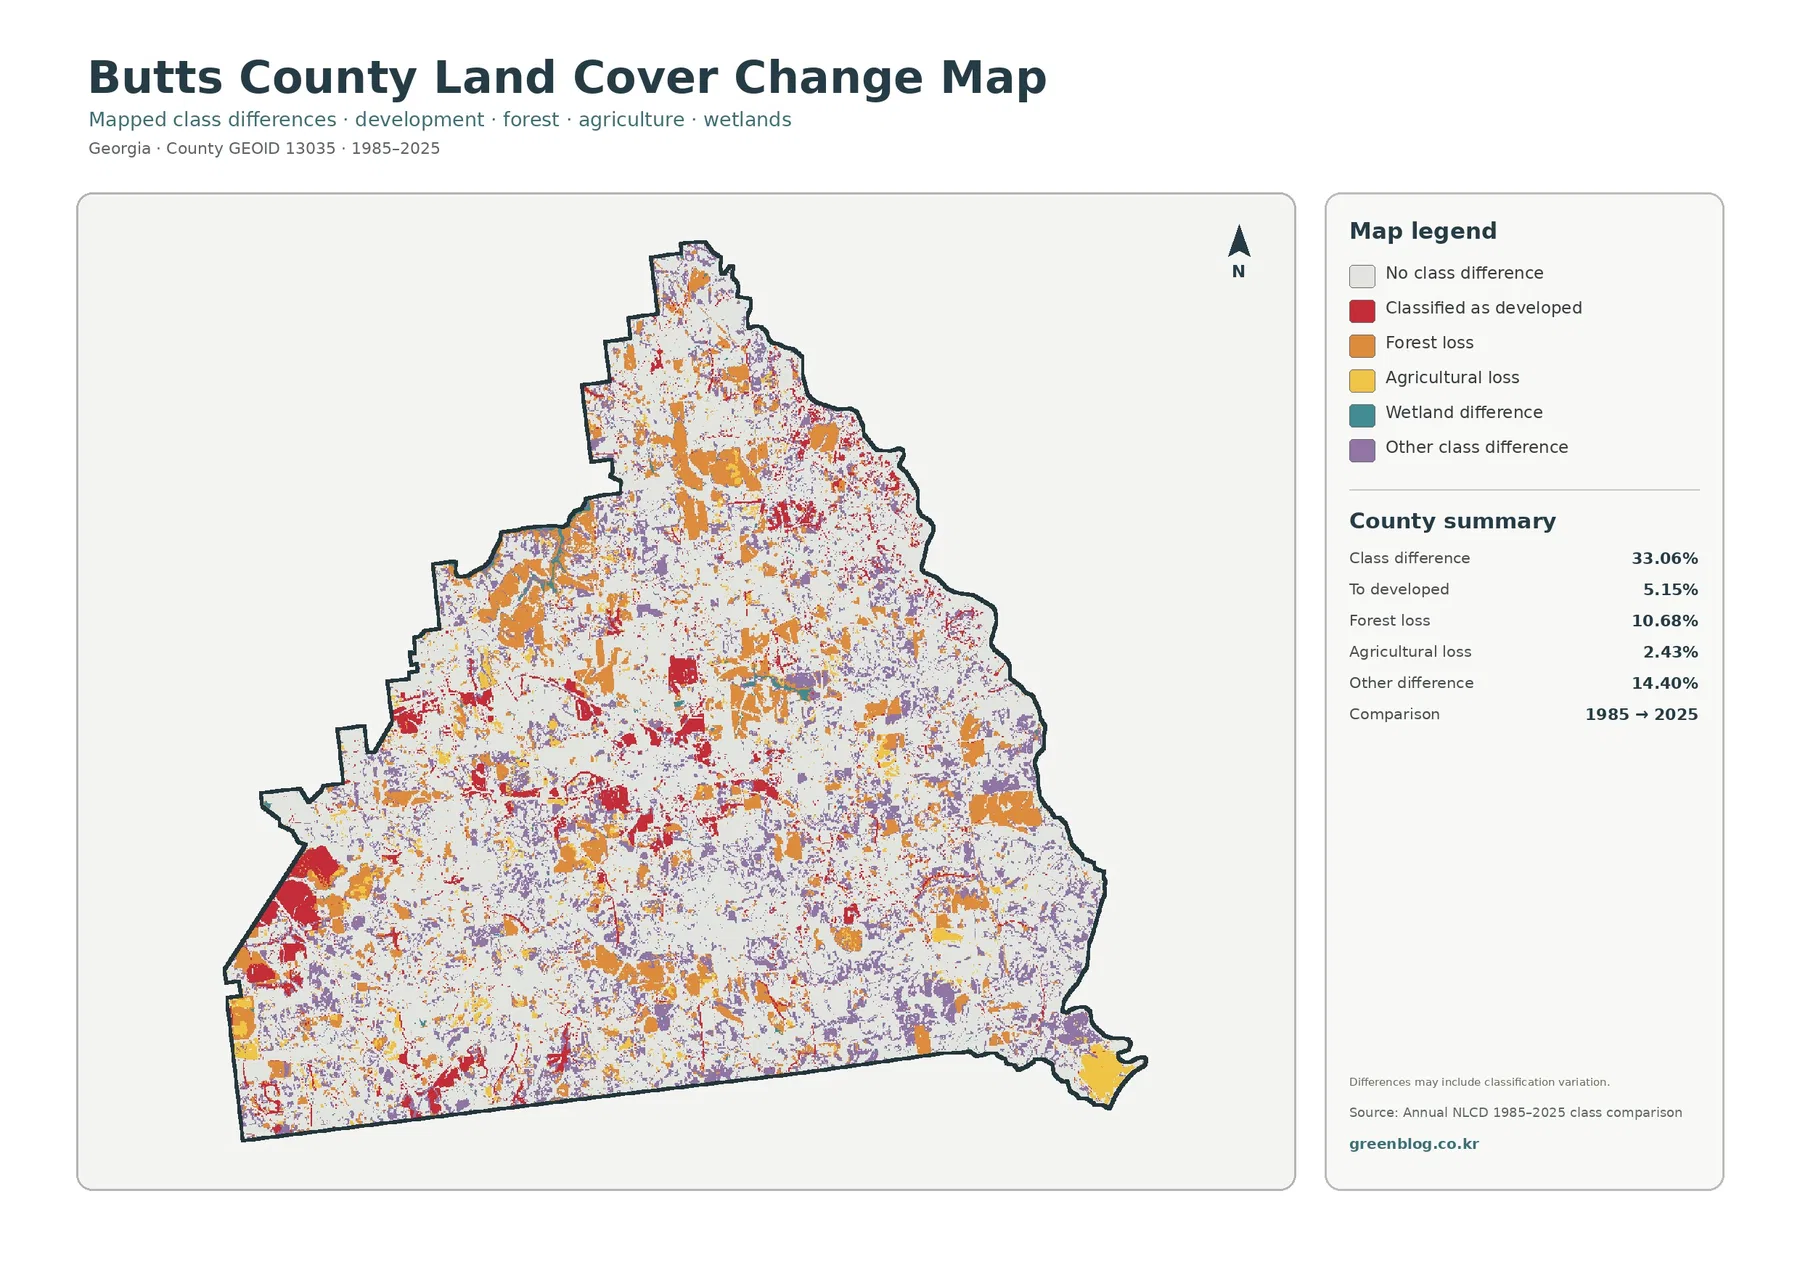
Red change-to-developed patches are most noticeable around the central built area and in parts of the west. Orange forest-loss patches are more widely scattered, appearing in the north, center, west, and south rather than in one isolated zone. Purple “other difference” areas are also distributed broadly. This spatial mix suggests that the comparison is capturing several kinds of class transitions instead of one simple outward wave of development.
A forest-loss classification does not automatically mean that every mapped cell was permanently cleared. A cell that was forest in 1985 and another class in 2025 may reflect land management, harvest and regrowth cycles, conversion, mixed pixels, or differences in classification. Determining what happened on a particular tract requires additional evidence such as annual imagery, aerial photography, forestry records, or parcel-level history.
Likewise, “no class difference” does not prove that a location remained unchanged through all forty years. If the beginning and ending classes are the same, intermediate changes can disappear in a two-date comparison. The map is best used to identify areas worth a closer look and to compare the distribution of broad change categories, not to reconstruct a year-by-year land history.
Frequently Asked Questions
Is forest really the largest land-cover class in Butts County?
Yes. The supplied 2025 county summary lists forest at 54.99%, the largest category. Agriculture follows at 17.83% and developed cover at 12.32%. The forest pattern is also visually broad across the east, southeast, north, and many interior areas. The percentage describes classified surface cover at 30-meter resolution, not the legal acreage of property enrolled in forestry or conservation programs.
Does the 33.06% class-difference figure mean one-third of the county was developed?
No. It means the 1985 and 2025 land-cover classes differ across 33.06% of the mapped area in this comparison. Change to developed accounts for 5.15%, while forest loss is 10.68%, agricultural loss 2.43%, and other difference 14.40%. The map notes that classification variation may be included, so the total should not be interpreted as a development or land-clearing percentage.
Can these maps be used to check a parcel near Jackson for zoning or buildability?
No. They can show whether the surrounding area is classified as developed, forested, agricultural, wetland, or highly impervious at a generalized scale, but they do not contain parcel lines, ownership, zoning, setbacks, or permit status. For those questions, use current records from Butts County Planning and Development and other official parcel or permitting sources.
Using the JPG set for reference, print, and presentation work
The download package contains the original JPG versions of all four maps rather than only the smaller web previews. They can be placed into reports, lesson materials, slide decks, or personal reference folders, and the shared county outline makes side-by-side layouts straightforward. The source package lists each JPG at 2480×1754 pixels and does not mark it as meeting an A3 high-resolution reference, so anyone planning a large print should check the intended physical size and output quality first.
Keeping a short note with the files can make later use easier. The key 2025 values are forest 54.99%, agriculture 17.83%, developed cover 12.32%, mean imperviousness 2.80%, and 50%+ impervious area 1.46%. The long-term comparison reports 33.06% total class difference between 1985 and 2025. These figures come from different map products, so labels and years should stay attached to the numbers rather than being combined into a single “development” statistic.
Map File Information
The download contains the four original JPG maps for Butts County: general land cover, forest and farmland, impervious surface, and mapped land-cover change from 1985 to 2025.
- Included Files: General land cover, forest and farmland, impervious/developed surface, and land-cover change maps
- File Type: Four original JPG map files bundled in one ZIP archive
- Intended Use: Printing, education, presentations, and map-based projects
Related Maps
- Appling County Georgia Land Cover Map
- Atkinson County Georgia Land Cover Map
- Bacon County Georgia Land Cover Map
Scale and classification limits matter at local sites
Annual NLCD is a raster product with 30-meter spatial resolution. In practical terms, the landscape is divided into grid cells, and each cell receives a representative classification or value. A single cell can contain more than one real-world surface, such as trees beside a road or pasture beside a building. These mixed pixels are one reason small features and irregular edges look simplified when compared with aerial photography.
The 2025 map represents conditions as classified for that product year. Construction, clearing, regrowth, farming changes, or other activity after the observation period may not appear. Satellite-derived classification is also different from a field survey, so the maps should be used for broad patterns and comparison rather than exact site measurements.
This distinction is particularly important when comparing land cover with the county comprehensive plan. A future land-use or zoning map expresses policy and regulatory categories; a land-cover map describes what is on the surface according to a remote-sensing classification. Similar-looking boundaries do not make the two datasets equivalent. Property decisions should be based on current Butts County zoning, parcel, and permitting information, not the colors on these images.
Sources and reference material
- MRLC Annual NLCD – official Annual NLCD product information, including the 2025 extension
- USGS Annual NLCD Land Cover Classification – class definitions and product background
- Butts County Planning and Development – county comprehensive planning and development information
- UGA Extension Butts County Agriculture & Natural Resources – local agriculture, forestry, soil, water, and land-management resources
Green Map creates custom-edited map images using open geographic data sources such as geoBoundaries, Natural Earth, OpenStreetMap, and government open data.
These maps are edited visual materials, not raw data files, and are provided for education, documents, presentations, and graphic reference.