Pope County looks very different from a farm-dominated central Illinois county. Forest covers 64.81% of the county in the 2025 summary, while agriculture accounts for 26.41%. The four maps on this page separate the current land-cover pattern, forest and farmland, impervious surfaces, and mapped class differences between 1985 and 2025 so that those contrasts are easier to follow.
The four original JPG maps are available together in one ZIP download. Start with the general map for a countywide view, switch to the forest-and-farmland map when the boundary between wooded and agricultural areas matters, use the impervious map for roads and other hard surfaces, and use the change map only after the current pattern is clear.
Table of Contents
A forest-first land-cover pattern across Pope County
The 2025 summary reports 64.81% forest, 26.41% agriculture, 3.73% developed land, 3.57% wetlands, and 1.32% water. Grassland and shrubland are only 0.10% and 0.04%. Those numbers explain the first impression of the map: dark green is not confined to one corner. It spreads through the broad northern section, continues across the middle, and remains prominent through the long southern extension of the county.
Agricultural cover breaks that forest into openings of very different sizes. Larger yellow areas appear through the south-central and southwestern portions of the main county body, while smaller agricultural pieces are scattered farther north. In the narrow southern section, farm cover appears again near the edges and in several interior openings. The pattern is mixed enough that a single county percentage cannot show where farming and woodland meet.
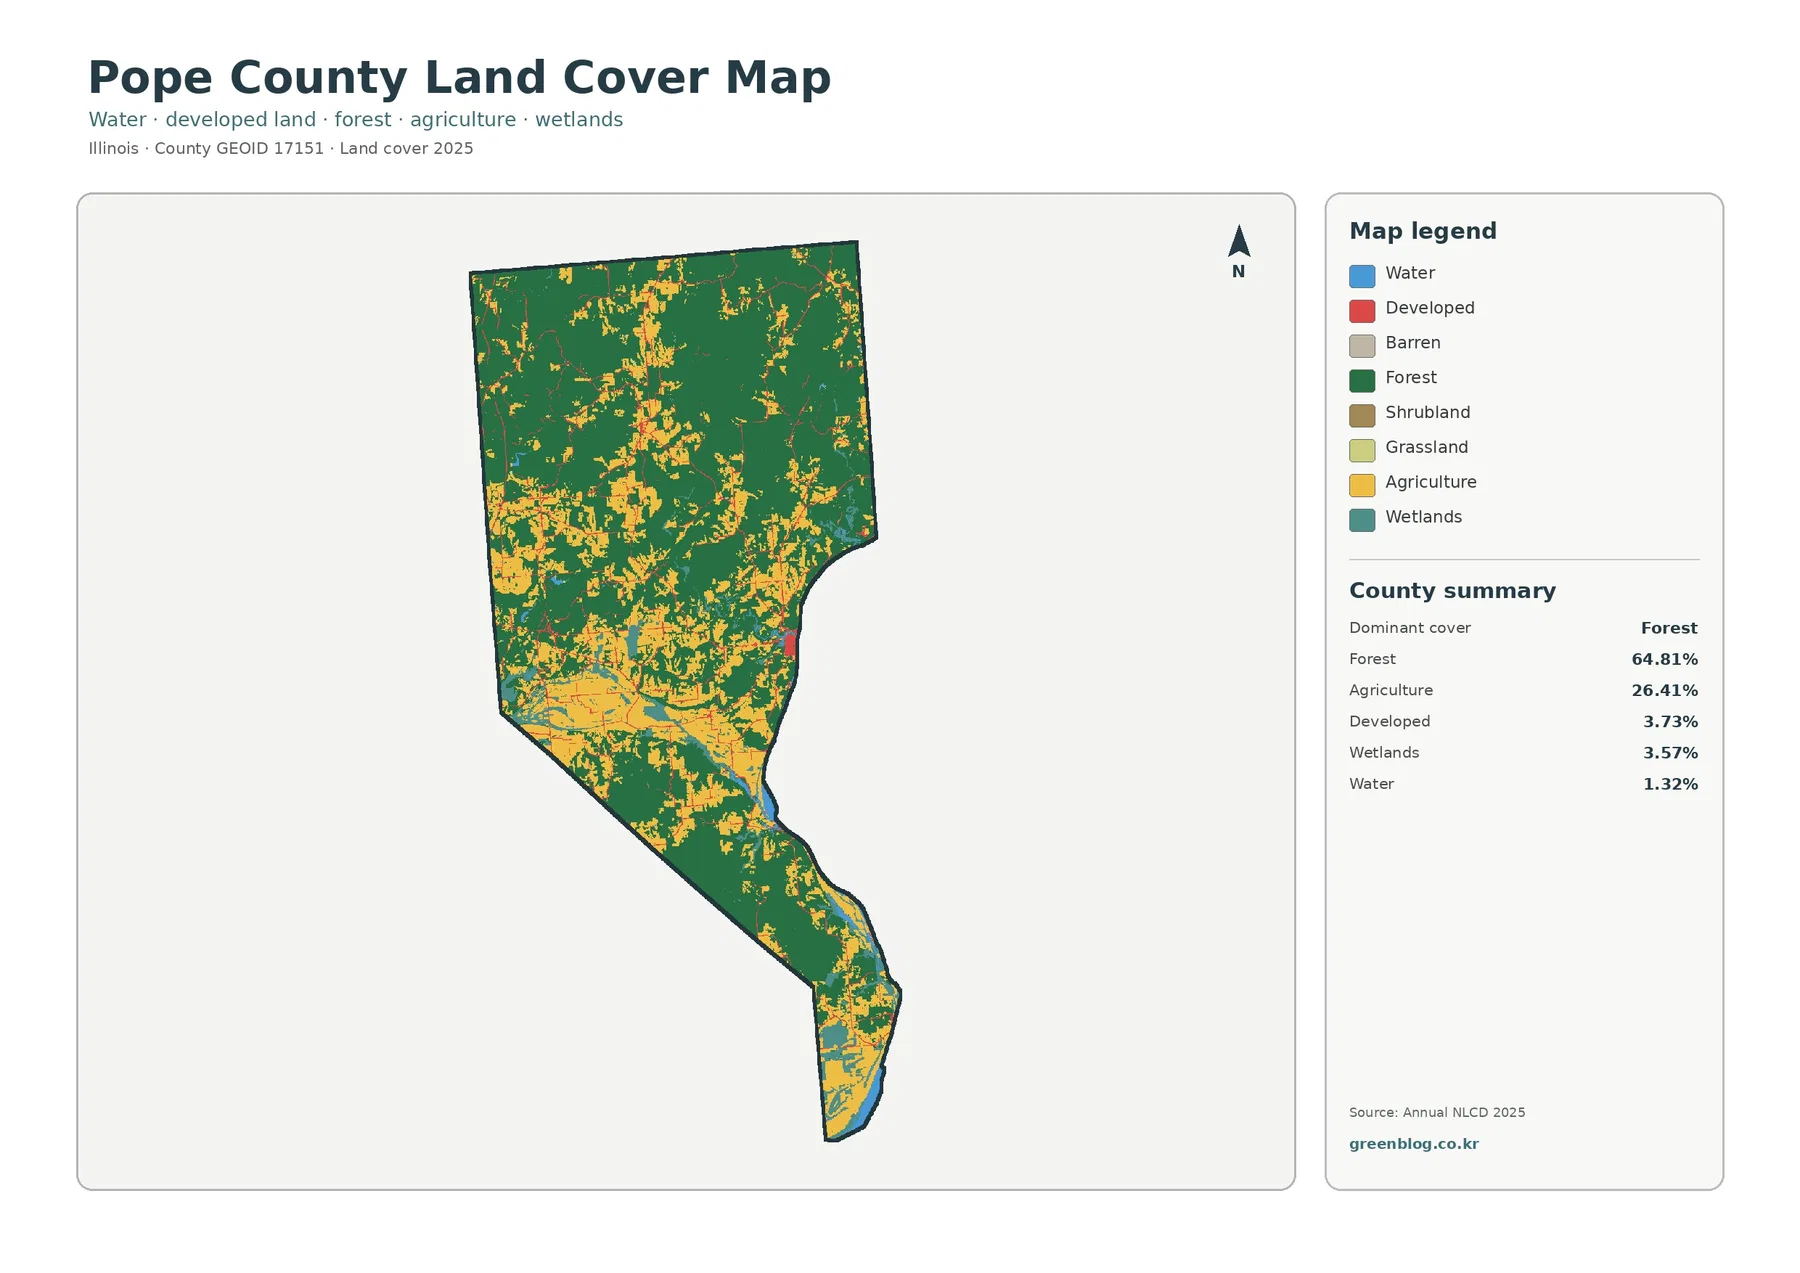
Water and wetlands occupy much smaller shares, yet they are useful geographic markers. Blue water follows parts of the irregular eastern and southern edge, while wetland colors appear close to those low-lying margins and in smaller interior patches. The map does not print river or town names, so it is best used to locate a cover pattern first and then paired with a named reference map when exact geography is needed.
Farm openings stand out because the forest is so continuous
The forest-and-farmland view removes some of the complexity of the general legend. Forest stays dark green, cropland is yellow, pasture and hay are pale green, and water and wetlands remain separate. In Pope County this simplified palette makes the agricultural openings more obvious. They do not form a broad rectangular grid across the county. Instead, they appear as irregular blocks and strips surrounded by wooded cover.
The largest agricultural concentration is visible in the lower half of the main county body, especially toward the southwest and central-south area. Narrow forest fingers divide some of those fields, while other farm patches sit directly against broad wooded areas. Farther north, the balance shifts strongly toward forest, and agricultural pieces become smaller and more scattered. This is the map to use when the main question is where farming gives way to woodland.
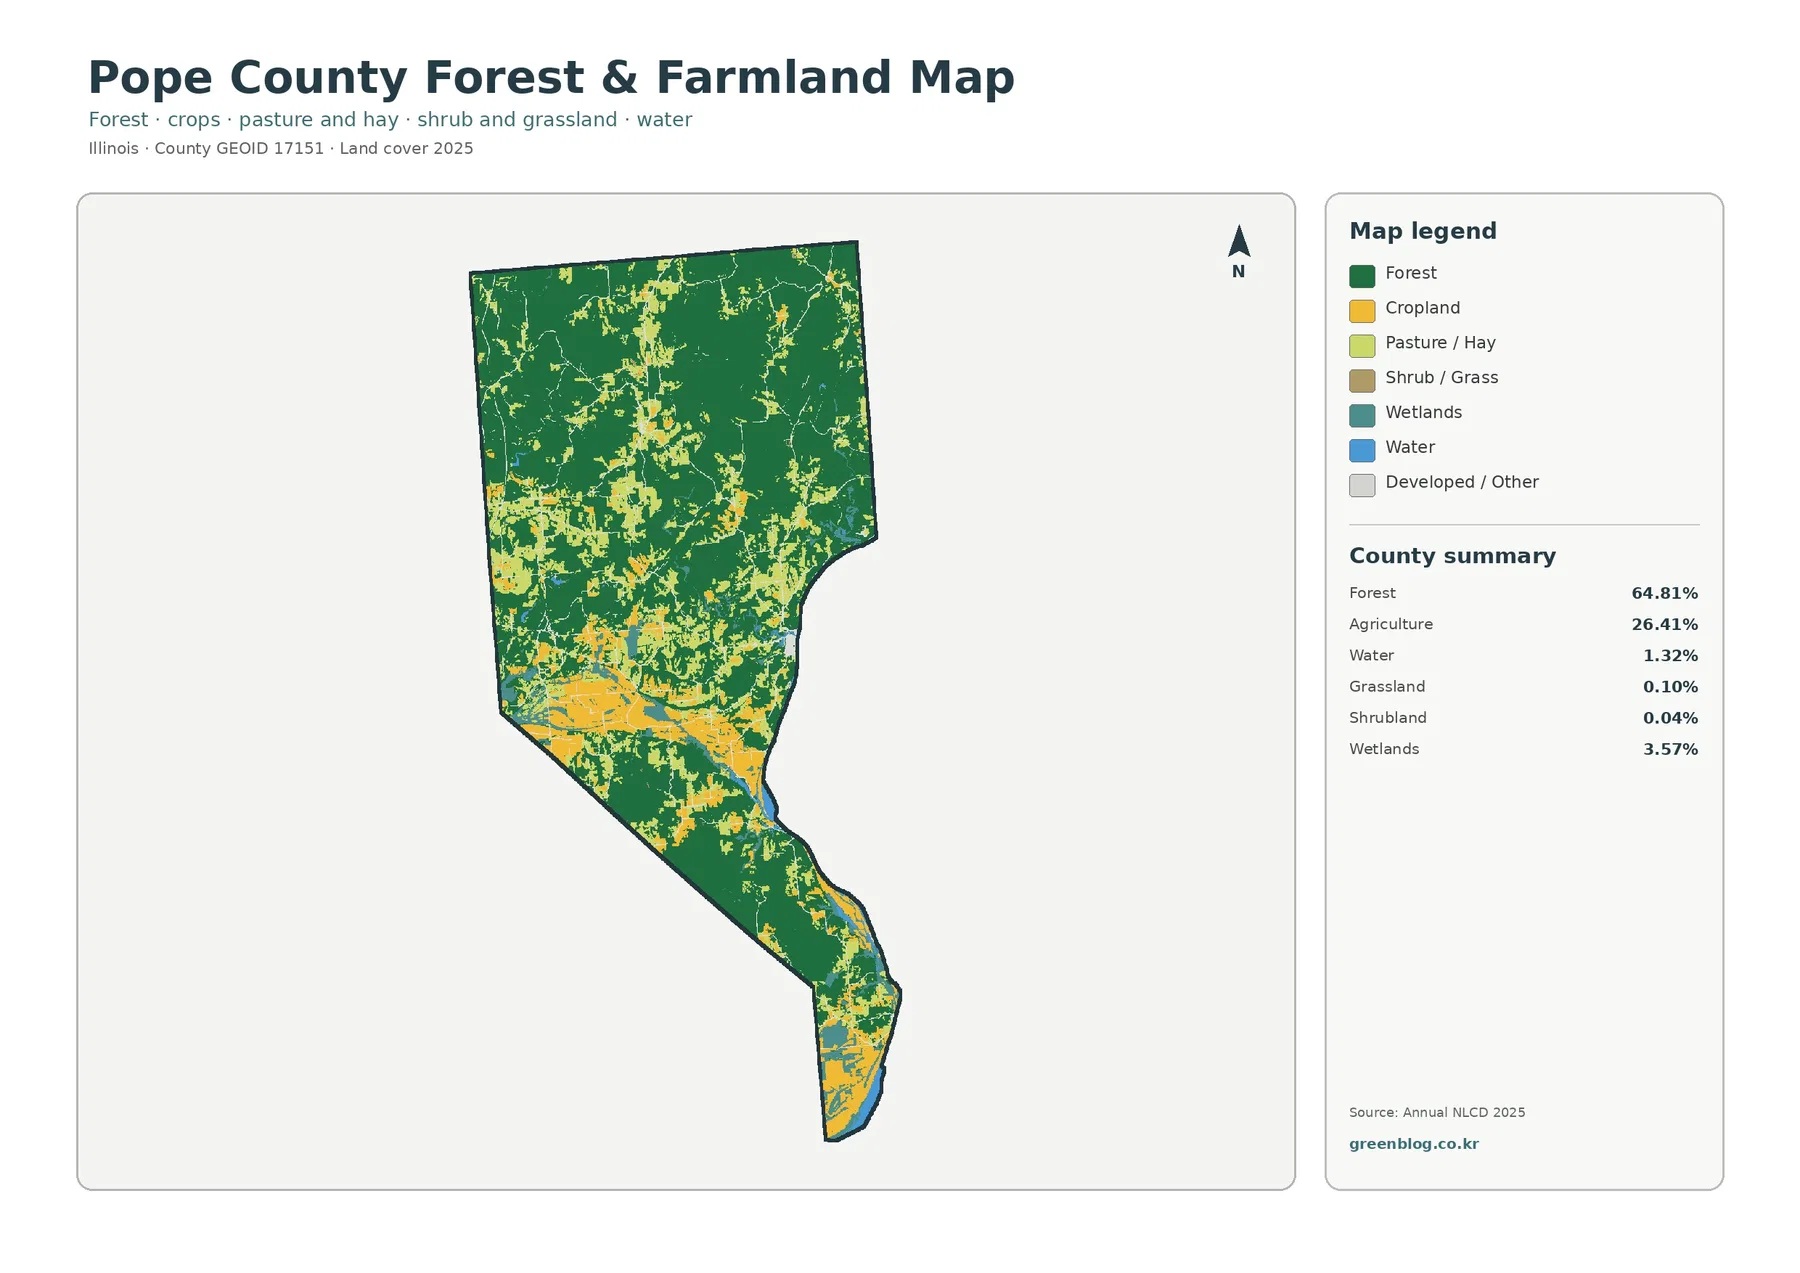
The legend also includes pasture or hay, shrub or grass, wetlands, water, and developed or other cover. These are land-cover classes, not zoning or ownership categories. A yellow cell indicates that the surface was classified as agricultural cover; it does not establish whether a parcel is legally zoned for farming, whether it is privately owned, or whether development would be permitted there.
Pope County also sits within the broader landscape associated with Shawnee National Forest. U.S. Forest Service material for the area describes well-known natural features and wilderness settings such as Garden of the Gods and Lusk Creek. That context helps explain why forest is an important subject here, but the green areas on this map should not be treated as a map of federal ownership. Forest cover and national forest boundaries are different datasets.
Hard surfaces are sparse and narrow rather than broad
Impervious surface means pavement, rooftops, parking areas, and other surfaces that shed water rather than allowing much of it to soak into the ground. Pope County has a mean impervious value of 0.51%. Only 0.08% of the county is mapped at 50% impervious or greater, even though 3.73% of the general land-cover map is classified as developed.
The visual pattern matches those low values. Most of the county is almost white on the impervious map. Thin pale-orange lines trace a limited road network, and a few small orange or red clusters interrupt the light background. One of the more noticeable clusters lies near the irregular eastern side of the main county body, but the map does not label settlements, so the exact place name should be confirmed with a separate road or municipal map.
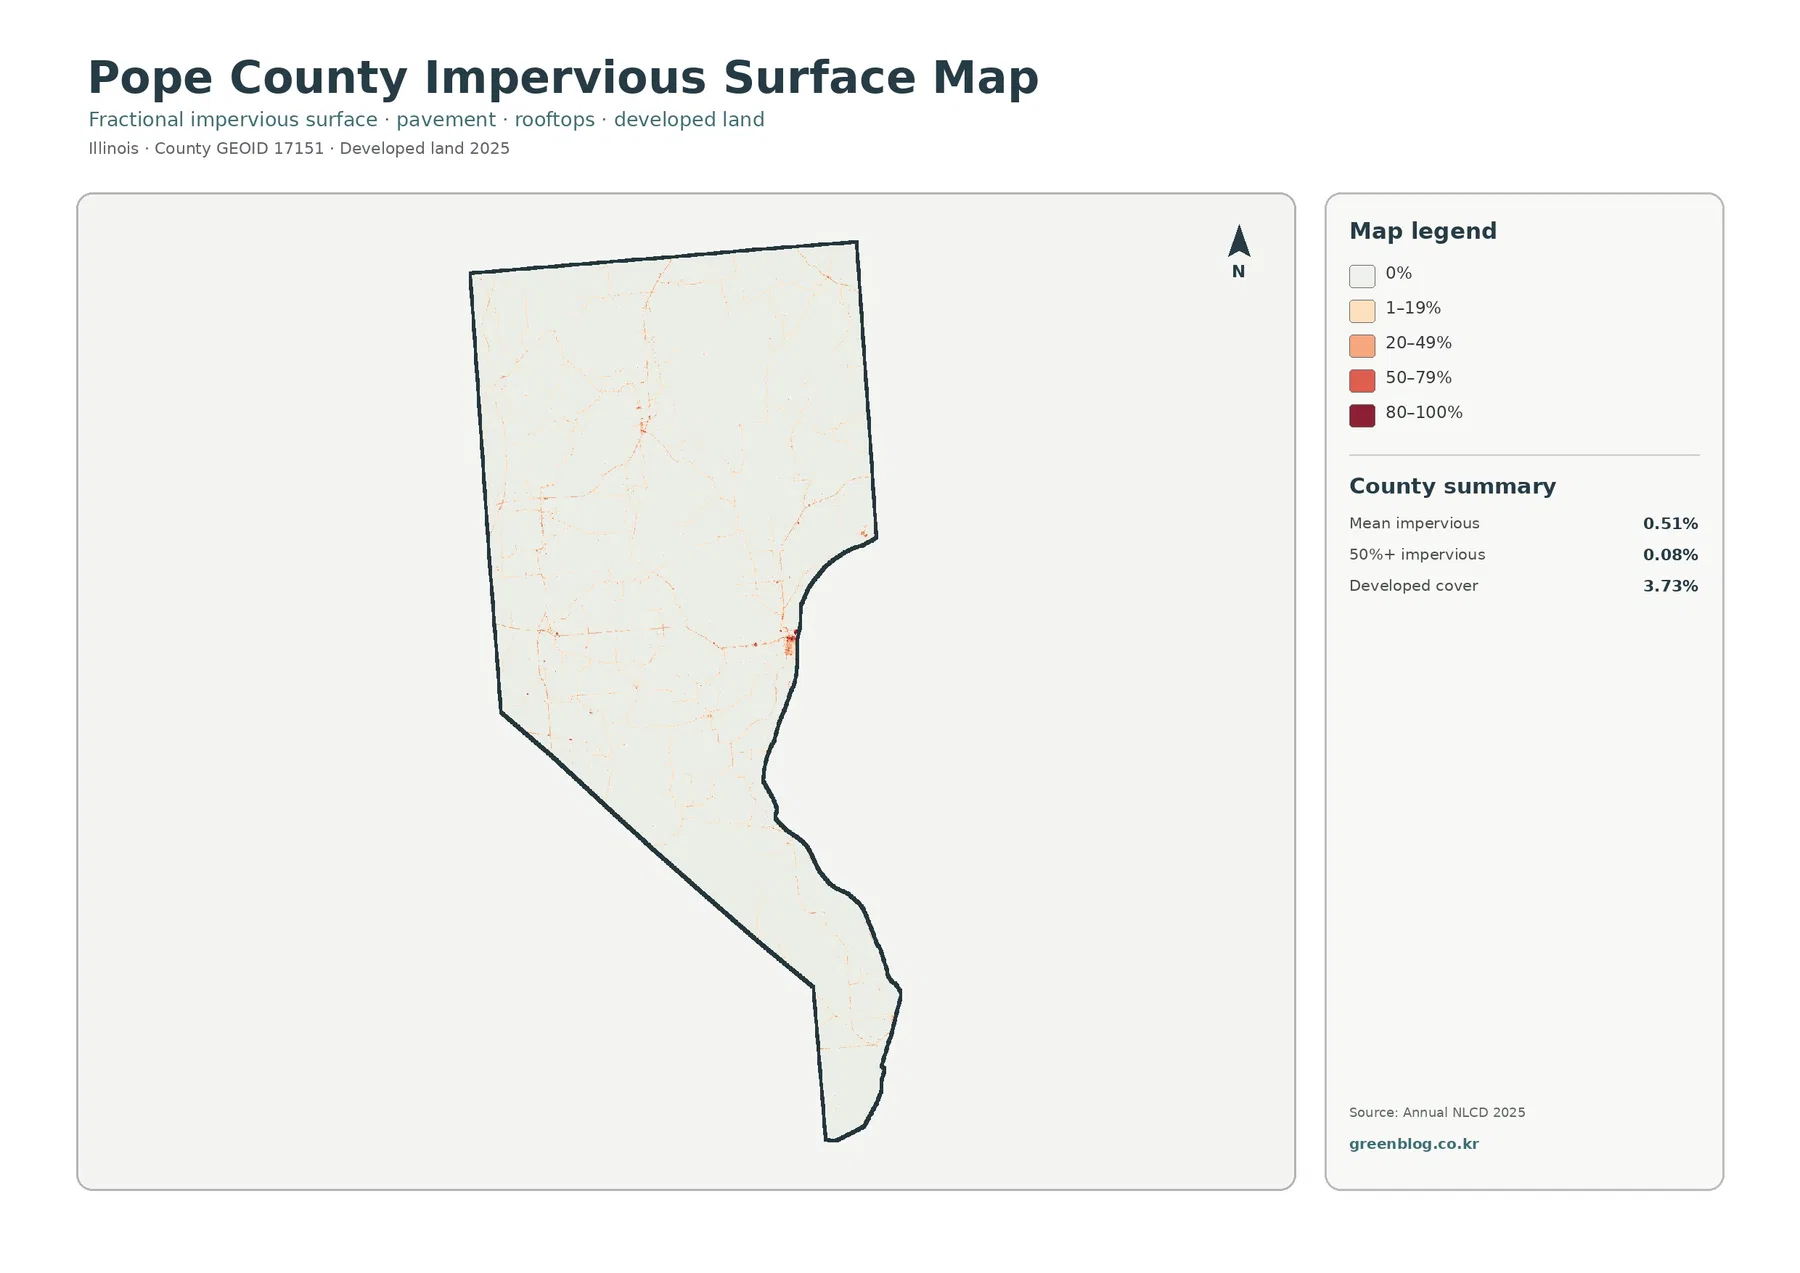
Developed land and impervious surface answer related but different questions. A developed land-cover class can include lawns, scattered trees, and other permeable areas around buildings. The impervious layer focuses on the hard portion of that landscape. That is why the developed share can be 3.73% while the countywide mean impervious value remains just 0.51%.
For a watershed or runoff discussion, the darker impervious cells may deserve attention even though they cover little land. They identify places where water is more likely to run off a hard surface. They do not, however, provide drainage-pipe capacity, road condition, flood depth, or parcel-scale engineering information. Those questions require more detailed local data.
Most mapped 1985–2025 difference falls into the “other” category
The change map compares land-cover classifications from 1985 and 2025. A total of 7.17% of the county is mapped with a class difference. The summary breaks that into 0.49% classified to developed, 0.64% forest loss, 0.87% agricultural loss, and 4.98% other class difference. The last category is much larger than any single named loss category, so it should shape how the map is interpreted.
Purple “other difference” cells are scattered through much of the county, with some larger groupings in the southern half of the main body. Orange forest-loss and yellow agricultural-loss cells appear in smaller patches. Red developed-change cells are comparatively limited. This does not look like one continuous front of urban expansion. It is a dispersed pattern of different mapped class changes across a mostly forested county.
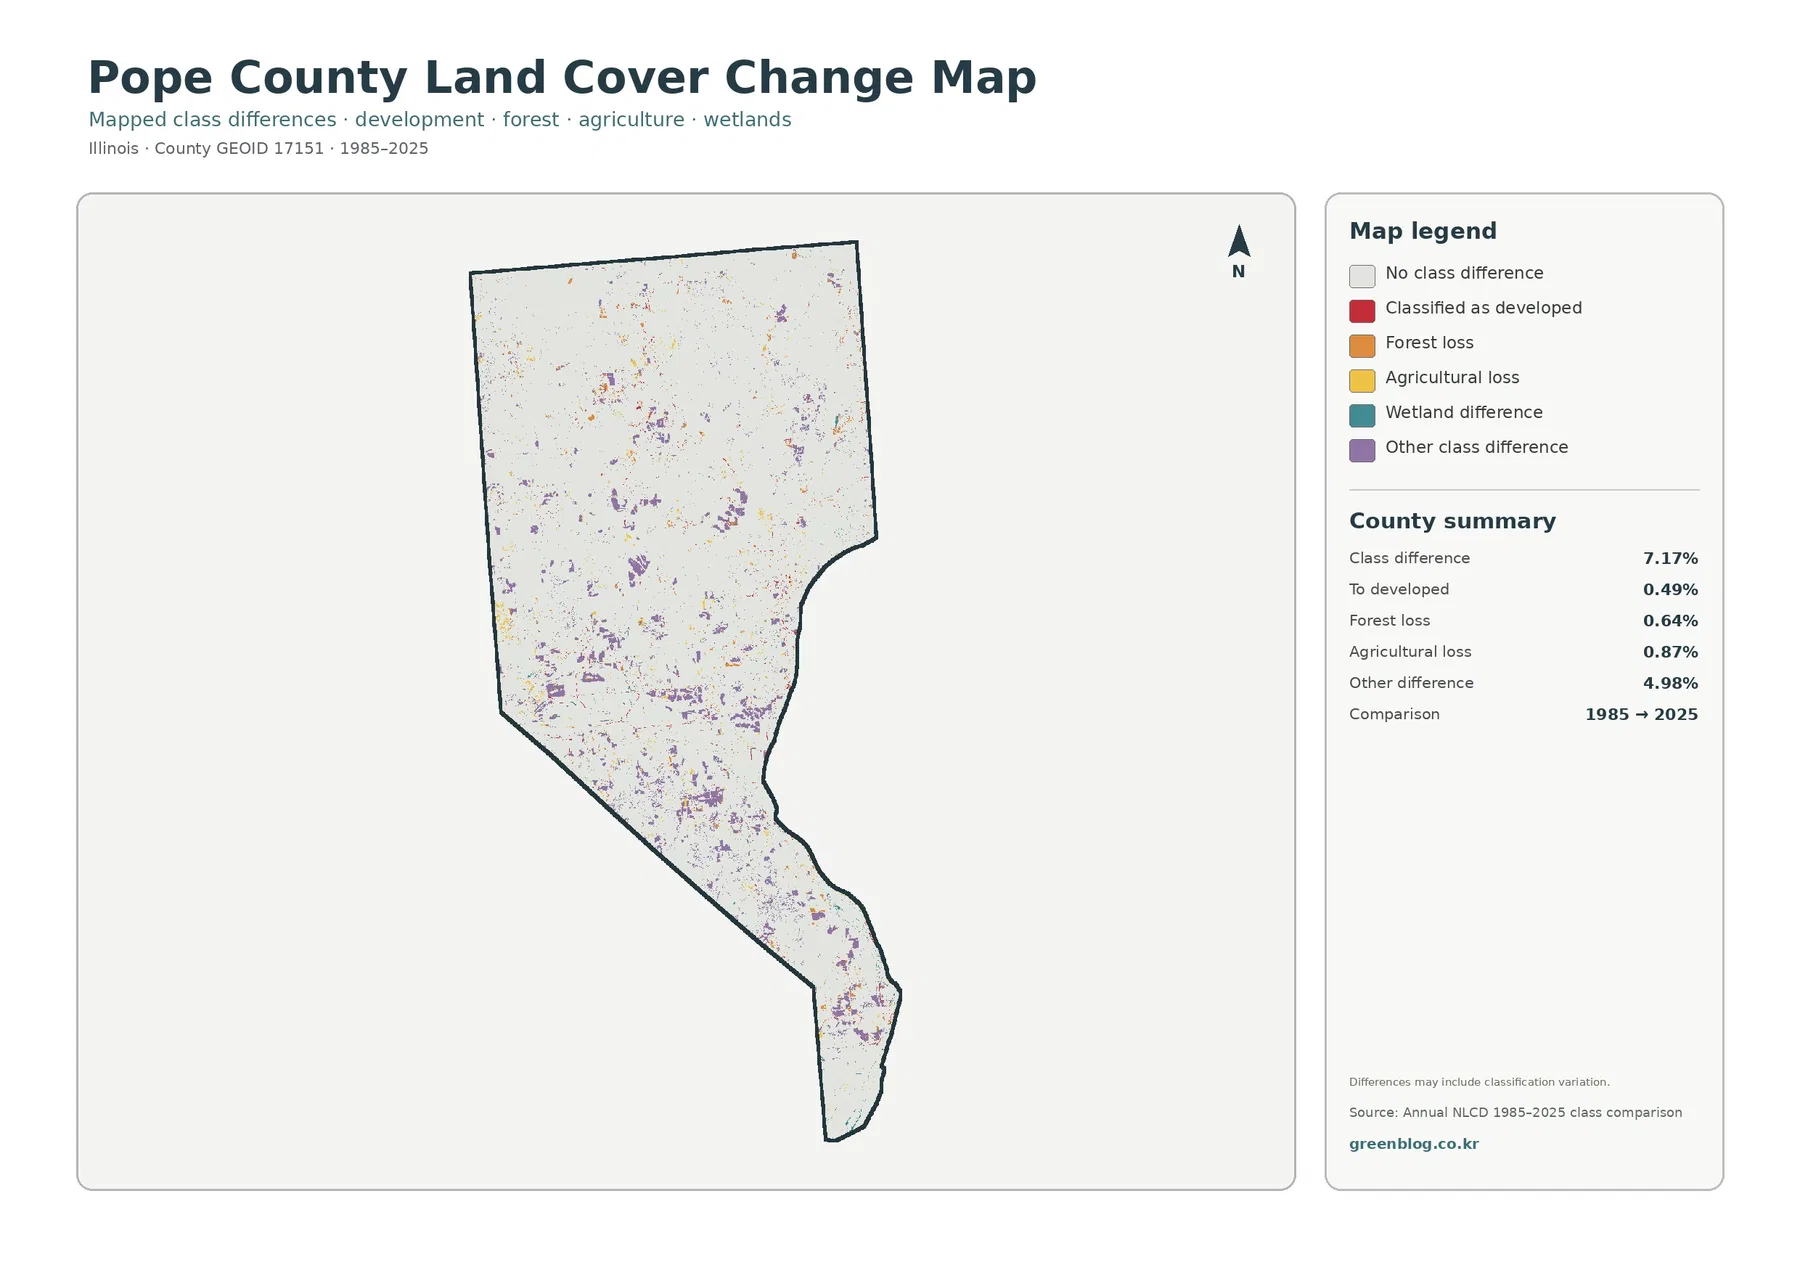
The note on the map is important: differences can include classification variation. A pixel classified as forest at one date and another class at the second date is a real difference between the two products, but it does not by itself identify the cause. Forest management, agricultural rotation, water conditions, imagery, and classification methods can all require separate evidence before a reason is assigned.
Using the map with Shawnee National Forest references
The Forest Service provides useful landscape context for southern Illinois. Its Garden of the Gods material describes the sandstone formations and the Shawnee Hills setting, while other Shawnee National Forest documents identify wilderness areas in and around Pope County. These sources add terrain and management context that a land-cover raster cannot provide. The land-cover maps, in return, show the broad distribution of forest, agriculture, wetlands, water, and developed cover across the entire county.
Keeping those roles separate prevents a common mistake. A national forest recreation map can show a trail, wilderness boundary, road, or managed site, while this land-cover map shows what the surface was classified as in the stated dataset. A dark-green forest cell might be on federal, state, or private land. Ownership cannot be inferred from the color alone.
The Illinois Secretary of State’s county record page places the Pope County Courthouse in Golconda. That kind of named reference is useful when a reader wants to connect a small developed cluster to a real settlement. Because the four maps here do not print town labels, the safe workflow is to locate Golconda on a reference map first and then compare that position with the developed and impervious layers.
A practical reading order for the four maps
For a county profile, begin with the general land-cover map. It immediately establishes the scale of the forest and shows where agricultural, wetland, water, and developed classes interrupt it. The forest-and-farmland map is a useful second step because it strips away some categories and makes the border between wooded and agricultural land much easier to see.
If the subject is settlement or runoff, reverse the emphasis and start with the impervious map. Its nearly blank background makes the small road-like lines and compact hard-surface clusters visible. Then return to the general map to see whether those locations fall inside a broader developed class or sit next to forest and agricultural cover.
Use the change map last. Once the current cover is familiar, scattered purple, orange, yellow, and red cells are easier to interpret as differences within a known landscape. Without that context, a dense patch of change colors can be mistaken for a large new developed area even when the summary shows that only 0.49% is in the “to developed” category.
What these maps are good for—and what they are not
For environmental education, Pope County is a strong example of a heavily forested southern Illinois county. Students can compare the 64.81% forest share with the 26.41% agriculture share and then trace how farm openings are embedded within woodland. The wetland and water classes add another layer when the lesson moves from upland cover to river or lowland settings.
For presentations or county reports, the four maps work best when one question is assigned to each image. The general map answers “what covers the county now?” The forest-and-farmland map answers “where do the two dominant covers meet?” The impervious map answers “where are hard surfaces concentrated?” The change map answers “where did the two classification dates differ?” Keeping those questions separate makes the graphics easier to explain.
For planning or field work, the maps are a starting point rather than a parcel record. Land-cover products are raster classifications, meaning the landscape is represented by grid cells. A cell can contain more than one real-world surface, especially along narrow roads, streams, field edges, and small buildings. Mixed pixels and classification generalization are normal limitations at this scale.
Legal land use, property ownership, zoning, wetland jurisdiction, building approval, and exact boundary questions require the current records of the responsible agencies. These maps also represent the dataset dates shown on the graphics. A new clearing, building, road improvement, crop change, or water-level change after the observation period may not appear until a later land-cover product.
When printing, use one map at a readable size instead of shrinking all four into a single small panel. The legends contain different categories and ranges, so a full-size image preserves the details that matter. A second map can be added beside it when a direct comparison is needed, such as forest-and-farmland next to impervious cover or current land cover next to the 1985–2025 difference map.
Frequently Asked Questions
What is the dominant land cover in Pope County?
Forest is the dominant 2025 class at 64.81%. Agriculture is second at 26.41%, followed by developed land at 3.73%, wetlands at 3.57%, and water at 1.32%. The forest pattern is also visually dominant, extending through both the broad northern section and the county’s narrow southern portion.
Why is developed land 3.73% while mean impervious cover is only 0.51%?
A developed land-cover class can include vegetation around homes, roads, and other built features. Impervious cover measures the harder surfaces within that landscape, such as pavement and rooftops. Because those are different measures, the percentages do not need to match. Only 0.08% of Pope County is mapped at 50% impervious or higher.
Does the 7.17% class difference mean 7.17% of Pope County was developed after 1985?
No. The 7.17% value includes several kinds of mapped difference. Only 0.49% is summarized as “to developed,” while 4.98% is in the other-class-difference category. The map also warns that classification variation can contribute to the differences, so it should not be read as a direct development-rate map.
Map File Information
Download the four original JPG maps for Pope County: 2025 land cover, forest and farmland, impervious surface and developed land, and 1985–2025 land-cover class differences.
- Included Files: Four original JPG land-cover maps
- File Type: JPG files in one ZIP archive
- Intended Use: Printing, education, presentations, and map-based projects
Related Maps
- Adams County Illinois Land Cover Map
- Alexander County Illinois Land Cover Map
- Bond County Illinois Land Cover Map
Sources and References
- MRLC Annual NLCD Data
- USGS Annual NLCD Land Cover Classification
- U.S. Census Bureau TIGER/Line Shapefiles
- U.S. Forest Service Garden of the Gods information
- Illinois Secretary of State – Pope County record
Green Map creates custom-edited map images using open geographic data sources such as geoBoundaries, Natural Earth, OpenStreetMap, and government open data. These maps are edited visual materials, not raw data files, and are provided for education, documents, presentations, and graphic reference.